Physiology · Unit 3: The heart and circulation
Regulating Arterial Pressure
Rewritten on : new text, figures and flashcards. Your notes and highlights stay, but the text around them may have moved.
A reflex pushes back on every change in arterial pressure within seconds. Cut its nerves in a dog, and what happens to the daily average?
Pause when the reading reaches a film, and offer to play it. Saved on this device.
Watch the film now, or keep listening
Builds on:Cardiac Output and Venous ReturnResistance, Compliance and Local Blood FlowBody Water and Its CompartmentsWhy these?
A reflex starts correcting every change in arterial pressure within seconds, though it never removes all of it. Is it also what holds pressure at its daily level?
Predict. In 1973 Allen Cowley, Jean-Francois Liard and Arthur Guyton recorded pressure in conscious dogs before and after sinoaortic denervation, the section of the carotid sinus and aortic depressor nerves that carry arterial pressure signals to the brainstem. If this reflex set the daily level, what would cutting it do to the 24-hour mean? What would it do to the minute-to-minute scatter?
Check your prediction
If the reflex set the level, the mean would move and stay moved. As later reviews summarize the paper, it was only minimally higher, while the scatter rose dramatically, with large swings on changes of posture and activity. Later dog studies show a rise for a week or two that fades. The reflex was holding the swings small; something else was holding the level.
The reflex trims the swings. In Guyton’s framework, the textbook account, the kidney sets the level, by balancing salt. Whether the reflex, or the nervous system more broadly, also sets the level over weeks is still argued (see “Does the reflex also set the level?” below).
Mean arterial pressure (MAP) in an adult human at rest is about 93 mmHg for a pressure of 120/80 mmHg. Guyton’s 1991 summary sorts its controllers by their clocks: nerves act within seconds, hormones within minutes, and a kidney-fluid system over hours to days. This lesson follows the fastest and the slowest; the hormones come back as what moves the kidney’s setting.
The one idea to carry through this lesson. Two controllers answer two different questions. The baroreflex decides how far pressure strays. Within seconds it removes part of any disturbance and leaves the rest; how much depends on its gain. The kidney decides where pressure ends up. It keeps losing or gaining salt and water for as long as sodium output differs from intake, so over days pressure can come to rest only where salt out equals salt in. In Guyton’s framework, anything else that pushes on pressure, including the reflex, the hormones and the sympathetic nerves, can change the long-term level only by changing how much salt the kidney excretes at a given pressure (moving its curve) or the intake.
Where it holds:
- At steady state, over days to weeks, with a fixed salt intake and excretion that depends on renal perfusion pressure.
- If a disturbance moves the curve itself (renal vasoconstriction, angiotensin II, renal sympathetic nerves, a sodium-channel mutation such as Liddle syndrome, below), the level moves with it.
The fast buffer: the baroreflex
Baroreceptors are stretch receptors in the walls of the two carotid sinuses, where each common carotid artery divides, and in the aortic arch. They sense not pressure but the stretch it causes in the wall. Low-pressure cardiopulmonary receptors in the atria, ventricles and great veins report central blood volume instead. For the channels that turn stretch into firing, see vagal sensory neurons, mechanotransduction channels.
Follow a rise in pressure through the arc:
- Stretch. The sinus and arch walls stretch, and the receptors fire faster.
- Afferents. Carotid sinus afferents run in a branch of the glossopharyngeal nerve, cranial nerve IX. Aortic arch afferents run in the vagus, cranial nerve X.
- First relay. Both end in the nucleus of the solitary tract (NTS).
- Sympathetic branch. The NTS excites the caudal ventrolateral medulla, which inhibits the rostral ventrolateral medulla, the source of tonic sympathetic drive. Sympathetic output falls.
- Vagal branch. The NTS also excites vagal motor neurons in the dorsal motor nucleus and the nucleus ambiguus. Vagal output to the heart rises.
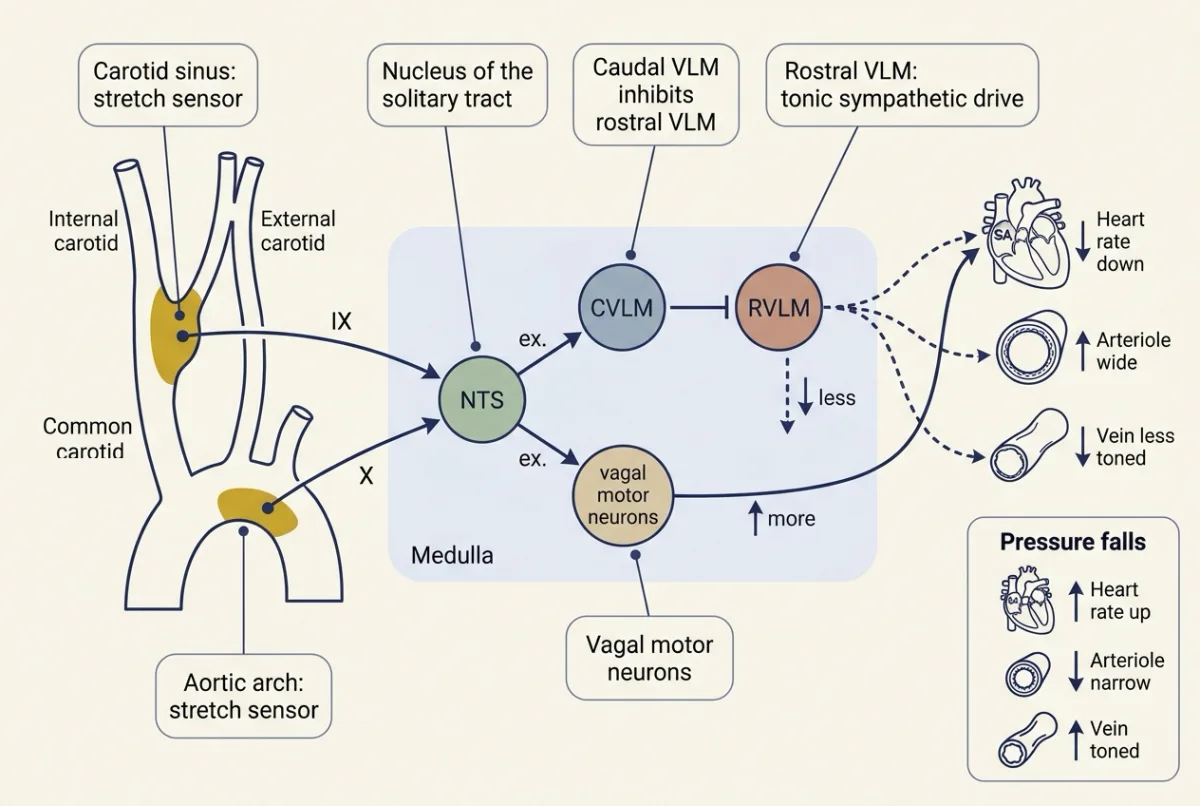
Autonomic anatomy and transmitters are in the hypothalamus and autonomic control; the carotid body chemoreceptors at the same bifurcation are in control of breathing. The output acts on three effectors, because mean arterial pressure (MAP) has two determinants:
MAP = cardiac output x total peripheral resistance, and from a pressure trace, MAP is about diastolic pressure + pulse pressure / 3
Both come from resistance, compliance and local flow. After a rise in pressure, the interbeat interval lengthens and heart rate falls. Arteriolar smooth muscle relaxes and total peripheral resistance falls (smooth muscle). Venous tone falls, lowering mean systemic filling pressure and venous return (cardiac output and venous return). A fall in pressure reverses every arrow. The share each effector carries changes with timing and conditions.
Gain: how much error the reflex leaves
A fast controller is judged by how much error it leaves, not by whether pressure ends up normal. Three quantities, all in mmHg:
- The disturbance, D, is what pressure would do with the reflex cut, the open-loop change.
- The remaining error, E, is how far pressure still sits from its start once the reflex has acted.
- The correction, C, is the part the reflex removed.
Gain is correction divided by remaining error at steady state, G = C / E, extending the threshold-and-gain vocabulary of the hypothalamus and autonomic control. Three lines give what the reflex leaves:
- In a linear model the reflex’s push is proportional to the error it still sees; at steady state that is the definition: C = G × E.
- The disturbance is split between what was corrected and what remains: D = C + E.
- Substitute the first line into the second: D = G × E + E = (1 + G) × E. So E = D / (1 + G).
The 1 is there because the reflex pushes back only in proportion to an error that still exists. If the error went to zero, so would the correction.
Worked problem, part A: how much of a disturbance does the reflex remove?
Illustrative round numbers, not measured values. Assumptions: an adult human at rest, steady state, linear relations, and a step rise in total peripheral resistance as the disturbance. One illustrative baseline, 100 mmHg (rounded up from the resting value of about 93), runs through the whole lesson.
- Baseline. MAP is 100 mmHg. With the reflex cut, the disturbance would take it to 120 mmHg: an open-loop change of +20 mmHg.
- Close the loop. With the reflex intact, MAP settles at 106.7 mmHg, so the remaining error is 6.7 mmHg and the correction is 20 − 6.7 = 13.3 mmHg.
- Gain. 13.3 / 6.7 = 2.0.
- Check. Remaining error = D / (1 + G) = 20 / 3 = 6.67 mmHg, which matches.
A gain of 2 removes two thirds of a fast disturbance.
Predict. Make the reflex more than twice as strong, a gain of 5 instead of 2. How much of the 20 mmHg remains?
Check your prediction
20 / (1 + 5) = 3.3 mmHg. Two and a half times the gain only halves the error. Each extra unit buys less; no finite gain reaches zero.
Resetting: why the reflex may not hold a level
Baroreceptors also reset: they shift their firing range toward the prevailing pressure, so a steady error is reported more weakly. Resetting can be incomplete, so a sustained change in pressure can still alter reflex output. Part A’s model, with a fixed gain and no resetting, leaves pressure at 106.7 mmHg. On Cowley’s argument, a sensor that drifts toward whatever pressure it sees cannot be expected to pin pressure to one value for days: as it resets, its correction wanes, so the error it leaves would tend to grow. Whether resetting is complete enough to matter chronically is the open question taken up below. On Guyton’s argument, next, the kidney removes the error.
The slow setter: the kidney balances salt
Put mean arterial pressure along the bottom and the kidney’s sodium excretion, in mEq per day, up the side. As pressure rises, the kidney excretes more sodium, and water follows. This is pressure natriuresis (glomerular filtration, tubular transport), and the rising line is the renal function curve. Now draw what you eat: sodium intake is a flat line, the same at every pressure. The two lines cross at one point.
That crossing is the only pressure at which salt in equals salt out. To the right of it the body loses salt and water; to the left it gains them. The difference piles up, day after day.
In words Sodium excretion rises in proportion to how far mean pressure sits above a threshold. Pressure settles where excretion matches what you eat.
- slope“slope”
- extra sodium excreted per day for each mmHg; 10 heremEq/day per mmHg
- threshold“threshold”
- where the line meets zero excretion; 85 mmHg heremmHg
- intake“intake”
- sodium eaten per day; 150 heremEq/day
Sanity check Solve 150 = 10 × (MAP − 85): MAP − 85 = 15, so MAP = 100 mmHg. A steeper slope or a lower threshold lowers the balance pressure; a higher intake raises it.
Need a refresher? rates and “per” · units and prefixes
Worked problem, part B: one disturbance, two clocks
Illustrative straight lines, not fitted to data. Assumptions: intake held at 150 mEq/day, a resistance rise that spares the renal circulation so the curve is unchanged, and resistance raised the whole time. Follow the part A disturbance over the following days.
| Pressure (mmHg) | Excretion, 10 × (MAP − 85) | Intake | Net, per day |
|---|---|---|---|
| 106.7 (the reflex’s best) | 217 | 150 | lose 67 |
| 103 | 180 | 150 | lose 30 |
| 101 | 160 | 150 | lose 10 |
| 100 | 150 | 150 | balance |
Each day’s loss shrinks extracellular volume, which lowers mean systemic filling pressure, venous return and cardiac output, so pressure falls (cardiac output and venous return). Lower pressure means less excretion, so the loss slows, but it does not stop until pressure reaches 100 mmHg, the crossing point. Resistance is still raised, so cardiac output is now lower than before (MAP = cardiac output × total peripheral resistance). The reflex left an error of 6.7 mmHg; the kidney leaves none, over days rather than instantly.
The reflex’s error is fixed by its gain. The kidney has no fixed gain. It keeps changing volume while any imbalance remains, so over days its effective gain grows without limit and the error shrinks toward zero. Guyton called this the kidney’s infinite gain. In Guyton’s framework it is slow, but it has the final say.
So a push that leaves the curve where it is gets cancelled. To hold a new level, it has to move the curve or change the intake.
Worked problem, part C: move the curve instead
Same assumptions, intake 150 mEq/day unless stated.
- Shift it. Move the curve 10 mmHg to the right: excretion = 10 × (MAP − 95). Balance needs 150 = 10 × (MAP − 95), so MAP = 95 + 15 = 110 mmHg, sustained, at the same intake.
- Flatten it. Tilt it through the same normal point: excretion = 5 × (MAP − 70). At 150 mEq/day this also gives 100 mmHg (check: 5 × 30 = 150).
- Add salt. Raise intake to 250 mEq/day. The normal curve now balances at 110 mmHg, a rise of 10. The flat curve balances at 120 mmHg, a rise of 20.
A shallower curve means a larger change in pressure for each increment of salt. That is what salt sensitivity means. These slopes are chosen for easy arithmetic; a real normal chronic curve is much steeper, because angiotensin II and aldosterone fall on a high salt intake, so the same salt step raises pressure far less.
Try it below: raise the gain and only the reflex’s bar moves; shift the curve or change the intake and the kidney’s bar moves.
- Remaining error = D / (1 + G)
- Correction = D − remaining error
- Gain = correction / remaining error
- Kidney: excretion = slope × (MAP − threshold) = intake
In this sketch: an illustrative model, not fitted to data, for an adult human at rest in steady state with linear relations and a step rise in total peripheral resistance as the disturbance. One illustrative baseline, 100 mmHg, which is also where the unshifted curve balances an intake of 150 mEq/day. The lesson’s own illustrative numbers are the renal slope of 10 mEq/day per mmHg with a threshold of 85 mmHg (part B) and the flattened curve, 5 mEq/day per mmHg with a threshold of 70 mmHg, through the same normal point (part C). Made up for the sketch: the slider ranges and extending the straight lines beyond the worked values. Baroreceptor resetting is left out.
A reflex of gain G shrinks a disturbance to D / (1 + G) but never to zero, while the pressure the kidney settles at is where excretion equals intake, so it moves only when the curve or the intake moves.
How the curve gets moved
Signals that make the kidney hold more sodium at a given pressure move it right, toward higher pressure. Signals that make it shed sodium move it left.
In order: low pressure at the kidney releases renin, which leads to angiotensin II, which releases aldosterone, and the kidney holds more salt, raising pressure.
Renin is an enzyme made by juxtaglomerular cells around the afferent arteriole. Three inputs raise its release:
- a fall in renal perfusion pressure;
- a fall in NaCl delivery sensed at the macula densa;
- beta-1 adrenergic input, which is how the renal sympathetic nerves act on it.
Angiotensin II feeds back negatively on renin release. Renin cleaves angiotensinogen, made in the liver, to angiotensin I, and angiotensin-converting enzyme makes angiotensin II.
| Signal | Source and trigger | Main actions | Effect on the curve |
|---|---|---|---|
| Angiotensin II | Made from angiotensin I | Constricts systemic arterioles; releases vasopressin; stimulates aldosterone secretion and sodium reabsorption | Right |
| Aldosterone | Adrenal zona glomerulosa, stimulated by angiotensin II | Binds the mineralocorticoid receptor and brings epithelial sodium channels (ENaC) to the apical membrane of collecting tubule cells (the adrenal glands) | Right |
| Vasopressin | Posterior pituitary; released by a rise in plasma osmolality and, strongly, by a large fall in circulating volume or pressure | V2 receptors and aquaporin-2: water reabsorption in the collecting duct, its main action on volume. V1a receptors: arterial constriction at the higher concentrations of hypovolemia | Mainly holds water rather than sodium; on its own shifts the chronic level little |
| Atrial and B-type natriuretic peptides | ANP from the atria, released by atrial stretch; BNP released mainly from the ventricles | Diuresis, natriuresis and a fall in pressure (the kidney, water, sodium and potassium) | Left |
| Renal sympathetic nerves | Sympathetic outflow | Raise renin release (beta-1 receptors); raise tubular sodium reabsorption and constrict renal vessels (alpha-1 receptors) | Right, through renin and directly |
The V1a receptor and the angiotensin II receptor AT1 are both G protein-coupled (G proteins).
Liddle syndrome: one channel moves the curve
In Liddle syndrome, gain-of-function mutations in the beta or the gamma subunit of ENaC leave more channels active in the apical membrane of the collecting duct. Sodium reabsorption is higher at any perfusion pressure, so the curve sits to the right. Reabsorption and extracellular volume rise first, then arterial pressure, until pressure natriuresis restores balance at the new, higher level. The lumen-negative potential that sodium entry creates also drives potassium secretion, so plasma potassium is often low.
Predict. In Liddle syndrome, is renin high or low? Primary aldosteronism, in which the adrenal makes aldosterone without renin’s signal, also raises pressure, partly through ENaC. Which measurement tells the two apart?
Check your prediction
Renin is low. The high pressure and volume suppress it, and angiotensin II and aldosterone fall with it. In primary aldosteronism renin is also low, but aldosterone is high. So renin alone does not separate them; aldosterone does (the adrenal glands).
One reflex, three tests
Standing up, losing blood and straining follow one rule. When pressure falls, the baroreceptors are unloaded: sympathetic outflow rises and vagal outflow falls, so heart rate, resistance and venous tone rise. When pressure rises, they are loaded and the reverse happens. Only the mechanical cause changes.
Standing up
- Gravity moves blood into the veins of the legs and abdomen.
- Venous return, stroke volume, cardiac output and arterial pressure fall for a few beats, and carotid sinus stretch falls with them.
- Sympathetic outflow rises and vagal outflow falls. Heart rate, resistance and venous tone rise until pressure recovers.
A fall in blood volume
- Venous return, cardiac output and pressure fall.
- Seconds: arterial and cardiopulmonary receptors unload. Sympathetic outflow, heart rate and total peripheral resistance rise.
- Hormones: renin, angiotensin II, aldosterone and vasopressin rise. Atrial stretch and natriuretic peptide release fall.
- Fluid: capillary refill from the interstitium begins (capillary exchange and lymph).
A Valsalva strain is a forced expiration against a closed airway, in four phases. In phase II the raised pressure in the chest lowers venous return, left ventricular size, stroke volume and output, so arterial pressure falls.
Predict. Late in phase II the strain is still on and venous return is still low, yet arterial pressure partly recovers. What rose?
Check your prediction
Total peripheral resistance. The falling pressure unloads the baroreceptors, sympathetic activity rises and the arterioles constrict, while heart rate rises. Not stroke volume: venous return is still low.
| Phase | Mechanical cause | Arterial pressure | Heart rate | Why |
|---|---|---|---|---|
| I, strain begins | Sudden rise in intrathoracic pressure | Rises briefly | May slow slightly | Mechanical push; loaded baroreceptors |
| II, strain held | Venous return and stroke volume fall | Falls, then recovers late | Rises as pressure falls | Unloaded baroreceptors; sympathetic activity raises resistance |
| III, release | The strain ends | Brief further fall | Stays high | The phase I push is removed; baroreceptors still unloaded |
| IV, after release | Stroke volume returns while resistance is still raised | Overshoots above baseline | Falls (reflex bradycardia) | Loaded baroreceptors; sympathetic withdrawal |
Does the reflex also set the level?
Two dog experiments test whether the reflex moves the curve, from opposite sides.
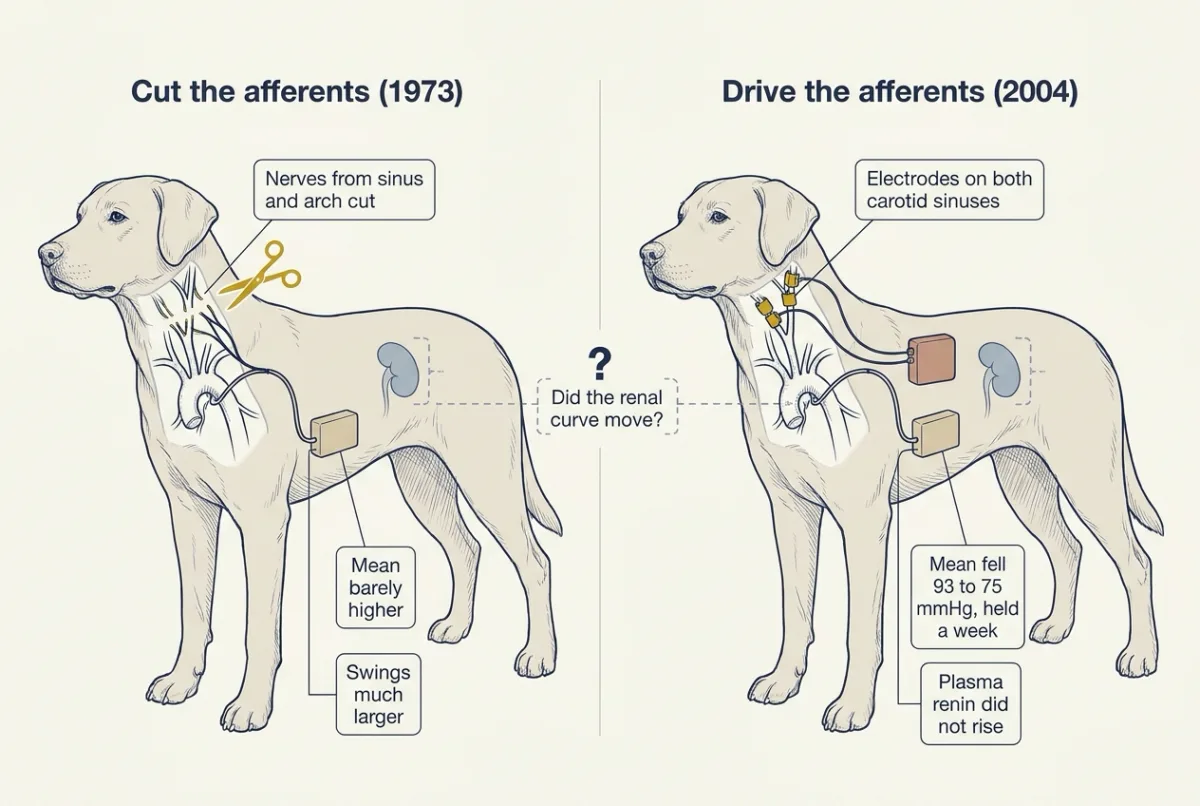
Denervation. Cowley, Liard and Guyton concluded from the opening experiment that the reflex minimizes variations rather than setting the chronic level. Cowley’s 1992 review in Physiological Reviews generalized this: baroreceptors reset and cannot hold a sustained signal, so neural control is limited to correcting rapid changes. The limit: cutting a nerve invites central reorganization, and the transient rise noted in the opening is attributed to that plasticity.
Stimulation. In 2004 Thomas Lohmeier and colleagues ran it the other way round, stimulating both carotid sinuses of conscious dogs through implanted electrodes for seven days. Mean pressure fell from 93 to 75 mmHg on day 1, and the fall held all seven days. Plasma renin activity did not rise despite the lower pressure, which the authors read as sympathetic inhibition of renin secretion. The limit: the electrodes drive the afferent nerve directly, bypassing resetting at the nerve ending, so they show what afferent input can do, not what the intact reflex does.
Reading it through the curve. If salt intake was constant and balance was restored, an 18 mmHg fall held for a week needs the curve about 18 mmHg to the left, at unchanged slope (part C in reverse): some change in how the kidney handles sodium. Whether the 2004 dogs reached balance is not stated here.
The baroreflex is the dominant short-term controller; whether it contributes to the chronic level is open, with dog experiments pointing both ways. Device-based baroreflex activation is now being studied as a treatment for resistant hypertension (Lohmeier and Hall’s 2019 review).
Why some pressures stay high
About 90 to 95 percent of human hypertension is essential: multifactorial, with gene-environment origins (complex traits and GWAS). The working model: in essential hypertension the renal function curve is shifted right, flattened, or both. Guyton and Hall argue that in every form of human and experimental hypertension studied so far the curve sits at higher pressures, though the relation is hard to measure directly in people.
At a fixed intake and in steady balance, a sustained high pressure must sit on a curve that crosses that intake line at a higher pressure. A shifted curve does so at every intake; a flattened one only at intakes above the point it pivots on (part C). That is bookkeeping. A shifted curve tells you where balance lies, not what moved it: the kidney’s own sodium handling, the renal nerves, or hormones. Resistance increases that spare the curve, such as closing an arteriovenous fistula, give only transient rises, which fits the view that a sustained rise needs the curve to move. Kidney transplantation, which attenuates or abolishes genetic salt-sensitive hypertension in rodent strains, points at the organ itself.
Salt sensitivity is continuous rather than two bins. In salt-sensitive people a flatter effective pressure-excretion relation describes the larger pressure response to salt, but its position and its cause vary (Going deeper, “Does salt sensitivity mean salt retention?”).
Design problem: shifted or flattened?
You can fix a person’s or an animal’s sodium intake and wait for balance. Design a test that tells a shifted curve from a flattened one.
One way to do it
- Protocol. Measure the balance pressure at two intakes, say 150 and 250 mEq/day, giving each days to reach balance.
- Shifted. Pressure is higher at both intakes but rises with salt by the normal amount: 110 to 120 mmHg against 100 to 110 in part C’s numbers.
- Flattened. Pressure rises with salt by more than normal: 100 to 120 mmHg. At the lower intake it need not be raised at all.
- Limits. A real curve can be both, and sodium output must be measured rather than assumed.
Going deeper
How steady is resting pressure?
In Guyton’s summary, arterial pressure in an adult at rest rarely strays more than 10 to 15 percent through a day. That describes resting pressure. Activity, stress and sleep move it more than that.
Who found the carotid sinus nerve
The glossopharyngeal branch in step 2 of the arc, now called the carotid sinus nerve, was identified by Heinrich Ewald Hering in work published in the 1920s. The vagus runs through the same part of the neck, so vagal fibres had been the natural suspects.
The sensors
In mice, PIEZO1 and PIEZO2 are together required for baroreception (vagal sensory neurons, mechanotransduction channels). A 2026 mouse study adds cardiac vagal PIEZO2 volume receptors to the compensation for standing; losing them gives orthostatic hypotension in that species.
Gain has a sign
Guyton writes feedback gains as negative numbers, because the correction opposes the disturbance; his textbook example of the baroreflex has a gain of −2. This lesson uses magnitudes, so a gain of 2 here is −2 in his convention.
Why a strong reflex slows the kidney’s return
In a simple linear model of both controllers, the final pressure does not depend on the reflex gain, but the speed of the return does. The reflex resists the fall in pressure that volume loss produces, so the kidney sheds salt more slowly: the return’s time constant scales with 1 + G. If it were 2 days with no reflex, it would be 6 days at a gain of 2 and 12 at a gain of 5. Resetting releases the brake. This is a property of the model, which leaves out the reflex’s own action on the renal nerves, not a measured time course.
What denervated animals did, week by week
In Thrasher’s 2005 telemetry study, dogs after sinoaortic denervation averaged 124 mmHg in the first week against a control of 94, 103 in the second, and values not different from control in weeks 3 to 5. Species differ. Krieger’s group reported chronic increases in rats. In telemetered normotensive Wistar-Kyoto rats the mean rose above sham for several days, with no rise in spontaneously hypertensive rats, while the standard deviation rose in both strains. The clean statement is about lability, not level.
The mirror experiment: unloading one carotid sinus
Thrasher ligated the common carotid artery below the one intact carotid sinus in dogs whose aortic and other carotid sinus nerves had been cut. Pressure rose about 22 mmHg over the week and normalized when flow was restored. In a five-week repeat the rise waned to about 10 mmHg above control.
More on the stimulation study
Control mean pressure was 93 plus or minus 3 mmHg, at 64 plus or minus 4 beats per minute; pressure was about 72 mmHg on day 7. Beyond the electrode limit, the study covers only normotensive dogs over one week, and it does not show that the effect works without the kidney.
Design problem: do the renal nerves carry the fall?
The denervated dogs and the stimulated dogs appear to disagree. You have conscious dogs with arterial telemetry and electrodes around both carotid sinuses. Design the test of whether the sustained fall in pressure during stimulation depends on the renal nerves, then compare your design and prediction with what Lohmeier and colleagues found in 2007.
One way to do it
- Groups. Intact dogs and dogs after bilateral renal denervation, each with sham-operated controls, all with the same electrodes.
- Protocol. Control period, seven days of stimulation, recovery, with continuous 24-hour pressure and heart rate, so transient and sustained effects separate.
- Measures. Fixed sodium and water intake with daily urine collection, so sodium balance is tested rather than assumed (mapping the curve needs further controlled intake or pressure conditions). Plasma renin activity and noradrenaline as indirect indices of renin release and sympathetic outflow; a direct sympathetic measure needs nerve recording or noradrenaline spillover.
- Predictions. If renal denervation abolishes the fall, those nerves carry the chronic effect; if it persists, something else moves the curve, such as other sympathetic beds or circulating hormones.
- Limits. Surgically altered normotensive dogs over one week; renal nerves regrow, so confirm denervation afterwards; the electrodes still bypass the receptor.
In 2007, renal denervation did not abolish the fall.
Does salt sensitivity mean salt retention?
The flatter curve invites the reading that salt-sensitive people keep more of a salt load. One view, the vasodysfunction hypothesis, holds that most salt-sensitive people do not retain more of a salt load than others, and instead fail to lower peripheral (including renal) resistance on a high salt intake (Morris, Schmidlin, Sebastian, Tanaka and Kurtz, Circulation 2016). The competing renal view holds that impaired pressure natriuresis makes them retain more sodium, raising volume and cardiac output (Hall, Circulation 2016). The question is live.
Heritability and Liddle’s genetics
Heritability of essential hypertension is estimated between 35 and 50 percent in most family and twin studies; estimates differ by source. The beta-subunit mutations in Liddle syndrome were shown by Shimkets and colleagues in 1994.
Your notes
Select any text in the lesson to highlight it or add a note to it. Your highlights and notes are saved in this browser and collected in your notebook.
This browser is not letting the site save anything (a private window or strict privacy settings), so highlights and notes will be lost when you leave the page.
How we measure it
Sinoaortic denervation
Section the carotid sinus nerves and the aortic depressor nerves so that arterial stretch no longer reaches the brainstem. Comparing pressure records before and after measures what the afferent input contributes to the mean level and to variability, but nerve section also invites central reorganization, which the method cannot separate out.
Chronic arterial recording and telemetry in conscious animals
An implanted catheter or telemetry transmitter records pressure and heart rate continuously in an unanaesthetized animal for days. It gives a 24-hour mean and a measure of beat-to-beat variability in the same record, which is how the two can be shown to change independently.
Chronic carotid sinus stimulation
Electrodes around both carotid sinuses, driven by an implanted pulse generator, raise afferent baroreceptor traffic without raising pressure. It tests whether afferent input alone is sufficient to move pressure for days, and it bypasses resetting at the nerve ending.
The Valsalva maneuver
A volunteer breathes out against a closed airway or a manometer at a set pressure for a set time while arterial pressure and heart rate are recorded. The four-phase pattern reads out the mechanical effect of raised intrathoracic pressure and the reflex response to it, with no drug given.
Practice questions on this lesson (5) → MCAT-style, original, each with an explanation
Where this lesson fits
Before thisReview first
- Cardiac Output and Venous ReturnThis course · Lesson 7
This lesson uses how falling volume lowers venous return and cardiac output, and how that changes arterial pressure.
- Resistance, Compliance and Local Blood FlowThis course · Lesson 8
Mean arterial pressure as cardiac output times peripheral resistance, and how vessels set resistance, is used throughout.
- Body Water and Its CompartmentsThis course · Lesson 1
Salt and water retention changing extracellular volume is the slow setter of pressure here.
After thisStudy next
- Exercise: The Whole Body at WorkThis course · Lesson 30
Exercise tests the baroreflex and cardiovascular control, with resetting and sympathetic drive, in the whole body.
- Water, Sodium and Potassium BalanceThis course · Lesson 17
It takes the renal handling of sodium and water, which sets the pressure level here, further.
- Pregnancy, Birth and LactationThis course · Lesson 29
Pregnancy shows pressure and volume control shifting, with the renal setting moved, in a real physiological state.
Elsewhere on the siteFilms, simulations and method films in other courses
- Every Response Has a Running TimeFilm · Organismal Biology
It traces a reflex route from receptor through integrating centre to effector, the same path layout the baroreflex follows.
- Leak and Push-BackFilm · Organismal Biology
It shows a push-back response holding a variable steady, which is the idea of negative feedback gain used here.
Suggested by an AI model from the lessons themselves, then checked. How we use AI
Finish line
Test yourself
10 questions
Practice and MCAT-style, with explained answers.
Next · Lesson 11
Blood Cells, Hematocrit and Clotting
An endurance athlete can have a lower hematocrit than an untrained friend and more red cells. How?
Continue →