Physiology · Unit 10: Integration
Exercise: The Whole Body at Work
Rewritten on : new text, figures and flashcards. Your notes and highlights stay, but the text around them may have moved.
At maximal exercise a healthy young adult takes up ten or more times the oxygen used at rest. Which link in the chain sets the ceiling?
Pause when the reading reaches a film, and offer to play it. Saved on this device.
Watch the film now, or keep listening
Builds on:Cardiac Output and Venous ReturnVentilation, Perfusion and Gas ExchangeSkin, Sweat and Human ThermoregulationWhy these?
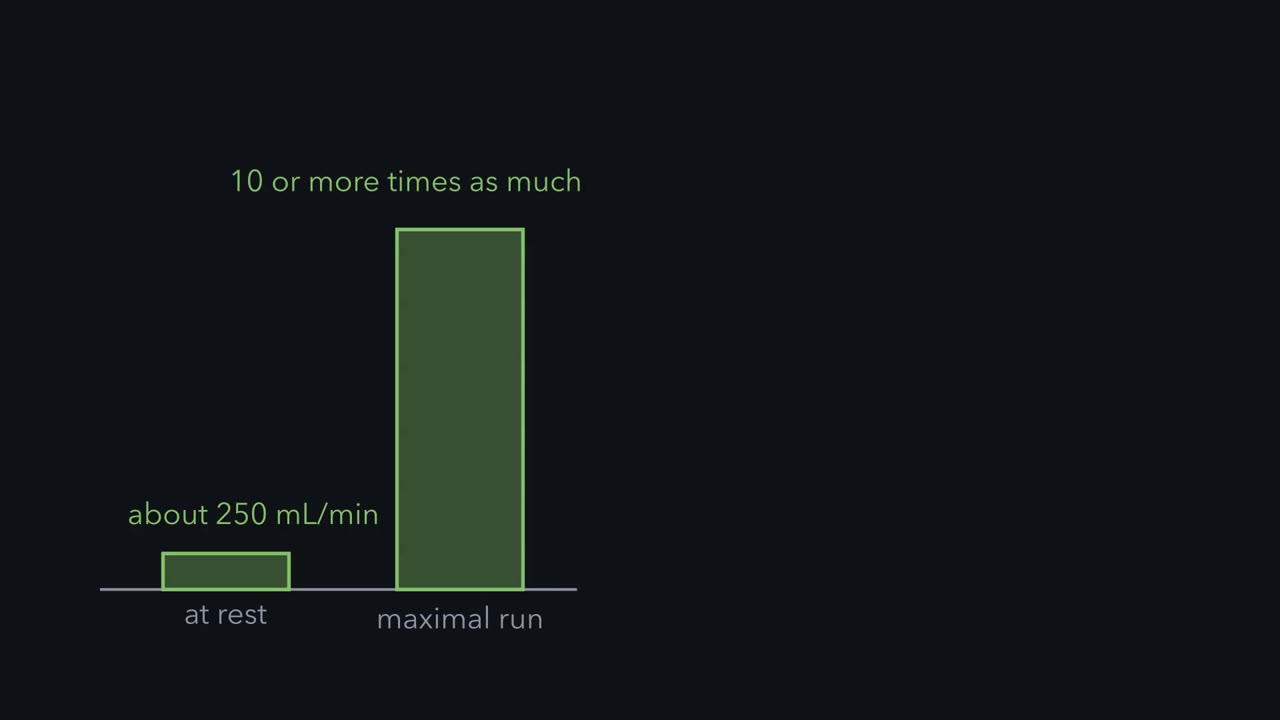 ▶ Watch Oxygen Uptake Is Flow Times Extraction · 2:50
Read the transcript of “Oxygen Uptake Is Flow Times Extraction”
Film transcript: Oxygen Uptake Is Flow Times Extraction
Take a healthy young man of about 70 kilograms. At rest, he takes up about 250 millilitres of oxygen per minute. At the end of a maximal run, he may take up ten or more times as much. That oxygen passes through the lungs, the heart, the blood and the capillaries before a mitochondrion uses it. Which link sets the ceiling? Fick's principle splits the rise into two factors. Oxygen uptake equals cardiac output times the oxygen extracted from each litre of blood. That extraction is arterial oxygen content minus mixed venous oxygen content, in millilitres of oxygen per litre of blood. Take illustrative numbers at rest: cardiac output is five litres per minute, and extraction is 50 millilitres per litre.
Five times 50 gives 250 millilitres per minute. Now the same man at maximal exercise, with illustrative numbers. Heart rate is 195 beats per minute, and stroke volume is 100 millilitres per beat. Cardiac output reaches 19.5 litres per minute, a rise of 3.9 times. Extraction rises to 160 millilitres per litre, a rise of 3.2 times. Together they make oxygen uptake 12.5 times its resting value. Which factor sets the ceiling? Andersen and Saltin had five healthy subjects kick one leg, so the active muscle was essentially one quadriceps. Flow to that leg rose with workload to an average of 5.7 litres per minute. They estimated maximal perfusion at about two and a half litres per kilogram of active muscle per minute.
This did not test whole body exercise. Suppose, with made up values, that running uses 20 kilograms of muscle. Eighty percent of the heart's 19.5 litres per minute reaches it. If the one leg rate applies to all of that muscle, it could accept 50 litres per minute. The heart sends 15.6. Muscle could accept three times what the heart delivers, so in this example the heart sets the ceiling. In healthy people doing whole body exercise at sea level, the evidence points to oxygen delivery, mainly cardiac output. One training study's authors report that returning red cell volume to baseline brought peak oxygen uptake back to its pretraining level. But removing blood also lowers blood volume and preload, so it cannot separate oxygen-carrying capacity from volume.
A later study found the gain preserved, so the result is not settled. Oxygen uptake is flow times extraction, and in whole body exercise at sea level the evidence points mainly to flow.
At rest, a healthy young man of about 70 kg takes up about 250 mL of oxygen per minute. At the end of a maximal run he may take up ten or more times as much. That oxygen passes through lungs, heart, blood and capillaries before a mitochondrion uses it. Which link sets the ceiling?
The one idea to carry through this lesson. Oxygen uptake is flow times extraction: VO2 = cardiac output x (CaO2 - CvO2), the oxygen in each litre of arterial blood minus what is left when it comes back. At maximal whole-body exercise, the extraction fraction is already close to its limit (about 80 percent of each litre’s oxygen, against 25 percent at rest), so a higher ceiling needs more oxygen delivered: more flow, or more oxygen in each litre. In healthy people at sea level, the evidence points to delivery, mainly cardiac output, as the main limit, because working muscle could accept far more blood than the heart can send it. Most of the circulatory and respiratory responses in this lesson either change one of the two factors or compete for the flow.
The rule is for healthy adults, untrained to moderately trained, running or cycling at sea level. This lesson shows how we know, and where it bends.
Oxygen uptake is flow times extraction
Oxygen uptake (VO2) is the oxygen the whole body takes up per minute. In an incremental test the work rate on a treadmill or cycle ergometer rises in steps, and expired-gas analysis of air breathed through a mouthpiece gives VO2 as oxygen breathed in minus oxygen breathed out. VO2 climbs with the work rate until further increases no longer raise it. That ceiling is the maximal oxygen uptake (VO2max); without a clear plateau, laboratories report peak VO2. Keep absolute VO2 (L per min) apart from mass-specific VO2 (mL per kg of body mass per min), which compares people of different sizes.
Picture one litre of blood. At rest it leaves the lungs carrying about 200 mL of oxygen and comes back carrying about 150: the tissues kept 50 mL. The body’s uptake is litres pumped per minute times what each litre gave up. This is Fick’s principle, which cardiac output and venous return used to measure flow.
In words Oxygen uptake equals the litres of blood the heart pumps each minute, times the oxygen each litre gives up on its way round.
- VO2“V O two”
- whole-body oxygen uptakemL/min
- cardiac output“cardiac output”
- blood pumped by the heart each minuteL/min
- CaO2“C a O two”
- oxygen content of arterial blood, bound plus dissolvedmL O2 per L blood
- CvO2“C v O two”
- oxygen content of mixed-venous blood: pulmonary-artery blood, where returns from every organ have mixedmL O2 per L blood
- CaO2 − CvO2“the arteriovenous difference”
- the oxygen each litre gives up; divided by CaO2 it is the extraction fractionmL O2 per L blood
Sanity check If the tissues took no oxygen, CvO2 would equal CaO2 and uptake would be zero however fast the heart pumped. No litre can give up more than all its oxygen, so the difference can never exceed CaO2.
Try one number
At rest: cardiac output 5.0 L/min, CaO2 200 mL/L, CvO2 150 mL/L.
Difference: 200 − 150 = 50 mL/L.
Uptake: 5.0 L/min × 50 mL/L = 250 mL/min. Litres cancel, leaving mL of oxygen per minute.
Need a refresher? rates and “per” · units and prefixes
These are contents, read from the curve in oxygen transport, not partial pressures. Why mixed-venous blood? Each organ extracts a different share: femoral venous blood drains one hard-working leg, which extracts more than the body as a whole, so times leg flow it gives the leg’s uptake, not the body’s.
Here, as in the film, “extraction” means this mL-per-L difference.
Predict. From rest to maximal exercise, which factor do you expect to rise more, flow or extraction? And how much room does the extraction fraction have left at the top?
Check your prediction
Flow rises a little more (step 5 below). The bigger point is the room left (step 6): the extraction fraction cannot pass 100 percent, and in practice stays well below it, because tissues that are not working extract less.
Worked problem: splitting the rise with Fick
Numbers are illustrative, except the resting uptake of about 250 mL per min for a healthy 70-kg young man (Joyner and Casey, 2015). Assume steady state and no shunt.
- Rest. 5.0 L per min x 50 mL per L = 250 mL per min, as on the card.
- Maximal exercise, cardiac output. Heart rate 195 beats per min and stroke volume 100 mL per beat give 195 x 100 = 19,500 mL per min, or 19.5 L per min.
- Maximal exercise, the oxygen each litre gives up. CaO2 200 mL per L and CvO2 40 mL per L give a difference of 160 mL per L, so VO2max = 19.5 x 160 = 3,120 mL per min, 3.12 L per min. (Going deeper checks the 200 from hemoglobin.)
- Per kilogram. 3,120 / 70 = 44.6 mL per kg per min.
- The split. Fold changes multiply; they do not add. VO2 rose 3,120 / 250 = 12.5-fold: a 3.9-fold rise in cardiac output (19.5 / 5.0) times a 3.2-fold rise in the oxygen each litre gives up (160 / 50). Check: 3.9 x 3.2 = 12.48.
- The room left. The extraction fraction went from 50 / 200 = 25 percent to 160 / 200 = 80 percent. Even if every litre gave up all 200 mL, uptake at this cardiac output could reach only 19.5 x 200 = 3,900 mL per min, a quarter more. Extraction can add at most that quarter, so any larger rise has to come mostly from delivery.
The split describes the change; it does not give each factor an independent share, because the factors are linked: more flow through a capillary means less time for each litre to unload.
- Cardiac output
- 19.5 L per min
- Arterial content, CaO₂
- 200 mL per L
- Mixed-venous content, CvO₂
- 40 mL per L
- Oxygen extracted per litre
- 160 mL per L
- VO₂
- 3.12 L per min
- VO₂ for 70 kg
- 44.6 mL per kg per min
In this sketch: steady state, no shunt, a 70-kg person. Arterial content = 1.34 × hemoglobin × 10 × 0.97 mL per L (1.34 mL per g is a common value, and published values run from about 1.34 to 1.39; 97 percent saturated; dissolved oxygen is ignored, which the lesson puts at about 3 mL per L at a PO₂ of 100 mmHg). Mixed-venous content = arterial content × (1 − extraction). Hemoglobin 15.4 g per dL is chosen in this sketch so that CaO₂ is about 200 mL per L, the lesson’s value; the lesson’s own check uses 150 g per L, which gives 195 mL per L. The resting marker, about 250 mL per min, is the lesson’s value for a healthy 70-kg young man; the lesson’s other numbers are illustrative. The lesson gives a resting cardiac output of 5.0 L per min but not its split, so the resting button uses 60 beats per min × 83 mL, made up for this sketch. The two submaximal buttons use the lesson’s heart-failure numbers (cardiac output 7 L per min against 10 L per min for the control, the same uptake of about 1.0 L per min); their heart-rate and stroke-volume split (125 beats per min × 56 or 80 mL) is made up for this sketch, and whole-number extraction gives 142 rather than the lesson’s 143 mL per L. Slider ranges are made up too, and the sketch does not say which combinations people reach.
VO₂ = heart rate × stroke volume × CaO₂ × extraction fraction. A product has the same value for many mixtures of factors, and it falls if any one factor is lowered while the others are held. Here the sliders move independently; in the body they are linked, because faster flow leaves each litre less time to unload, so more flow buys less than its full share of extra uptake.
Where the extra flow goes
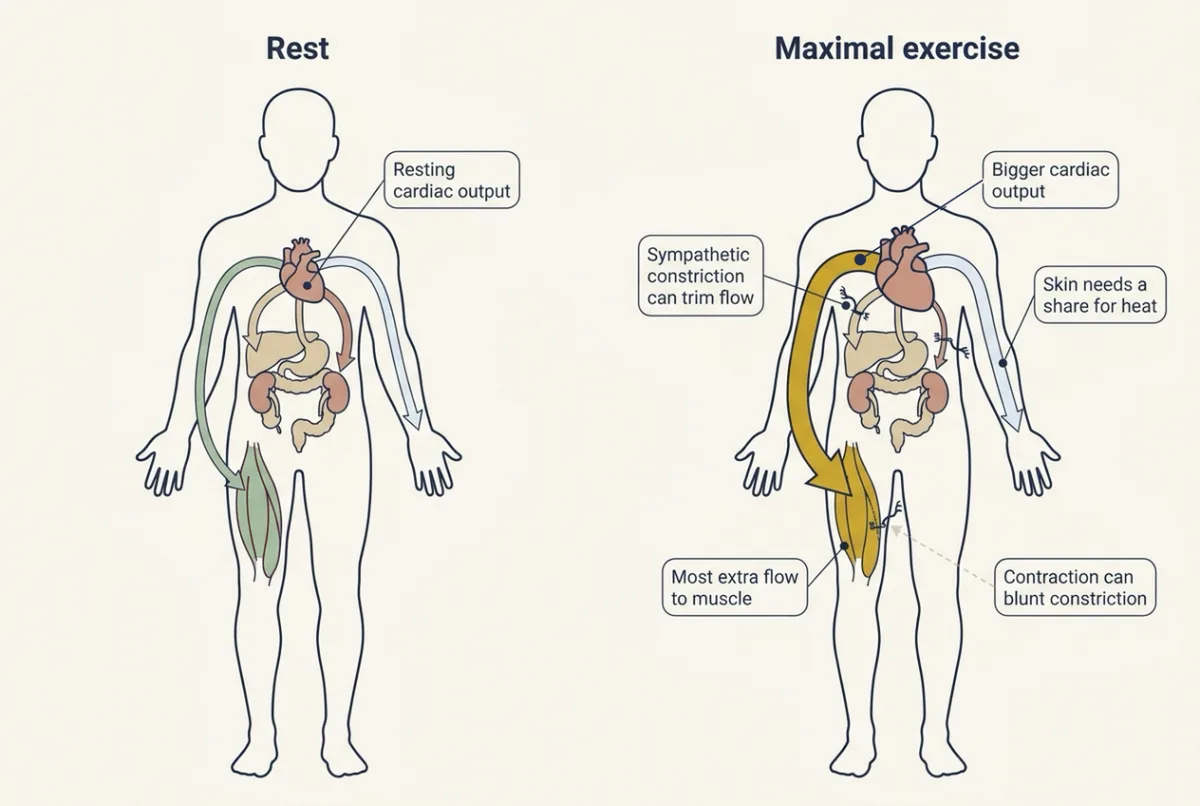
Cardiac output rises through heart rate and stroke volume. Stroke volume rises with preload, the end-diastolic stretch of the ventricle, and contractility, the strength of contraction at a given stretch (pressure-volume loops). Sympathetic outflow rises (hypothalamus and autonomic control), and the baroreflex operates around a higher pressure (regulating arterial pressure).
Most of the extra flow to muscle comes from that larger cardiac output, not from the gut and kidneys, but where the flow goes still matters. In heavy exercise, sympathetic vasoconstriction can reduce renal and splanchnic (gut, liver and spleen) blood flow. The same nerves reach active muscle, but contraction can blunt their constricting effect there, which is called functional sympatholysis. Active muscle also dilates through local signals (exercise hyperemia), and a 2015 review concluded that no single vasodilator explains it (resistance, compliance and local flow).
Picture a water system at peak demand. The pumps run much harder and the district on fire opens its hydrants, but only part way, and the operators close a few suburban valves: open every hydrant and the pressure in the mains would collapse.
How much could muscle take?
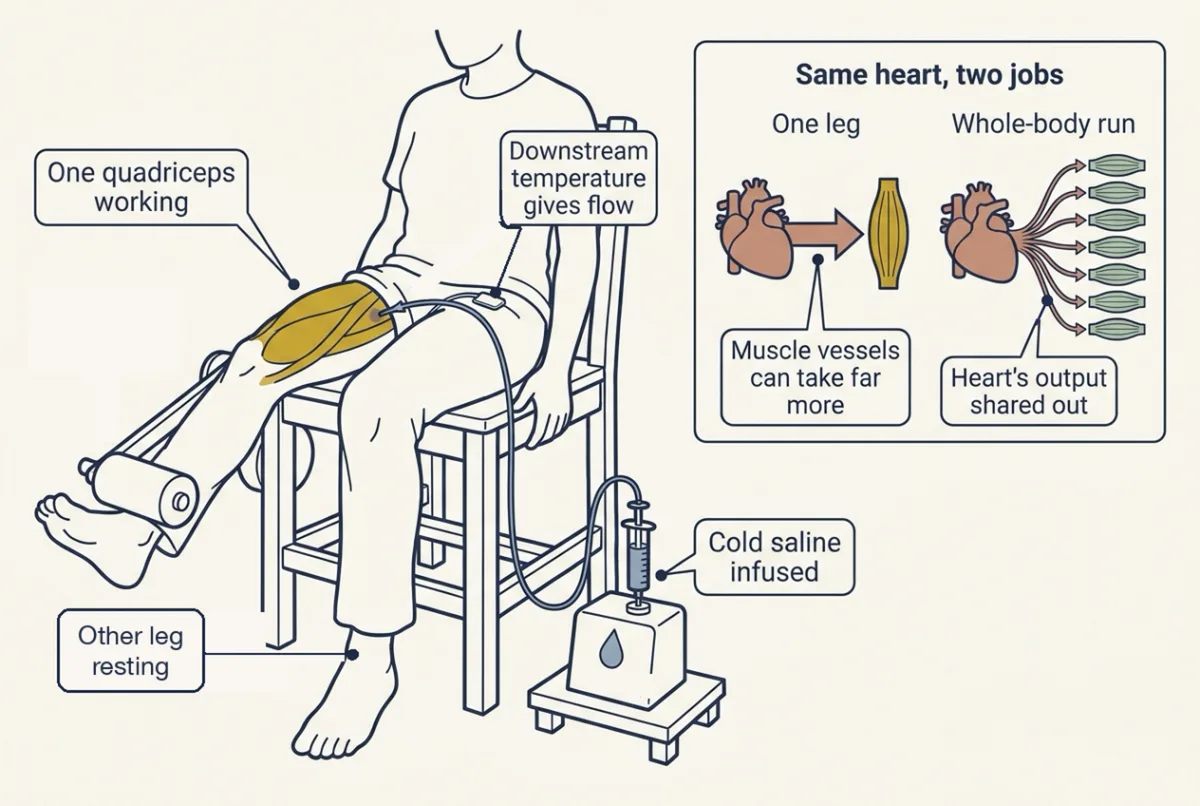
If the heart were not the limit, how much flow could muscle take? Per Andersen and Bengt Saltin (1985, Journal of Physiology 366:233) found out by making the working muscle small. Five healthy subjects did dynamic knee extension with one leg at 10 to 60 W, so the active muscle was essentially one quadriceps. Femoral venous flow was measured by cold-saline thermodilution: cold saline infused into the vein cools the blood less the faster it flows.
Predict. A muscle this small cannot strain the heart. If muscle vessels set the whole-body ceiling, how should its flow per kilogram compare with what each kilogram gets in whole-body exercise? What if the heart sets it?
Check your prediction
If the vessels set the ceiling, the small muscle should reach no more flow per kilogram than in whole-body exercise, since its vessels are already at their limit there. If the heart sets it, the small muscle, freed from sharing the heart, should take far more.
Femoral flow rose with workload to an average of 5.7 L per min, and the estimated maximal perfusion was about 2.5 L per kg of active muscle per min (per kilogram of quadriceps, not of body mass). That argued against muscle dilator capacity as the ceiling in these subjects. It did not test whole-body exercise or the dilator mechanism, and the per-kilogram figure depends on the estimated quadriceps mass.
Worked problem, part 2: the argument in numbers
Except for the 2.5 L per kg per min, values are made up. Suppose running uses 20 kg of muscle and 80 percent of part 1’s 19.5 L per min maximal cardiac output reaches it.
- Capacity. At 2.5 L per kg per min the muscles could accept 2.5 x 20 = 50 L per min.
- Delivery. The heart sends 0.80 x 19.5 = 15.6 L per min.
- Ratio. 50 / 15.6 = 3.2 (check: 15.6 x 3.2 = 49.9). Muscle could accept about three times what the heart delivers.
Why, then, are its vessels not wide open? Flow equals pressure times conductance (the ease of flow, the inverse of resistance). If every working muscle opened its vessels fully while cardiac output stayed at its maximum, arterial pressure would collapse. A leading explanation is that sympathetic nerves and the baroreflex keep working muscle partly constricted to hold arterial pressure up; how much each contributes is still debated.
The calculation assumes the one-leg maximum applies to every working muscle, the active mass is known and arterial pressure matches that of the one-leg test, where it rose from about 100 to 130 mmHg at the higher workloads.
Read the result carefully. Muscle could take more blood, so its vessels are not the ceiling; the heart is the main limit here. Whether muscle could also use more oxygen is a separate question, which the training experiments in the next section test. Nor does three times the flow mean three times the uptake: faster blood has less time to unload.
The film’s fifth scene, which says that here the heart sets the ceiling, shows only the flow half of this argument.
Why the evidence points to delivery
Recall the guiding idea: each litre already gives up 160 of its 200 mL at maximum, so a higher VO2max needs more oxygen to arrive. Two kinds of human experiment test whether arrival really sets the ceiling.
When the heart has nothing more to give. Mortensen and colleagues (2008) measured cardiac output and leg blood flow in 13 trained men cycling to exhaustion at a supramaximal work rate, one above the rate that brought out their VO2max. Both peaked after about 60 to 90 seconds and then levelled off, while the work rate stayed the same, although the one-leg experiment suggests the legs could take more flow. The authors read the plateau as cardiac limits plus muscle vasoconstriction, the constriction that holds arterial pressure up.
Take the gain away. Training raises peak VO2, but it changes both ends of the chain: more red cells and blood volume on the delivery side, more mitochondria and capillaries on the muscle side. Which change made the gain? Montero, Lundby and colleagues (2015) trained 16 previously untrained healthy men for six weeks, then removed blood (phlebotomy) until each man’s red-cell volume was back at its pretraining value. The experiment assumes the muscle adaptations did not disappear in the days between.
Predict. If the gain came from the muscle, what should peak VO2 do after the blood is removed? What if it came from delivery?
Check your prediction
If the muscle made the gain, the new mitochondria and capillaries are still there, so most of the gain should survive. If delivery made the gain, taking away the extra red cells should erase it.
After six weeks (mean plus or minus standard deviation), peak VO2 had risen 9 plus or minus 8 percent, mitochondrial volume density in muscle biopsies 43 plus or minus 30 percent and capillaries per fibre 18 plus or minus 16 percent. The muscle’s oxidative machinery grew far more than peak VO2 did. Yet when red-cell volume was returned to baseline by phlebotomy, the authors report that peak VO2 fell back to its pretraining level. In these men, the gain rode on delivery.
Two cautions keep this from being the last word. First, removing blood lowers blood volume, and with it preload and stroke volume, as well as oxygen-carrying capacity (blood cells and hemostasis covers red-cell mass). Both are delivery, but the experiment cannot say which of the two mattered. Second, a later 10-week training study (Skattebo and colleagues, 2020) found that the gain survived phlebotomy, so the result is not settled. It is one strong result, not a law.
Delivery means cardiac output times CaO2. The film speaks of flow; removing red cells also works on CaO2.
Where the rule holds. Healthy people, whole-body exercise, sea level. Even there, more flow buys less than its full share of extra uptake, because faster blood has less time to unload; in a simple model more hemoglobin does too, though measured VO2max rises close to in proportion with arterial oxygen content in some experiments. The rule does not carry over to small-muscle exercise, where the heart has reserve and the limit lies elsewhere; to some highly trained runners whose arterial oxygen falls; or to heart failure, where changes in the muscle add a limit of their own. At altitude and in anemia delivery still limits, mainly through a lower CaO2.
Breathing protects the oxygen in each litre
In Fick terms, the lung’s job is to keep CaO2 up. Ventilation rises at once at exercise onset. At low to moderate intensity it keeps pace with carbon dioxide output, and arterial PO2 and PCO2 stay near their resting values of about 100 and 40 mmHg at sea level. So you breathe much harder without hyperventilation, which means ventilation rising faster than carbon dioxide output. That can happen in heavy exercise, and then arterial PCO2 falls. The control is in control of breathing.
The healthy lung usually keeps arterial oxygen up even at maximal work. The exception is a finding in some highly trained runners, not in healthy people generally: of 16 sampled at sea level by Jerome Dempsey and colleagues (1984), in eight arterial PO2 fell during exercise. There the lung joins the limit through CaO2.
At maximal exercise the breathing muscles work hard too, and they draw on the same cardiac output as the legs. Whether they take flow from the legs is the design problem at the end of this lesson.
Heat competes for the flow
Early in exercise, heat production can outrun heat loss and core temperature rises. Skin blood flow carries heat from the core to the skin, where sweat cools only when it evaporates (skin, sweat and human thermoregulation), so the skin too needs a share of the cardiac output.
Predict. On a hot day, a cyclist rides at the same work rate as on a cool day, and also loses body water as sweat. What happens to stroke volume? What would heart rate have to do to hold cardiac output?
Check your prediction
Stroke volume falls, so heart rate would have to rise to hold cardiac output. In 15 endurance-trained cyclists (González-Alonso and colleagues, 1997), hyperthermia alone or about 4 percent dehydration alone lowered stroke volume by 7 to 8 percent, and the two together lowered cardiac output by 13 percent: heart rate did not make up the whole loss. Less flow, shared with the skin, means less delivery to muscle.
What the ceiling is for: fuel, lactate and the fraction you can hold
No one races for long at the ceiling. Endurance performance rests on three things: VO2max, the fraction of it a person can sustain, and economy, the oxygen cost of moving at a given speed (Joyner and Coyle, 2008, review). The fraction that can be sustained is related to the lactate threshold.
Lactate is a fuel, not waste. Some glycolytic pyruvate becomes lactate, which leaves the fibres that make it and is oxidized by other fibres and the heart or made into glucose by the liver.
Blood lactate is set by appearance minus clearance. As work rises, appearance keeps rising. In trained men in one study (Messonnier and colleagues, 2013), clearance reached its peak below the threshold, which fits blood lactate climbing faster above it, though the study does not prove that plateau causes the bend. The lactate threshold is the workload above which blood lactate accumulation speeds up as work rises. It is not where oxygen runs out; muscle keeps consuming oxygen above it. It has no universal value (not a fixed 4 mmol per L, percentage of VO2max or ventilatory threshold).
Which fuel muscle burns depends on intensity (energy systems are in skeletal muscle mechanics). In trained subjects studied with stable-isotope tracers and indirect calorimetry, plasma glucose uptake and muscle glycogen oxidation rose with intensity, and total fat oxidation was highest at a middle intensity (Romijn and colleagues, 1993). During prolonged exercise plasma insulin falls and glucagon rises, favouring glucose release from the liver (insulin, glucagon and blood glucose), while contracting muscle takes up more glucose by a route that does not require insulin (integration of metabolism).
What training changes
For endurance training, the phlebotomy result above points to delivery. Strength training works differently. In six weeks of leg extension, heavy and light loads raised muscle thickness similarly, but strength and voluntary activation, how fully the nervous system drives the muscle in a maximal effort (motor units and reflexes), were greater with the heavy load, which suggests a neural contribution. And people classed as non-responders to one dose of endurance training, by the study’s definition, no longer met that definition after a higher dose (Going deeper also has a molecular map of training in rats).
Heart failure: the Fick split as a diagnostic
In heart failure with reduced ejection fraction, peak stroke volume is low and rises little (weak contractility) and peak heart rate is often lower than in a healthy person of the same age, so peak cardiac output is low.
Predict. At the same submaximal work rate, a patient and a control both take up 1.0 L of oxygen per min, with CaO2 200 mL per L. Cardiac output is 7 L per min in the patient, 10 in the control. Predict each one’s arteriovenous difference and mixed-venous content, and whose lactate is higher.
Check your prediction
The difference is uptake divided by flow: 1,000 / 7 = 143 mL per L for the patient against 1,000 / 10 = 100 for the control. Mixed-venous content is 200 - 143 = 57 mL per L against 100. Each litre of the patient’s smaller flow must give up more oxygen. Lactate is higher in the patient: muscle underperfused for its demand accumulates lactate at a lower absolute work rate.
Low peak cardiac output is a main reason peak VO2 is low, but oxygen transport from blood into muscle is also reduced (Esposito and colleagues, 2010), partly because higher sympathetic outflow constricts muscle vessels more. Chronic heart failure also changes muscle (lower mitochondrial volume and enzymes, in some studies fewer capillaries per fibre, and a shift in fibre type), which contributes a peripheral limit, and ventilation per litre of carbon dioxide output is higher. Here the guiding rule bends: flow is the first problem, but the muscle adds a limit of its own.
Design problem
At maximal cycling a trained athlete’s breathing muscles work hard. Does that work take blood flow from the legs? Design an experiment in trained male cyclists and say what each result would mean.
Saved in this browser only.
One way to do it
Hold the cycling power constant at or near maximum and change the work of breathing: on separate visits, in random order, unload inspiration with a ventilator that assists each breath, add an inspiratory resistance, or use a sham setting.
Measure esophageal pressure (to quantify the work of breathing and the swing in chest pressure), femoral venous flow by thermodilution, cardiac output and arterial pressure (leg vascular conductance = flow / pressure), leg and whole-body VO2, arterial blood gases (to exclude a change in arterial gases), and leg noradrenaline spillover as a marker of sympathetic outflow.
If breathing competes for flow, unloading should raise leg flow and conductance and loading should lower them. Measure cardiac output too, because changing the work of breathing can change total cardiac output as well as where it goes. If cardiac output rose to supply both, leg flow would not change.
Harms and colleagues in Dempsey’s laboratory (Journal of Applied Physiology 82:1573, 1997) ran a version of this in seven trained male cyclists, measuring leg flow but not cardiac output. Reducing inspiratory work during maximal cycling increased leg blood flow, and a change of about 50 percent in respiratory work went with a change of about 2 L per min in leg flow in the opposite direction. A 1998 follow-up in eight cyclists measured cardiac output and found it about 9 percent lower with unloading, so unloading did not simply move a fixed cardiac output to the legs; the authors estimated that up to 14 to 16 percent of cardiac output goes to the breathing muscles at maximal exercise. In Harms and colleagues’ data, leg vascular resistance tracked norepinephrine spillover, which fits a proposed reflex from the working respiratory muscles that raises sympathetic outflow to the legs. Seven trained men at maximal exercise say nothing about moderate exercise or women.
Going deeper
Where VO2max came from, and how the maximum is read
Hill and Lupton (Quarterly Journal of Medicine, 1923) described the ceiling of oxygen uptake in runners. Breath-by-breath values are averaged before the maximum is read, and a 2020 review found that the averaging strategy alone can shift the reported maximum by 4 to 10 percent.
Checking CaO2
Hemoglobin 150 g per L, 97 percent saturated, binding 1.34 mL of oxygen per gram (a common value; published values run from about 1.34 to 1.39): 1.34 x 150 x 0.97 = 195 mL per L. Dissolved oxygen at a PO2 of 100 mmHg adds 0.03 mL per L per mmHg x 100 = 3 mL per L. Total 198 mL per L, close to the 200 used in the worked problem.
How much does more flow buy?
In a simple model of capillary unloading (oxygen diffuses out along the capillary toward a mitochondrial PO2 near zero, with the normal oxygen-hemoglobin curve) set up with this lesson’s numbers (80 percent of the 19.5 L per min reaching muscle, muscle extraction fraction 90 percent), 10 percent more flow or 10 percent more hemoglobin raised muscle uptake by about 5 to 6 percent, and 10 percent more muscle diffusing capacity by about 3.5 to 4 percent, figures that depend on model details. Tripling muscle flow raised it only about 1.6-fold. The split shifts with the assumptions: at an 85 percent extraction fraction the two sides came out nearly equal, and a simpler exponential model gives delivery more leverage. These are model outputs, not measurements. What holds across them: extra delivery buys less than its full share, once extraction is high delivery has more leverage than the muscle side, and at lower extraction the muscle side gains weight, the better picture for heart failure and small-muscle exercise.
The phlebotomy studies
Montero, Lundby and colleagues (2015) also measured peak cardiac output and blood volumes. Their result does not show that mitochondria never limit VO2, or anything about women, older adults or athletes. The study that disagrees (Skattebo and colleagues, 2020) followed 12 untrained adults, seven of them men, for 10 weeks.
Arterial oxygen in trained runners
Dempsey, Hanson and Henderson (1984) sampled arterial blood during treadmill exercise in 16 highly trained runners. In eight of them, arterial PO2 fell during exercise by 21 to 35 mmHg. The worst falls went with a wide alveolar-arterial oxygen difference and, in some runners, too little hyperventilation. The authors judged uneven ventilation-perfusion and shunt unlikely and proposed, by exclusion, a diffusion limit from very short red-cell transit times in the lung capillaries; the cause is still debated (ventilation and perfusion explains the A-a difference).
Fuel and lactate tracer studies
Romijn and colleagues (1993) studied five trained subjects at 25, 65 and 85 percent of VO2max; total fat oxidation was highest at 65 percent. Messonnier and colleagues (2013) used tracers in six trained and six untrained men, and a lactate clamp, an infusion of lactate that holds its blood concentration, in the trained men only. At each group’s own threshold, lactate clearance was 34 percent higher in the trained men. In a study of six trained and six untrained men, Emhoff and colleagues (2013) estimated with tracers that blood lactate supplied about one-third of carbohydrate-derived energy during 60 minutes of exercise at the lactate threshold. Both studies compared trained with untrained men, so the differences are associations.
Strength, non-response and a molecular map
Jenkins and colleagues (2017) randomized 26 young men to six weeks of leg extension at 80 or 30 percent of their one-repetition maximum, and measured muscle thickness by ultrasound. Montero and Lundby (2017) found that two extra weekly sessions removed non-response as they defined it (a change in maximal power within the measurement error of plus or minus 3.96 percent). In rats, the MoTrPAC consortium (2024) mapped molecular training responses in blood and 18 solid tissues, with sex differences in many: associations, not causes.
Your notes
Select any text in the lesson to highlight it or add a note to it. Your highlights and notes are saved in this browser and collected in your notebook.
This browser is not letting the site save anything (a private window or strict privacy settings), so highlights and notes will be lost when you leave the page.
How we measure it
Expired-gas analysis in an incremental test
The subject breathes through a mouthpiece while the work rate on a treadmill or cycle ergometer rises in steps, and analyzers measure the volume of expired air and its oxygen and carbon dioxide fractions. Oxygen inspired minus oxygen expired gives VO2; how the noisy breath-by-breath values are averaged changes the maximum reported.
Cold-saline thermodilution
Infuse cold saline at a known rate into a vein, here the femoral vein, and record the temperature of the blood downstream. The more blood flows past, the less the saline cools it, so the temperature change gives the flow through that vein.
Muscle biopsy with morphometry
Take a small sample of muscle with a needle, section it and measure the fraction of fibre volume occupied by mitochondria and the number of capillaries per fibre. Repeated before and after training, it shows how much the muscle's oxidative machinery changed.
Stable-isotope tracers with indirect calorimetry
Infuse a labelled form of glucose, fatty acid or lactate and measure how fast it appears and disappears from blood, while oxygen uptake and carbon dioxide output estimate total fat and carbohydrate oxidation. If fuel taken up from blood is assumed to be oxidized, the difference between the two estimates how much fuel came from stores inside the muscle.
Practice questions on this lesson (3) → MCAT-style, original, each with an explanation
Where this lesson fits
Before thisReview first
- Cardiac Output and Venous ReturnThis course · Lesson 7
It introduces the Fick principle and what sets cardiac output, which this lesson splits into flow and extraction.
- Ventilation, Perfusion and Gas ExchangeThis course · Lesson 13
You need alveolar gas and the A-a difference from there to see how the lung keeps arterial oxygen up.
- Skin, Sweat and Human ThermoregulationThis course · Lesson 26
Sweat, skin blood flow and heat loss from there explain how heat competes with muscle for flow.
Elsewhere on the siteFilms, simulations and method films in other courses
- Oxygen content and the Fick principleSimulation · Organismal Biology
Oxygen content of blood and the Fick principle are worked through there, giving the extraction term used here.
- Why Blood Needs an S-Shaped CarrierFilm · Organismal Biology
It shows how hemoglobin lifts blood oxygen content, the CaO2 you check in this lesson.
- Where the Balance SitsFilm · Organismal Biology
It shows how heat made, gained and lost balance, which explains the heat cost of running.
- Spending ATP, Rebuilding ATPFilm · Biology
It shows how cells rebuild ATP for work, the muscle demand that drives oxygen uptake.
Suggested by an AI model from the lessons themselves, then checked. How we use AI
Finish line
Test yourself
8 questions
Practice and MCAT-style, with explained answers.
That's the last lesson · Next course
Cell Signaling
How a cell hears a message and decides what to do next.
Start the next course →Before you move on: review the questions you missed , or go back to all lessons in this course.