Physiology · Unit 3: The heart and circulation
Resistance, Compliance and Local Blood Flow
Rewritten on : new text, figures and flashcards. Your notes and highlights stay, but the text around them may have moved.
In the muscle of an anesthetized cat, only about 15 percent of arterial pressure is spent crossing the capillary bed. So where does the rest go?
Pause when the reading reaches a film, and offer to play it. Saved on this device.
Watch the film now, or keep listening
Builds on:Cardiac Output and Venous ReturnThe Cardiac Cycle and Pressure-Volume LoopsSmooth Muscle and the Myogenic ResponseWhy these?
In the skeletal muscle of an anesthetized cat, only about 15 percent of arterial pressure is spent crossing the capillary bed, although capillaries are its narrowest vessels and a narrow tube resists flow steeply.
So where does the rest of the pressure go? The vessels that use up the pressure turn out to be the same vessels that decide how much blood each tissue gets.
The one rule needed comes from blood and vessels: blood flows from high pressure to low, and the flow through any stretch of vessel equals the pressure drop across it divided by its resistance, Q = ΔP / R.
The one idea to carry through this lesson. The heart and the blood-pressure reflexes hold mean arterial pressure (MAP, the average arterial pressure over a beat) nearly steady. Each tissue then sets its own blood flow by setting the resistance of its own arterioles: flow to a tissue = (MAP − Pra) / that tissue’s resistance, where Pra, right atrial pressure, is the low pressure the blood returns to.
- End to end, along one tissue’s vessels, the pressure falls most where the resistance is largest, and in skeletal muscle and the heart that is the arterioles.
- Side by side, across tissues, every tissue sees nearly the same driving pressure, so a tissue that relaxes its arterioles takes more flow.
The rule is about mean pressure and mean flow at steady state. It leaves out the beat-by-beat pulse, which is the last section of the lesson. It assumes the pressure is defended; the parallel section shows what happens when it is not. And in skin, nerves rather than the tissue itself turn the tap (four circulations, below).
Where the pressure goes
Follow blood through one muscle. It passes a small artery, then an arteriole, then one of many capillaries, then a venule, then a vein. These segments lie in series, end to end, and two things follow.
- The same flow passes every segment. What enters the artery each minute leaves the vein each minute; the little that filters out of capillaries is a tiny fraction of it.
- Resistances in series add: R = R1 + R2 + R3 …
Rearrange Q = ΔP / R for one segment: ΔP = Q × R. The flow is the same in every segment, so each segment’s pressure drop is proportional to its resistance. A segment’s share of the pressure drop equals its share of the resistance.
Predict. Capillaries are the narrowest vessels in the bed, and resistance climbs steeply as a tube narrows. Where would you expect most of the pressure to be lost?
Check your prediction
Most people guess the capillaries, and the measurement says no. Fronek and Zweifach (1975) slid glass micropipettes into single microvessels of the tenuissimus, a thin thigh muscle, in cats under pentobarbital anesthesia, and recorded the pressure in each. Arterioles 35 to 20 micrometres across were the principal source of resistance setting the pressure downstream. The capillary bed proper took only about 15 percent of arterial pressure, and the smallest venules (8 to 15 micrometres) still averaged about 24 mmHg.
Why not the capillaries? One capillary can resist far more than one arteriole, but each is short and so many lie side by side that the blood has thousands of narrow paths at once, and side-by-side paths lower resistance (next section). So the capillary level as a whole resists less than the arterioles upstream. That is a measured fact about muscle, not a law (Going deeper, “Why capillaries lose in muscle”). In the heart, too, small arteries and arterioles hold most resistance. The brain may differ: the authors of a 2021 mouse study state that its capillary bed has the highest resistance in the cerebral tree.
Arterioles are also where resistance can change. Their walls are rings of smooth muscle, and by Poiseuille’s law resistance goes as 1/r4, where r is the radius (powers). So a small change in radius makes a large change in resistance. Capillaries have no smooth-muscle coat (whether brain pericytes narrow them is taken up under four circulations). The arterioles are both where the pressure goes and where the tap is.
For the whole systemic circuit, aorta to right atrium, lump every vessel into one resistance:
In words Total peripheral resistance equals mean arterial pressure minus right atrial pressure, divided by cardiac output.
- TPR“T P R, total peripheral resistance”
- every systemic vessel lumped into one resistance. A steady-state number that reflects arteriolar tone.mmHg min per L
- MAP“M A P”
- mean arterial pressure, the upstream endmmHg
- Pra“P r a”
- right atrial pressure, the downstream endmmHg
- CO“C O”
- cardiac output, the flow through the whole circuitL per min
Sanity check For the same pressure drop, twice the flow means half the resistance. Rearranged, MAP = TPR × CO + Pra: if resistance falls and output does not rise, mean pressure falls.
Try one number
Round values to keep the arithmetic easy (not the worked problem’s numbers): MAP 93 mmHg, Pra 3 mmHg, cardiac output 5 L per min.
Pressure drop: 93 − 3 = 90 mmHg. TPR = 90 / 5 = 18 mmHg min per L.
In the other common unit: 18 × 80 = 1,440 dyn s cm−5.
Need a refresher? rates and “per” · units and prefixes
TPR’s unit, mmHg min per L, is the Wood unit; multiplying by 80 gives dyn s cm−5, because 1 mmHg is 1,333 dyn per cm2 and 1 L per min is 16.7 cm3 per s (1,333 / 16.7 ≈ 80). Because small arteries and arterioles hold most of the resistance, total peripheral resistance (TPR) rises and falls mainly with arteriolar tone.
Beds in parallel share one pressure
Most organs are fed side by side from the aorta and drain side by side into the venae cavae, so each sees nearly the same driving pressure, MAP − Pra. (Portal circulations are the exception: gut blood passes through the liver, and the kidney’s glomerular and peritubular capillaries lie one after the other.) Resistances in parallel add as reciprocals:
In words One over the total resistance equals one over the first resistance, plus one over the second, plus one over the third, and so on.
- R“R”
- the total resistance of the parallel bedsmmHg min per L
- R1“R one”
- the resistance of the first bedmmHg min per L
- R2“R two”
- the second bedmmHg min per L
- R3“R three”
- the third bedmmHg min per L
Sanity check Read 1/R as how easily blood gets through: each bed adds its own ease. So the total is always smaller than the smallest single resistance, and every added path lowers it.
Try one number
Two equal beds, each a round 10 mmHg min per L.
Step 1, add the reciprocals: 1/10 + 1/10 = 0.1 + 0.1 = 0.2.
Step 2, take the reciprocal of the sum: R = 1 / 0.2 = 5 mmHg min per L. Two equal paths halve the resistance (n equal paths divide it by n).
Need a refresher? rates and “per”
So a tissue that relaxes its arterioles therefore takes more flow and lowers total peripheral resistance (TPR). What happens to everyone else depends on whether the pressure is held.
Worked problem: one muscle bed inside the whole circulation
Made-up round numbers, adult human at rest, steady state: heart rate 75 per min, stroke volume 80 mL, pressure 120/80 mmHg, right atrial pressure 3 mmHg. Assume lumped resistances, Poiseuille scaling and the one-third rule for MAP at this heart rate (MAP ≈ DBP + PP/3, explained in the compliance section).
- Whole circuit. CO = 75 per min x 0.080 L = 6.0 L per min. Pulse pressure (PP) = 120 − 80 = 40 mmHg. MAP = 80 + 40/3 = 93.3 mmHg. TPR = (93.3 − 3) / 6.0 = 15.05, about 15 mmHg min per L or 1,200 dyn s cm−5.
- Series. Muscle bed: arteries 4, arterioles 24, capillaries 6, venules and veins 6 mmHg min per L, total 40. These are made-up numbers, chosen so the capillary share matches the cat value. All other beds together: 24, chosen so the total comes to 15. Check, in parallel: 1/40 + 1/24 = 0.0250 + 0.0417 = 0.0667, and the reciprocal, 1 / 0.0667, gives R = 15.0. (The split suits the arithmetic; resting human muscle takes a smaller share of output.)
- Drops. With 90 mmHg of driving pressure (rounded), muscle flow = 90 / 40 = 2.25 L per min and the rest 90 / 24 = 3.75; sum 6.0. In muscle: arteries 2.25 x 4 = 9 mmHg, arterioles 54 mmHg (60 percent), capillaries 13.5 mmHg (15 percent, close to the cat value), veins 13.5 mmHg. Total 90.
- Radius. Resistance goes as 1/r4. Halving arteriolar resistance (24 to 12) needs r4 to double, so the radius goes up by the fourth root of 2, 1.19, about 19 percent (check: 1.19 x 1.19 = 1.42, and 1.42 x 1.42 = 2.0). Halving the radius would raise resistance 24 = 16-fold.
- Exercise. Dilation of arterioles and feeding arteries lowers the muscle bed to 8. Then 1/8 + 1/24 = 0.1667, and 1 / 0.1667 gives TPR = 6.0.
Predict. The muscle bed has just dilated from 40 to 8. Suppose nothing defends the pressure: cardiac output stays at 6.0 L per min and no other bed constricts. What happens to MAP, and to the flow reaching all the other beds?
Check your prediction
Rearrange the TPR equation to MAP = TPR x CO + Pra. At unchanged output, MAP = 6.0 x 6.0 + 3 = 39 mmHg. The muscle now gets 36 / 8 = 4.5 L per min, but the other beds get only 36 / 24 = 1.5 L per min, down from 3.75. The dilating bed has stolen flow from the rest.
Now let the pressure be defended. To hold 93 mmHg at a TPR of 6.0, output must reach 90 / 6.0 = 15 L per min. Then the muscle gets 90 / 8 = 11.25 L per min, and the other beds still get 3.75, unchanged. In both cases the muscle’s share of output rises from about 38 to 75 percent. Only in the second does it take that share without starving anyone.
These numbers are a sketch, not a forecast of real exercise; they show why the reflexes exist. In exercise, a rise in output and constriction of other beds work together; when sympathetic restraint is lost, as in autonomic failure, pressure falls during large-muscle exercise. The reflexes themselves are in regulating arterial pressure.
Lumped, illustrative numbers, no reflexes unless Hold MAP is ticked.
- Muscle bed resistance
- Other beds resistance
- Total peripheral resistance, TPR
- Mean arterial pressure, MAP
- Flow to the muscle bed
- Flow to the other beds
- Muscle share of cardiac output
In this sketch: steady state, lumped resistances, starting values from the lesson’s worked problem (adult human at rest), right atrial pressure 3 mmHg, and no reflexes, so nothing changes cardiac output or the other beds when pressure changes; ticking “Hold MAP” stands in for the reflexes by setting cardiac output to 90 / TPR (real reflexes also constrict other beds). Resistances are in mmHg min per L. The worked problem’s made-up round numbers: the muscle bed has arteries 4, arterioles 24, capillaries 6 and venules and veins 6 (total 40), all other beds together are 24, and cardiac output is 6.0 L per min. Poiseuille scaling (R proportional to 1/r⁴) is applied to the muscle arterioles only; the lesson says it holds only approximately in vivo. At the starting setting this sketch gives MAP 93.0 mmHg, where the lesson’s 93.3 comes from the one-third rule with the driving pressure rounded to 90. Made up for the sketch: the slider ranges (radius 0.7 to 1.6 times resting, feeding arteries, capillaries and veins 0.25 to 1 times 16, cardiac output 4 to 15 L per min unless MAP is held, other beds 1 to 2 times 24), and that “constricting the other beds” simply multiplies their 24. The lesson’s exercise step lowers the muscle bed to 8 by dilating arterioles and feeding arteries and recruiting capillaries. Here the second slider scales the arteries, capillaries and veins together, an even split made up for the sketch; the exercise-step button sets it to 0.25 and the arteriole radius to 1.57, giving 4 + 24 / 1.57⁴ = 4 + 3.95 = 7.95, about 8. Arteriole block height follows radius; all drawings are schematic, not to scale.
Rule to keep: parallel beds share one driving pressure, MAP − 3 mmHg, so every widened parallel path lowers TPR; within the muscle bed the segments are in series with the same flow, so each segment’s share of the pressure drop equals its share of the resistance.
With the box unticked the sketch has no reflexes, so it shows the undefended case; tick it to let output rise and hold MAP. The exercise-step button sets the muscle bed to about 8, as in the Predict above. You can also bring MAP back by hand: raise cardiac output or constrict the other beds.
Tissues set their own flow
When a tissue works harder, its arterioles relax and flow follows. No single signal does it. Several overlap: adenosine, K+, CO2 and H+, and low O2 from the working tissue, and nitric oxide from the endothelium. The myogenic response to stretch is a separate mechanism that answers pressure, not activity (next section). One contrast to keep straight: hypoxia dilates systemic arterioles but constricts pulmonary arterioles (ventilation and perfusion).
Autoregulation: the tap that holds flow steady
The same tap can hold flow steady when pressure changes. Autoregulation holds a bed’s flow relatively constant over a range of perfusion pressures while its metabolic demand is unchanged.
Picture the curve: perfusion pressure along the bottom, flow up the side. At low pressures flow rises with pressure. Across a middle range the line runs nearly level, though not perfectly flat. Above that range flow rises with pressure again. For Q = ΔP / R to stay put while ΔP rises, R must rise in proportion, so across the middle range the arterioles narrow as pressure climbs and widen as it falls.
One mechanism is the myogenic response, the acute reaction of a small artery to a change in transmural pressure (the pressure across its wall), told with Bayliss’s 1902 experiment in smooth muscle. The kidney adds tubuloglomerular feedback (glomerular filtration).
Predict. A bed is autoregulating well. Perfusion pressure keeps falling, and its arterioles keep widening to hold flow. What happens once they cannot widen any further?
Check your prediction
Flow starts to fall with pressure. The pressure at which the resistance vessels are maximally dilated is the lower limit of autoregulation. Below it R cannot fall any further, so flow falls with pressure, and as the vessels narrow passively at low pressure it falls even faster. The tap is fully open.
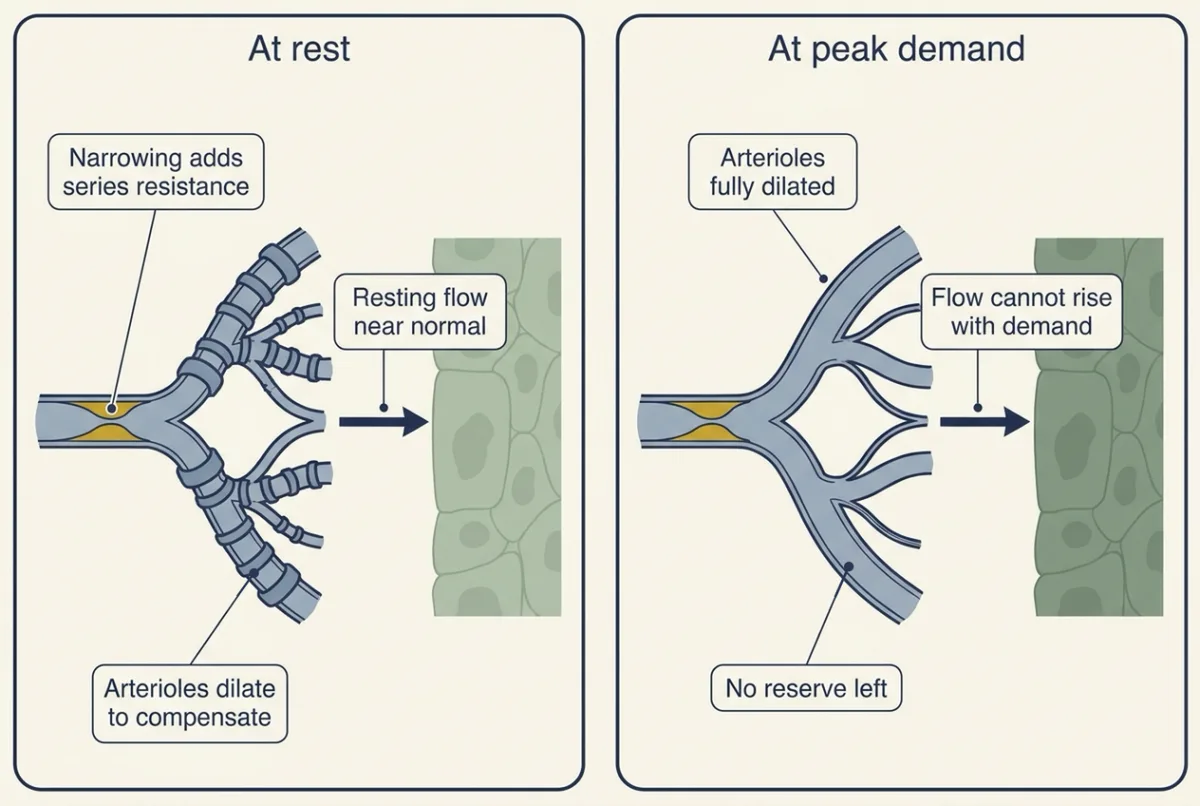
A narrowing upstream: flow at rest, flow at full demand
Add a fixed narrowing (a stenosis) in the artery feeding a bed. It is a resistance in series, and it climbs steeply as its radius falls; past a tight narrowing, disturbed, turbulent flow costs extra pressure. Either way, pressure beyond the narrowing falls.
Predict. The bed beyond the narrowing autoregulates. Will its flow be low at rest? Will it be low when the tissue’s demand is at its peak?
Check your prediction
At rest, no. The downstream arterioles dilate, and their lower resistance offsets the extra resistance of the narrowing, so the path’s total resistance, and resting flow, stay near normal. At peak demand, yes. Those arterioles have already spent part of their dilation, so they reach the lower limit sooner; from then on flow follows pressure and cannot rise with demand. What is lost is reserve. In the heart, the inner layers of the left ventricle fare worst: systole squeezes their vessels, so they are fed mainly in diastole.
Metabolic signals: Berne and adenosine
Metabolism sets flow most clearly in the heart, where flow tracks oxygen use. Adenosine was Berne’s candidate for the signal. Later receptor blockade in dogs, reviewed by Goodwill and colleagues (2017), found adenosine a potent dilator whose role is not evident unless oxygen delivery is compromised; other signals probably overlap.
In 1963 Robert Berne made isolated perfused cat hearts and open-chest dogs hypoxic (short of oxygen). Coronary vascular resistance fell, and the heart muscle released inosine and hypoxanthine, breakdown products of adenosine: by his estimate, 3 to 27 times the amount that, infused as adenosine, would double coronary flow. He proposed that adenosine, formed as ATP breaks down when oxygen supply falls short of use, diffuses to the arterioles and dilates them.
Nitric oxide sets resting tone
The endothelium keeps resting arterioles partly open all the time. In healthy volunteers, Vallance, Collier and Moncada (1989) infused L-NMMA, a nitric oxide synthase (NOS) inhibitor, into the brachial artery. Basal forearm flow halved. Dilation to acetylcholine was blunted, but not dilation to glyceryl trinitrate, a nitric oxide donor. So in the forearm, resting arterioles are held partly dilated by continuous nitric oxide release. How the endothelial relaxing factor was found and identified is in senses and cGMP.
Who turns the tap: four circulations
In every organ the arterioles are the tap; what changes is who turns it.
Heart: metabolism. At rest the left ventricle extracts 60 to 80 percent of delivered oxygen, so it has little extraction left to call on, and more oxygen use is met mainly by more flow. Systole compresses vessels inside the muscle, so left ventricular inflow rises in diastole.
Brain: neural activity and CO2. Brain flow autoregulates across a middle range of pressures (Going deeper, “Lassen’s curve”). Cerebral vessels are very sensitive to arterial PCO2: a rise dilates them, a fall constricts them. Active neurons raise local flow (neurovascular coupling). Whether capillary pericytes help set fast changes in brain flow, or only slow, basal resistance, is unsettled, and nearly all the data come from rodents, mostly mouse cortex (Going deeper, “Do capillary pericytes control brain flow?”).
Skeletal muscle: metabolites plus nerves. In human studies no single dilator explains much more than 20 to 30 percent of exercise hyperemia. Working muscle also blunts sympathetic constriction (functional sympatholysis, a contested term). Quadriceps perfusion in knee-extensor exercise reached about 2.5 L per kg per min (Andersen and Saltin 1985). How output is redistributed in whole-body exercise is in exercise physiology.
Skin: temperature, through nerves. Skin flow follows body temperature more than skin metabolism. In human whole-body heating it has been estimated to reach 6 to 8 L per min, with 80 to 90 percent of the dilation coming from a sympathetic active vasodilator system (skin and human heat).
Compliance: the pulse the rule leaves out
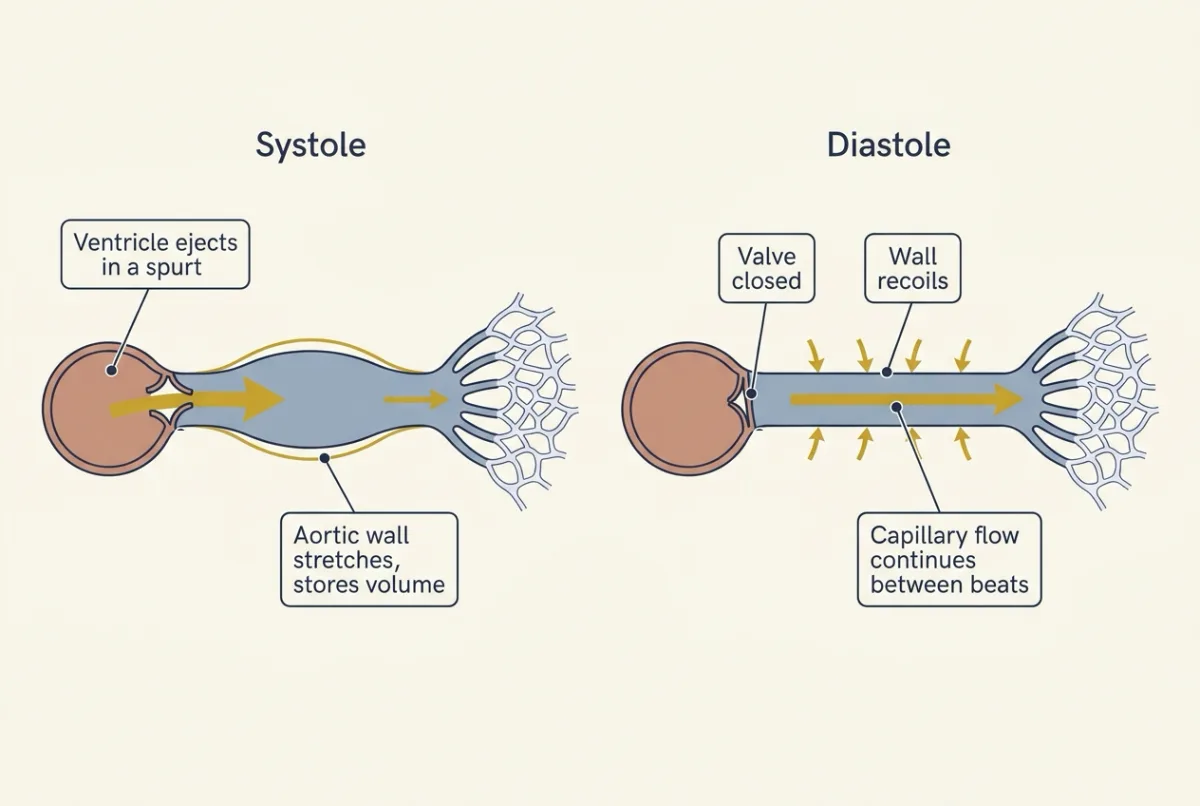
The heart ejects in spurts, but flow through the capillaries keeps going between beats. That is the job of compliance: how much a vessel stretches, how much volume it takes up for each step in pressure.
In words Compliance equals the change in volume divided by the change in pressure.
- C“C”
- compliance. Its inverse, elastance, measures stiffness.mL per mmHg
- ΔV“delta V”
- the change in volumemL
- ΔP“delta P”
- the change in pressure that goes with itmmHg
Sanity check A stretchy vessel (large C) takes up a given volume with only a small rise in pressure; a stiff one (small C) needs a large rise for the same volume.
Try one number
The worked problem’s arteries: a stroke volume of 80 mL raises aortic pressure by a pulse pressure of 40 mmHg.
The stroke-volume-over-pulse-pressure estimate: 80 / 40 = 2.0 mL per mmHg.
Arteries half as compliant would need twice the pulse, 80 mmHg, to take the same 80 mL.
Need a refresher? rates and “per”
During ejection the arteries fill faster than they drain, so their walls stretch; in diastole they recoil and keep capillary flow going. Otto Frank’s two-element Windkessel, a compliance feeding a resistance, explains the smooth fall of aortic pressure in diastole. At rest, stroke volume divided by aortic pulse pressure is a useful estimate of total arterial compliance. It is an estimate, not compliance itself, because some blood runs off through the resistance while the heart is still ejecting; it falls about in step when compliance falls, so it works for comparisons (Going deeper, “Compliance from the pulse”).
Mean arterial pressure is the time average of the pressure curve, the area under it divided by the cycle length, not the average of systolic and diastolic. At resting heart rates diastole fills roughly two thirds of the cycle, so the pressure spends most of its time near diastolic. That gives the standard estimate: start at diastolic pressure (DBP) and add one third of the pulse pressure (PP).
MAP ≈ DBP + PP/3
For the worked problem’s 120/80 that gave 93.3 mmHg, below the simple average of 100. With no pulse at all, MAP would equal DBP. At fast heart rates diastole shortens more than systole, so the true mean sits higher than this rule gives (Going deeper, “The one-third rule at fast heart rates”).
Predict. Halve arterial compliance, keeping stroke volume and mean pressure the same. What happens to systolic pressure, diastolic pressure and pulse pressure?
Check your prediction
Use the worked problem’s arteries (stroke volume 80 mL, pulse pressure 40 mmHg). Under the stroke-volume-over-pulse-pressure rule, the same 80 mL into half the compliance doubles the pulse: PP = 80 mmHg. The mean stays at 93.3 mmHg, so DBP = 93.3 − 80/3 = 66.7 mmHg and SBP = 66.7 + 80 = 146.7 mmHg. So 120/80 becomes about 147/67: systolic and pulse pressure up, diastolic down, mean unchanged. These figures are an approximation, because the one-third rule itself shifts a little when the waveform changes shape. (This treats 120/80 as aortic pressure; a cuff reading on the arm usually has a wider pulse than the aorta.)
Mean pressure depends on cardiac output and resistance, not on compliance. That is why the guiding rule could ignore the pulse. Real stiffening also changes how the pulse wave travels and reflects, but its main effect is a wider pulse.
Stiffer arteries widen the pulse in people too. In Framingham longitudinal data on 2,036 untreated adults, after age 50 to 60 diastolic pressure declined, pulse pressure rose steeply and mean pressure levelled off, consistent, the authors judged, with large-artery stiffening.
Veins are the compliant side. In humans they hold about 70 percent of the blood and are roughly 24 times more compliant than arteries in the standard textbook estimate. Unstressed volume fills a vessel without stretching its wall; stressed volume stretches it and makes pressure. About 75 percent of venous volume is normally unstressed, so veins act as a reservoir, and venoconstriction shifts unstressed into stressed volume without adding blood (cardiac output and venous return).
Going deeper
The main line above does not depend on these details.
How well Poiseuille’s law fits blood
Poiseuille’s law is R = 8 x viscosity x length / (pi x r4). It assumes steady laminar flow of a Newtonian fluid in a rigid tube, which blood in vessels only approximates: in rat mesentery, 10-micrometre microvessels at normal hematocrit had about four times the resistance of a glass tube of the same bore (Pries and colleagues 1994).
By continuity, flow equals mean velocity times cross-sectional area, so blood moves slowest in the capillary bed, whose combined area dwarfs the aorta’s. Flow stays laminar, in smooth layers, while the Reynolds number (density x velocity x diameter / viscosity) is low; in a straight pipe it tends to turn turbulent above roughly 2,000. Fast flow in a wide vessel (the ascending aorta at peak ejection) or a jet past a narrowing favours turbulence, which also makes noise.
Why capillaries lose in muscle
Poiseuille’s law alone does not decide it. With illustrative geometry, a 20-micrometre arteriole against a 5-micrometre capillary half as long, one capillary resists about 128 times more than one arteriole. In this two-level toy, the capillary level as a whole has the smaller resistance only if capillaries outnumber those arterioles by more than about that factor; real arteriolar resistance is spread over several generations in series.
Reactive hyperemia
Reactive hyperemia is the surge of flow when a limb’s arterial inflow is released after a brief occlusion. Folkow proposed in 1949 that removing pressure-induced stretch of small vessels is a major factor in its first stage, and accumulated metabolites probably add to it. In the human forearm, nitric oxide plays a minimal to modest role at the peak and prostaglandins matter for peak flow (Tagawa and colleagues 1994; Engelke and colleagues 1996), so reactive hyperemia is not a test of endothelial nitric oxide. Flow-mediated dilation of a conduit artery is a separate measurement.
Is adenosine necessary?
Berne’s test was one of sufficiency: if oxygen-poor muscle releases the dilator, hypoxia should lower coronary resistance and enough dilator-like material should appear in the venous effluent. His result rules in a sufficient amount, if the purines leave the cell as adenosine, an assumption he stated. He did not measure adenosine, and release does not prove necessity.
Design problem. Using an isolated perfused heart or an anesthetized dog, design an experiment to test whether adenosine is needed to match coronary flow to oxygen demand.
One way to do it
Raise demand at normal oxygen supply (pacing or a positive inotrope), and separately lower the supply. Measure coronary flow and myocardial oxygen consumption (flow times the arteriovenous oxygen content difference) and plot one against the other. Repeat under adenosine receptor blockade or with an enzyme that removes adenosine, and prove the block works by showing that the response to infused adenosine is lost. Also measure coronary venous oxygen, because blockade can lower flow and oxygen consumption together and hide an effect on their slope. If adenosine is the coupler, blocking it should make venous oxygen fall as demand rises, because flow no longer keeps up; with the system intact, venous oxygen stays roughly constant because flow rises with demand. If it is one of several redundant signals, little changes at normal supply, but blockade worsens the oxygen balance when supply is compromised, as the dog studies found. Measure adenosine in interstitial fluid if possible: adenosine is taken up and broken down quickly, so venous levels are an imperfect index of what the arterioles see, and the bias differs between the heart’s own production and an infusion. A negative result in one preparation does not exclude a role elsewhere, and several mediators may each be small, as in exercising muscle.
Nitric oxide: the knockout mice
The endothelial relaxing factor was found by Furchgott and Zawadzki (1980) and identified as nitric oxide in 1987. Mice lacking endothelial nitric oxide synthase (NOS) (Huang and colleagues 1995) lost acetylcholine relaxation of aortic rings and were hypertensive, though non-endothelial NOS isoforms may help maintain pressure, and the rise need not be purely vascular.
Compliance from the pulse
Frank’s two-element Windkessel (1899) fits systole poorly; his other work is in circulation and the heart. In 31 adults at rest during cardiac catheterization, 7 of them controls and the rest patients with heart disease (Chemla and colleagues 1998), stroke volume divided by aortic pulse pressure gave a reliable estimate of total arterial compliance, a resting rule of thumb. In a simple two-element model with the worked problem’s resistance, heart rate and stroke volume and an ejection lasting about 0.3 s, the estimate runs high by about half (about 3.1 mL per mmHg when the true value is 2.0), because part of each stroke volume drains away during ejection, but it falls nearly in step when compliance falls. So the worked problem’s 2.0 mL per mmHg is the estimate; in this model the true compliance that gives a 40 mmHg pulse is about 1.3.
The one-third rule at fast heart rates
The one-third rule is attributed to Gauer (1960). Invasive studies suggest one third underestimates the mean, perhaps nearer 0.4, and more so as heart rate rises. A heart-rate-corrected formula, checked against aortic catheter recordings at paced rates in 12 patients (Razminia and colleagues 2004), estimates MAP as DBP + (0.33 + 0.0012 x HR) x PP. At 120 beats per min and 130/70 mmHg, the coefficient is 0.33 + 0.0012 x 120 = 0.474, so MAP is about 70 + 0.474 x 60 = 98 mmHg, against the one-third rule’s 90.
Lassen’s curve
Lassen’s 1959 curve of human cerebral blood flow against mean arterial pressure, often taught as constant flow from 60 to 150 mmHg, was extrapolated from a cross-sectional comparison of 376 people in 7 publications, not from one person’s flow as that person’s pressure changed. A 2021 review (Claassen and colleagues) argues that flow is held relatively stable, not constant, and that the range is no true plateau.
Do capillary pericytes control brain flow?
Hall and colleagues (2014), in rodent brain slices and in vivo, reported that capillaries dilated before arterioles during sensory input and estimated that they produced 84 percent of the flow increase. Hill and colleagues (2015) tested this in mouse cortex in vivo, imaging with a two-photon microscope while light activated channelrhodopsin in mural cells. If capillary pericytes contract, light should narrow the capillaries they cover. Vessels under 10 micrometres covered by pericytes but not by smooth-muscle-actin-expressing cells did not constrict, and the authors concluded that arteriolar smooth muscle regulates cerebral flow. Attwell and colleagues replied that the conflict depends on how a pericyte is defined. Hartmann and colleagues (2021) then reported that stimulated pericytes constricted capillaries slowly and that ablating one pericyte doubled blood-cell flux in capillaries that lost its contact, so pericytes contribute to basal resistance and slow modulation. Capillaries can also sense neural activity and signal arterioles upstream to dilate.
Your notes
Select any text in the lesson to highlight it or add a note to it. Your highlights and notes are saved in this browser and collected in your notebook.
This browser is not letting the site save anything (a private window or strict privacy settings), so highlights and notes will be lost when you leave the page.
How we measure it
Direct micropressure measurement
A glass micropipette is advanced into a single small vessel under a microscope and records the pressure inside it. Repeating this along arteries, arterioles, capillaries and venules maps where pressure falls, and in a series circuit the pressure drop shows where the resistance lies.
Isolated perfused heart
The heart is removed and its coronary arteries are perfused through a cannula in the aorta, so the experimenter sets perfusion pressure and oxygen supply. Coronary flow is measured directly and the coronary venous effluent can be collected and analysed for what the muscle releases.
Venous occlusion plethysmography with intra-arterial infusion
A cuff on the upper arm is inflated enough to stop venous outflow but not arterial inflow, so the forearm swells at a rate equal to its arterial inflow, read by a strain gauge. Infusing a drug into the brachial artery at low, subsystemic doses keeps its effect mainly in that forearm, so local mechanisms can be tested in healthy volunteers.
Two-photon imaging with optogenetics
Through a cranial window, a two-photon microscope images single vessels deep in living mouse cortex. Light-gated ion channels expressed in chosen cells let the experimenter activate those cells and watch whether the vessels they cover change diameter.
Practice questions on this lesson (4) → MCAT-style, original, each with an explanation
Where this lesson fits
Before thisReview first
- Cardiac Output and Venous ReturnThis course · Lesson 7
You need cardiac output and the pressure it works against to calculate total peripheral resistance here.
- The Cardiac Cycle and Pressure-Volume LoopsThis course · Lesson 6
Stroke volume and the pressure it produces during each beat are used here to estimate arterial compliance.
- Smooth Muscle and the Myogenic ResponseThis course · Lesson 4
The myogenic response of small arteries to stretch is used here to explain autoregulation.
After thisStudy next
- Capillary Exchange, Lymph and EdemaThis course · Lesson 9
It takes up the capillary bed, where arteriolar resistance sets the pressure that drives filtration.
- Regulating Arterial PressureThis course · Lesson 10
It shows how reflexes and kidneys defend the mean arterial pressure this lesson assumes is held steady.
- Exercise: The Whole Body at WorkThis course · Lesson 30
It applies muscle arteriolar dilation and redistribution of output to the whole body at work.
Elsewhere on the siteFilms, simulations and method films in other courses
- Starling forces along a capillarySimulation · Organismal Biology
Flow equals pressure difference over resistance there, the same relation used here to find where pressure falls.
- Downhill in PressureFilm · Organismal Biology
It shows flow as pressure difference divided by resistance, the relation used here to locate resistance.
- One Flow, Two PressuresFilm · Organismal Biology
It shows both sides of the heart pumping the same flow around two circuits in turn.
Suggested by an AI model from the lessons themselves, then checked. How we use AI
Finish line
Test yourself
10 questions
Practice and MCAT-style, with explained answers.
Next · Lesson 9
Capillary Exchange, Lymph and Edema
Adults born with almost no plasma albumin usually have only mild swelling. What keeps their tissues from flooding?
Continue →