Ecology and Evolution · Unit 5: Ecosystem processes
New to this? Review it at high school level: Energy in Ecosystems
Energy Flow and Productivity
Rewritten on : new text, flashcards and film. Your notes and highlights stay, but the text around them may have moved.
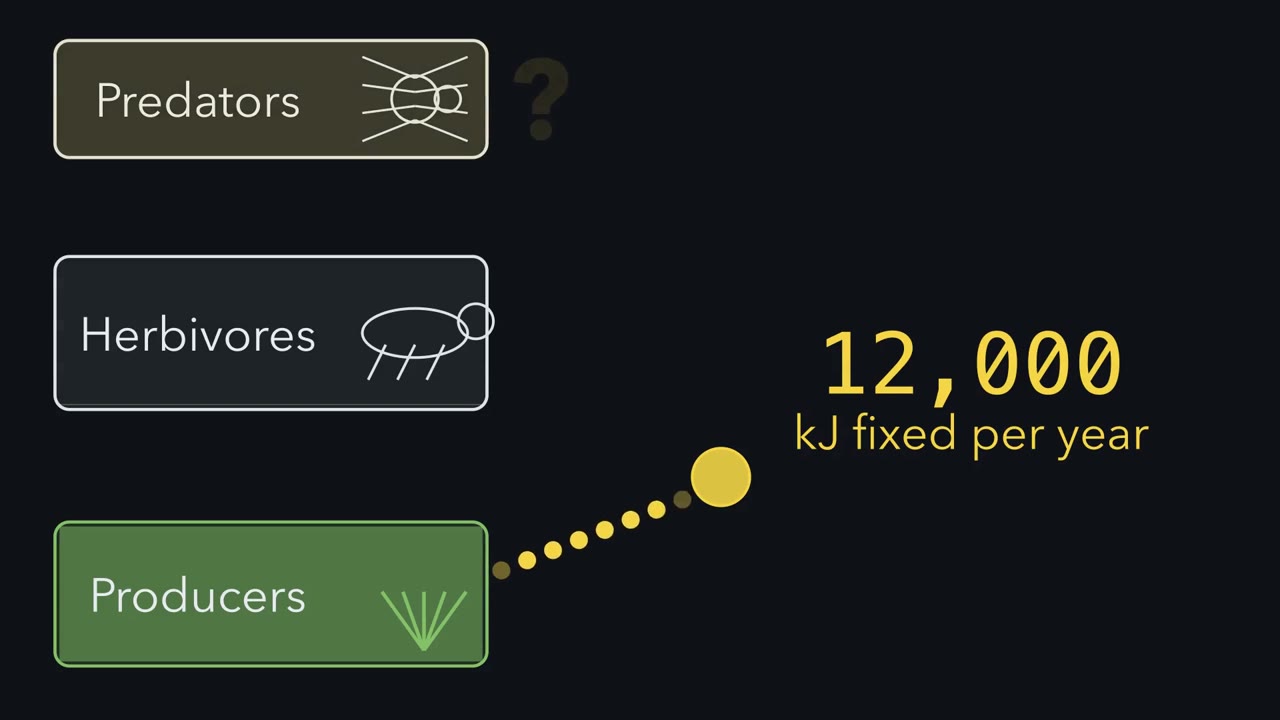
In a made-up budget, plants on one square metre fix 12,000 kilojoules a year and the top predators make 40. Where did the rest go?
Pause when the reading reaches a film, and offer to play it. Saved on this device.
Watch the film now, or keep listening
Builds on:Predation and Community EffectsPopulation Growth and RegulationWhy these?
 ▶ Watch Three Doors · 3:05
Read the transcript of “Three Doors”
Film transcript: Three Doors
Plants on one square metre fix 12,000 kilojoules in a year. Why does so little of that energy reach the animals at the top? These numbers come from a made-up budget for one year. Each one is a rate, energy per square metre per year. That is production. It is a flow, like deposits into an account, not the balance at one moment. The plants' total fixation is called gross primary production The plants respire part of it just to stay alive. In this budget it is half, and that half leaves as heat. What remains is net primary production It is all the energy left for everything else, to eat or to store. Now follow it up one feeding step, to the herbivores.
At this step, every kilojoule has three ways out. Call them doors. The herbivores could eat most of the plants' production, or only a little of it. Which do you expect? Only a little, here less than a third. The rest is never eaten. It dies and drops through the brown door, into detritus. Detritus is dead matter that feeds bacteria, fungi and animals that eat it. Of what the herbivores eat, much passes straight through, as feces. That goes out the brown door too, into the same detritus. Of what they absorb, a large part is respired just to keep them alive. It leaves through the grey door, as heat. What is left becomes new herbivore tissue and offspring.
That is the herbivores' production, passed up from the plants. Predators can eat it, but they do not eat all of it. Each door sets a fraction, drawn as a valve on the pipe. One is the share eaten. One is the share absorbed. One is the share made into tissue. The three valves in a row give the share that reaches the herbivores. It is the product of the three fractions, called the trophic transfer efficiency. Nothing vanishes along the way. The three doors together account for every kilojoule that this step received. In this budget, the books close. At every step up, the same three doors open again. So the fractions multiply, and production shrinks fast up a food chain.
This holds for rates over one period, in one currency, while consumers eat no more than the production below them. Energy never returns to the plants. It is stored for a while, or leaves as heat.
From the film
- Production is a rate, energy fixed or formed per square metre per year; biomass is a stock.
- Net primary production is gross primary production minus what the producers themselves respire.
- At every feeding step energy leaves by one of three doors: passed up as consumer production, dropped into detritus (uneaten, or as feces), or lost as heat.
- Transfer efficiency is consumption times assimilation times net production efficiency; in the made-up budget the first link passed on 6%.
- Because the fractions multiply, production shrinks fast up a food chain, as long as consumers eat no more than the production below them.
The first film opened the three doors on one feeding step and found 6% passed up to the herbivores. It left out how anyone measures these flows, what happens one step higher, and where the dead matter goes.
The one idea. At every feeding step, energy leaves by one of three doors: passed up as consumer production, dropped into detritus (uneaten, or as feces), or lost as heat. The share passed up is a product of three fractions, consumption × assimilation × net production efficiency, so production shrinks fast up a food chain.
Scope: a simplified budget of rates over one period (usually a year), in one currency per area. It assumes production not eaten during the period enters detritus (in real budgets some stays as living biomass, is eaten along another food-web link, or is exported). Small losses such as excreted wastes are lumped with detritus or neglected. Production shrinks as long as consumers eat no more than the production below them (Going deeper). Energy never returns to the producers: it is stored for a while or leaves as heat. Only matter cycles.
The machinery belongs to Biochemistry: the light reactions make ATP and NADPH, the Calvin cycle uses them to fix CO2, and oxidative phosphorylation recovers energy from food through a proton-motive force (vocabulary in basic concepts of metabolism). Here you keep the totals.
Production is a rate: GPP, NPP and NEP
Production is the rate at which new organic matter, or its energy, is formed per unit area or volume per unit time, such as kJ m−2 yr−1 (kilojoules per square metre per year) or g C m−2 yr−1 (grams of carbon). Biomass (standing crop) is a stock: how much is there at one moment, in g m−2 with no time unit. A small stock can sit on a large production if it turns over quickly, as fast-dividing phytoplankton do.
Real plants often respire roughly half of the energy they fix.
In words Net primary production is gross primary production minus what the producers respire.
- NPP“N P P, net primary production”
- what is left after the producers’ own respiration: the energy available to everything elsekJ m−2 yr−1
- GPP“G P P, gross primary production”
- the total rate of photosynthetic fixation by the producers, the first trophic level (a step in feeding defined by what an organism eats)kJ m−2 yr−1
- Ra“R sub a, autotrophic respiration”
- what the producers (autotrophs, organisms that make their own food) themselves respirekJ m−2 yr−1
Sanity check If producers respired nothing, NPP would equal GPP. If they respired everything, NPP would be zero. A common slip is to call GPP “what is left after plants respire”; that is NPP.
Try one number
In the first film’s budget, NPP = 12,000 − 6,000 = 6,000 kJ m−2 yr−1: the plants keep half of what they fix.
Need a refresher? units and prefixes
Net ecosystem production (NEP) subtracts Reco, the respiration of the whole ecosystem: Ra plus the respiration of animals, fungi and bacteria.
NEP = GPP − Reco
NEP is what is fixed and not respired. If no organic matter is carried in or out (by water or harvest, say), it is what the ecosystem stores, and GPP = Reco + NEP: everything fixed is either respired or stored. In an open system some fixed carbon is exported, and imported organic matter also changes the stock.
Measuring it: bottles, harvests and towers
No method observes GPP directly at ecosystem scale; each measures one door, or the net, and infers the rest.
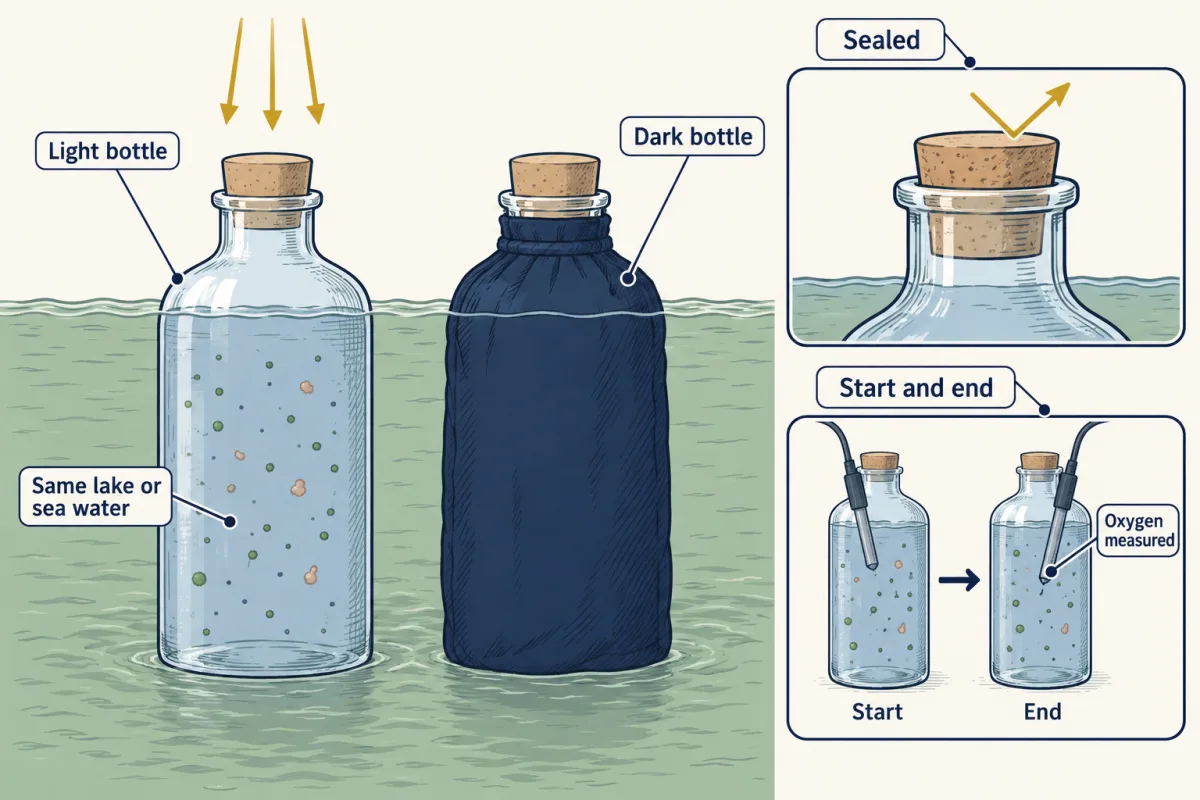
Light and dark bottles. Seal paired bottles of lake or sea water, keep one dark, and incubate both. Write Ostart for the oxygen at the start, L for the final oxygen in the light bottle, D for the final oxygen in the dark bottle, and t for the incubation time. The light bottle gains oxygen from photosynthesis and loses it to respiration, so its change is net community production = (L − Ostart) / t.
Predict. The light bottle already gives you a net. What does the dark bottle tell you that the light one cannot?
Check your prediction
The heat door on its own, for the whole community in the bottle. The dark bottle only respires, so its loss is respiration = (Ostart − D) / t. Photosynthesis is the light bottle’s net gain plus what respiration took away, so add the two lines.
In words Gross primary production is the light-bottle oxygen minus the dark-bottle oxygen, divided by the time.
- GPP“G P P”
- gross primary production, here as gross oxygen production by all the bottle’s photosynthesizers, per litre per unit timemg O2 L−1 h−1
- L“L”
- final oxygen in the light bottlemg O2 per L
- D“D”
- final oxygen in the dark bottlemg O2 per L
- t“t”
- incubation timeh
Sanity check If nothing photosynthesized, the two bottles would end the same, L = D, and GPP would be zero. GPP should also equal net community production plus respiration.
Try one number
Round invented values: oxygen starts at 10 mg/L, and after 2 hours the light bottle reads 11 and the dark bottle 9.
Net community production = (11 − 10) / 2 = 0.5. Respiration = (10 − 9) / 2 = 0.5. GPP = (11 − 9) / 2 = 1.0 mg O2 L−1 h−1, which is 0.5 + 0.5.
Where it comes from optional
(L − Ostart) / t + (Ostart − D) / t = (L − Ostart + Ostart − D) / t = (L − D) / t. The starting value Ostart appears once with a minus and once with a plus, so it drops out.
Need a refresher? units and prefixes
This assumes equal respiration in light and dark and no gas escape. The bottle also holds bacteria and zooplankton, so its net is community production, not phytoplankton NPP, in oxygen units until a stated conversion to carbon is justified.
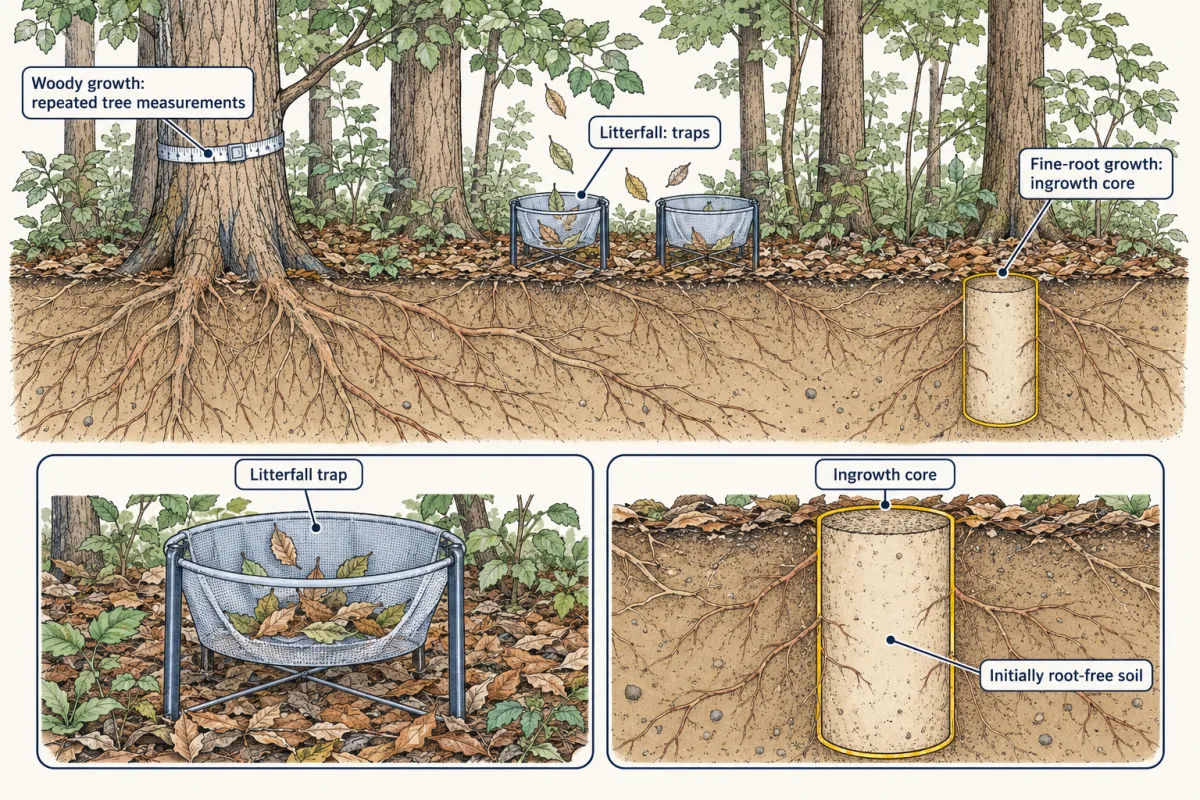
Harvests and component sums. In grassland, clipping and weighing the plants at the season’s peak gives a rough, usually low estimate of aboveground NPP. In forest, add the separately measured parts: Ji Young An and colleagues summed woody growth, litterfall and fine-root growth in nine stands in the Gwangneung Experimental Forest, Korea, where fine roots made up 18 to 44% of the estimated NPP. Where NPP is high in the first place depends largely on temperature and water, the subject of climate and biomes.
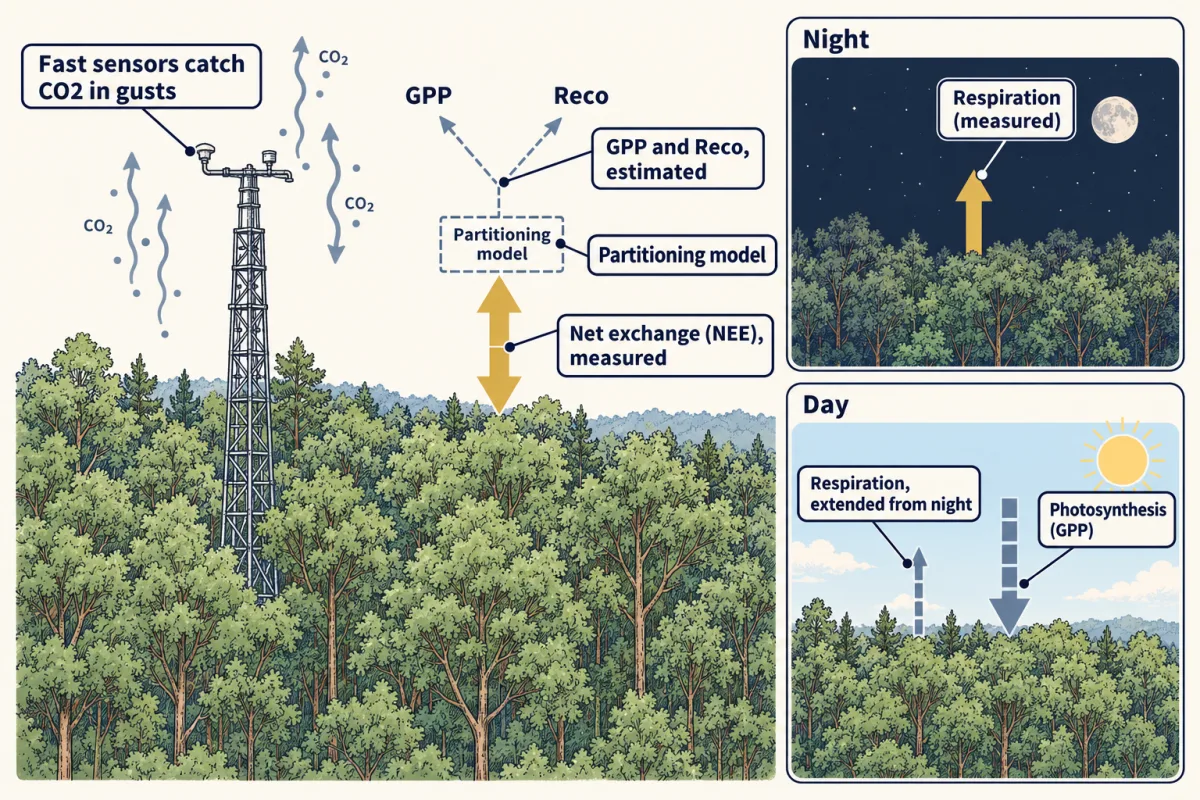
Eddy-covariance towers. Fast sensors above the canopy record how vertical gusts carry CO2 up and down. When rising gusts carry less CO2 than sinking ones, the forest is taking carbon in. Averaged over a year, this gives net ecosystem exchange (NEE), the net flow of CO2 from the ecosystem to the air. The tower sees only this net; a partitioning model splits it into GPP and Reco, commonly by fitting respiration to night-time data (no photosynthesis) and extrapolating it into the day. Methods disagree at the same site (Going deeper), so GPP is an estimate with a method attached.
Predict. A forest stores carbon this year, and its tower counts release to the air as positive. Will its NEE be positive or negative?
Check your prediction
Negative. With release counted as positive, NEE = Reco − GPP, the mirror image of NEP, so an ecosystem that takes up carbon has a negative NEE. Check the sign convention before you read any flux graph.
Following energy through a consumer
Feeding links (predation, mutualism, parasitism and coevolution) are the pipes. In symbols, the first film’s doors for one consumer are what it ingests, I; its feces, egestion; what it assimilates, A; its respiration, R; and its production, P.
A = I − egestion P = A − R
The first film’s three valves are three ratios: consumption efficiency, I / P below (P below is the production of the level eaten); assimilation efficiency, A / I; and net production efficiency, P / A. Their product is the trophic transfer efficiency (TTE): production at one level over production at the level below, in matched units and time.
In words Transfer efficiency is consumption efficiency times assimilation efficiency times net production efficiency, which comes to this level’s production over the production below.
- TTE“T T E, trophic transfer efficiency”
- production at one level divided by production at the level below
- I“I”
- what this level ingests. I / P below is the consumption efficiency.kJ m−2 yr−1
- P below“P below”
- production of the level belowkJ m−2 yr−1
- A“A”
- what this level assimilates (ingested minus egested). A / I is the assimilation efficiency.kJ m−2 yr−1
- P“P”
- this level’s production, new tissue and offspring. P / A is the net production efficiency.kJ m−2 yr−1
Sanity check Assimilation and net production efficiency always lie between 0 and 1. Consumption efficiency does too as long as consumers eat no more than the production below them, and then the product is no larger than any one factor. The units cancel, so TTE has none.
Try one number
The first film’s herbivores: TTE = 0.30 × 0.40 × 0.50 = 0.06, a 6% transfer.
Where it comes from optional
Multiply the three fractions: I on top of the second cancels I on the bottom of the first, and A on top of the third cancels A on the bottom of the second. What remains is P / P below.
Need a refresher? rates and “per”
Door sizes differ between animals: assimilation efficiency tends to be higher for carnivores, because animal tissue is easier to digest than plant cell walls. Net production efficiency tends to be low in birds and mammals, which respire most of what they assimilate, much of it to keep warm, and higher in many invertebrates and fish.
Worked problem. Carry the first film’s made-up budget (one square metre, one year, kJ m−2 yr−1) up to the predators and into the dead matter, with no imports, exports or net decomposer growth. Production that is not eaten enters detritus; predator production, with no one above it, is kept as new predator biomass. From the first film: NPP 6,000, and herbivores ingest 1,800, egest 1,080 and produce 360. Predators ingest 200, egest 100 and respire 60. Decomposers respire 3,240.
Predict. The predators keep the same three doors. Will their link pass on 6% too?
Check your prediction
No, about 11%.
- Predators. A = 200 − 100 = 100. P = 100 − 60 = 40. TTE = 40 / 360 = 11.1%. Check with the three efficiencies: 200 / 360 = 0.556, 100 / 200 = 0.50 and 40 / 100 = 0.40, and 0.556 × 0.50 × 0.40 = 0.111.
- Detritus. Inputs are ungrazed plant production 6,000 − 1,800 = 4,200, herbivore feces 1,080, herbivore production that predators did not eat 360 − 200 = 160, and predator feces 100: total 5,540. Decomposers respire 3,240, leaving 2,300 as detritus. Detritus not yet decomposed piles up, so this year’s books count it as stored.
- Whole system. Total respiration = 6,000 + 360 + 60 + 3,240 = 9,660. NEP = 12,000 − 9,660 = 2,340, which is the 2,300 of detritus plus the 40 of predator production. Check: 9,660 + 2,300 + 40 = 12,000.
No single number describes both links. Decomposers (bacteria, fungi and detritus feeders) respired 3,240, against 420 for the herbivores and predators combined: in this budget most NPP never passed through a grazer. Neither a ratio of biomasses (stocks carry no time unit) nor gross growth efficiency, P / I, is a transfer efficiency (Going deeper).
- Herbivores: A = I − egestion | P = A − R
- —
- Herbivore TTE = P / NPP
- —
- Predator TTE = P / P below
- —
- Detritus inputs | left after decomposers
- —
- Total respiration | NEP = GPP − Reco
- —
- Balance check
- —
In this sketch: a closed system with no imports or exports and no decomposer growth; GPP 12,000 and autotrophic respiration 6,000 are fixed, so NPP is 6,000; predators ingest 200 for every 360 of herbivore production, with assimilation 50% and net production 40%, as in the lesson; decomposer respiration is held at 3,240; all numbers are kJ m⁻² yr⁻¹ and the budget is made up, not measured.
Keep the rule: the transfer efficiency is the product of the three efficiencies, and in this sketch the ledger always closes, because everything fixed is respired, held as detritus, or made into predator production.
That decomposer lead came from invented numbers. The second film tests it in a real salt marsh.
Read the transcript of “Where the Marsh Grass Goes”
Film transcript: Where the Marsh Grass Goes
In the made-up budget, decomposers respired far more than the grazers and predators. Most plant production was never eaten by a grazer at all. Was that just a quirk of invented numbers? In a real ecosystem, where does the plants' production actually end up each year? John Teal asked this on the coast of Georgia. He built an energy budget for a salt marsh, and published it in 1962. One grass dominates these marshes, smooth cordgrass It grows in the tidal mud and makes a great deal of plant matter each year. A grazing-chain picture of ecology predicts the obvious route.
Grass feeds the herbivores, and then the herbivores feed the predators. Teal did not assume the route. He assembled the budget from measurements of the grass and the algae on the mud. It also drew on measurements of the animals and bacteria living there.
Insects and other animals graze on the living grass. Will they take most of its production, or only a small part? Only a small part. In Teal's budget, the purple pipe to the grazers was thin. The grazing chain was a side channel. Much of the grass died instead, and broke into fragments. Bacteria used those fragments, and so did animals that feed on detritus. Those detritus feeders are themselves eaten. So detritus is not a dead end for animals. It is a second route into the food web. Every organism on this route respires. Each one releases heat through a grey door. The energy never returns to the grass. Only matter cycles. Nutrients return to the grass through its roots.
Carbon returns as carbon dioxide, which the leaves fix again. The energy comes from fresh sunlight. Teal's budget also left a remainder. After the respiration of bacteria and animals, about 45% percent of net production was left over. He took it as available to leave the marsh with the tides. But it was a remainder, not a measured export. Even so, the study changed the picture. With others' work on decomposing marsh grass, it moved detritus from a footnote to the centre of coastal budgets.
So keep the brown door in every budget. In this marsh, most grass production went that way rather than to grazers, and respiration released its energy as heat.
From the film
- In Teal's Georgia salt marsh, insects and other animals grazing living cordgrass took only a small part of its production.
- Most grass production went to detritus rather than to grazers: it died, broke into fragments and fed bacteria and detritus-feeding animals, which are themselves eaten.
- Energy in detritus can feed decomposers, detritus feeders and their predators, but it never returns to the producers: respiration releases it as heat, and only matter cycles.
- Teal's figure of about 45% of net production available to leave with the tides was a remainder, not a measured export.
Detritus, transfer efficiency and the 10% rule
Two things the second film left out. Later reviews found little quantitative evidence that Teal’s tidal remainder was actually exported; how much marsh production supports food webs in the estuary beyond became a question for later work. And how far the detrital route it showed, rather than the grazing chain, supports higher trophic levels in a given system is still open. The matter that returns to producers is the subject of nutrient cycling.
How big is the passed-up share in real food webs? From 48 published aquatic food-web models, Daniel Pauly and Villy Christensen derived in 1995 a mean transfer efficiency of about 10%, the classic support for the 10% rule: a rough benchmark from aquatic models, not a law (Going deeper). A 2026 synthesis of 2,052 estimates from 122 studies found a lower average energy transfer efficiency, about 6% (by coincidence, the made-up first link’s value), highest in marine systems and lowest on land. Real links can be far lower or higher.
Predict. At 10% per step, a top predator at the fourth trophic level (counting producers as level 1) receives 0.1% of NPP: three transfers, 0.1 × 0.1 × 0.1 = 0.001. What does it receive at 6% per step?
Check your prediction
0.06 × 0.06 × 0.06 = 0.000216, about 0.022% of NPP, roughly a fifth of what the 10% rule gives. Small changes in efficiency matter once multiplied.
That fast shrinking is one likely reason food chains are short, though not the only proposed limit (Going deeper).
Design problem
Students incubate light and dark bottles of lake water for 6 hours. Initial dissolved oxygen is 8.0 mg/L; at the end the light bottle reads 9.2 mg/L and the dark bottle 7.4 mg/L. These are invented numbers. Calculate net community production, respiration and GPP per hour. Then say what these numbers can and cannot tell you about the lake’s phytoplankton, and how you would improve the study.
Saved in this browser only.
One way to do it
Net community production = (9.2 - 8.0) / 6 = 0.20 mg O2 L−1 h−1. Respiration = (8.0 - 7.4) / 6 = 0.10 mg O2 L−1 h−1. GPP = (9.2 - 7.4) / 6 = 0.30 mg O2 L−1 h−1, which equals 0.20 + 0.10, a useful check.
What the numbers rest on: respiration is assumed equal in light and dark (in the light it can differ) and the bottle sealed. Bacteria and zooplankton are in the bottle, so these are community respiration and community production, not phytoplankton NPP. The figures are oxygen per litre per hour at one depth on one day. Converting them to carbon needs stated quotients: a photosynthetic quotient (moles of O2 released per mole of CO2 fixed) for production and a respiratory quotient (moles of CO2 released per mole of O2 used) for respiration, and an annual areal rate needs measurements through the water column and the seasons.
To improve it, run replicates at several depths through the year, keep incubations short enough that oxygen does not build up unrealistically, and report each result with its spread.
Going deeper
Splitting a tower’s net flux
Besides night-time extrapolation there are light-response fits and neural networks trained on environmental drivers; a 2020 study applied a neural-network method to 36 FLUXNET2015 sites, and agreement among methods is not independent validation. At one Scots pine forest at Hyytiälä, Finland, over 2013 to 2017, daily GPP estimates from two methods based on carbonyl sulfide, a gas leaves take up along with CO2, averaged 7% and 23% above the CO2-based estimate.
When a fraction exceeds 1
Assimilation and net production efficiency cannot exceed 1, because each is a share of what the consumer took in. Consumption efficiency can: when consumers eat down a standing prey stock, they ingest more than the production below them. The product still holds by algebra, but consumption efficiency is then no longer a share of the prey’s production, and a single link’s transfer can look larger over that period.
Gross growth efficiency
Gross growth efficiency, P / I, is production over ingestion: a property of one consumer, not a transfer between levels.
Where the 10% figure came from
Pauly and Christensen used their mean to estimate the primary production needed to sustain world fisheries. It is also not Lindeman’s law: Lindeman compared successive levels of his lake as ratios, but defined them on a different basis.
Food quality
Producers short of nitrogen or phosphorus may limit transfer to herbivores even when carbon is plentiful, so energy is not the only currency that matters.
Chain length and ecosystem size
A 2000 study of 25 northern temperate lakes (Post, Pace and Hairston, Nature) found that food-chain length increased with lake size but not with productivity.
Your notes
Select any text in the lesson to highlight it or add a note to it. Your highlights and notes are saved in this browser and collected in your notebook.
This browser is not letting the site save anything (a private window or strict privacy settings), so highlights and notes will be lost when you leave the page.
How we measure it
Light and dark bottles
Paired sealed bottles of water are incubated, one transparent and one dark, and dissolved oxygen is measured at the start and end. The light bottle gives net community production, the dark bottle community respiration, and their sum an estimate of gross production, in oxygen units, assuming respiration is the same in light and dark.
Harvest and component summation
Net primary production of a forest is estimated by adding separately measured parts: woody growth from repeated tree measurements, litterfall from traps, and fine-root growth from ingrowth cores of initially root-free soil. Any part left out is missing from the total.
Eddy covariance with flux partitioning
Instruments on a tower above the canopy record rapid fluctuations in vertical wind and CO2 concentration, giving the net CO2 exchange between ecosystem and atmosphere. Gross primary production and ecosystem respiration are then separated from that net flux by a partitioning model, so GPP is an estimate that depends on the model.
Mass-balance food-web modelling (Ecopath)
Measured biomasses and feeding rates, combined with parameters taken from other studies where measurements are missing, are balanced into estimated flows between groups. The flows and efficiencies it reports are model outputs that inherit those assumptions.
Practice questions on this lesson (3) → MCAT-style, original, each with an explanation
Where this lesson fits
Before thisReview first
- Predation and Community EffectsThis course · Lesson 17
Feeding links between predators and prey are the pipes that energy moves through in this budget.
- Population Growth and RegulationThis course · Lesson 14
Production as a rate per area per year builds on thinking of growth as a rate.
After thisStudy next
- Nutrient CyclingThis course · Lesson 22
Energy ends as heat, but the matter in detritus returns to producers, which this lesson picks up.
- Biodiversity and Ecosystem FunctionThis course · Lesson 23
It asks how species richness changes production, the rate defined here as NPP.
- Global Change: Species on the MoveThis course · Lesson 24
Warming and changing CO2 shift the production and respiration fluxes defined here.
Elsewhere on the siteFilms, simulations and method films in other courses
- Build an energy pyramidSimulation · Biology
It lets you build an energy pyramid and see production narrowing at each feeding level.
- Why Energy Pyramids NarrowFilm · Biology
It shows why only part of each level becomes tissue the next level can eat.
- Follow the Energy ArrowsFilm · Life Science
It shows energy arrows pointing from food to eater and how little sunlight energy reaches the top consumer.
- The Leaf Pile That Stops GrowingFilm · Life Science
It shows decomposers feeding on dead material and why detritus belongs in an ecosystem's energy flow.
Suggested by an AI model from the lessons themselves, then checked. How we use AI
Finish line
Test yourself
8 questions
Practice and MCAT-style, with explained answers.
Next · Lesson 22
Nutrient Cycling
Cut a forest, leave the logs where they fall and keep it from growing back. Nobody adds fertiliser, yet its stream starts carrying far more nitrogen. Where does that nitrogen come from?
Continue →