Biology · Unit 7: Ecosystems
Energy in Ecosystems
Rewritten on : new text, flashcards and film. Your notes and highlights stay, but the text around them may have moved.
An osprey on the Chesapeake Bay eats fish, and the fish eat plankton, so how much of the sunlight the plankton caught ever reaches the osprey?
Pause when the reading reaches a film, and offer to play it. Saved on this device.
Watch the film now, or keep listening
Builds on:Respiration and ATPCapturing SunlightWhy these?
Where this lesson sits
- Virginia SOL BIO.8b
- Practices BIO.1c, BIO.1d, BIO.1e, BIO.1f
Essential question: Where does your energy come from, and why does there seem to be less of it at each step of a food chain?
-
Life Science (grade 7) LS.5 b
Review it at grade 7 level
In Life Science you drew food webs that show who eats whom. You learned that producers capture energy from the sun, consumers eat other living things, and decomposers break down dead matter. You also built an energy pyramid. It showed that only roughly one-tenth of the energy at one level is passed to the next, because living things give off much of it as thermal energy. Biology adds biomass pyramids, the names primary, secondary and tertiary consumer, and real data that show the one-tenth figure is a rough rule of thumb, not a fixed rule.
-
Biology BIO.8b You are here
This lesson
-
Biology II Biology II: Ecology, EC.3; Advanced Topics, BIOII.6 a-c
Preview where it goes next
In Virginia’s Biology II courses, energy flow is tied to the laws of thermodynamics. The first law says energy is not created or destroyed, only changed in form. The second law says that every energy change loses some energy in a form that living things cannot use again, usually heat. You measure gross primary productivity, the rate at which producers capture light energy, and net primary productivity, what remains after the producers’ own respiration. Ecological efficiency is calculated from production at two levels in matching units. You also follow carbon, nitrogen and phosphorus through sources and sinks, and see why decomposers link matter cycling to energy flow.
-
College
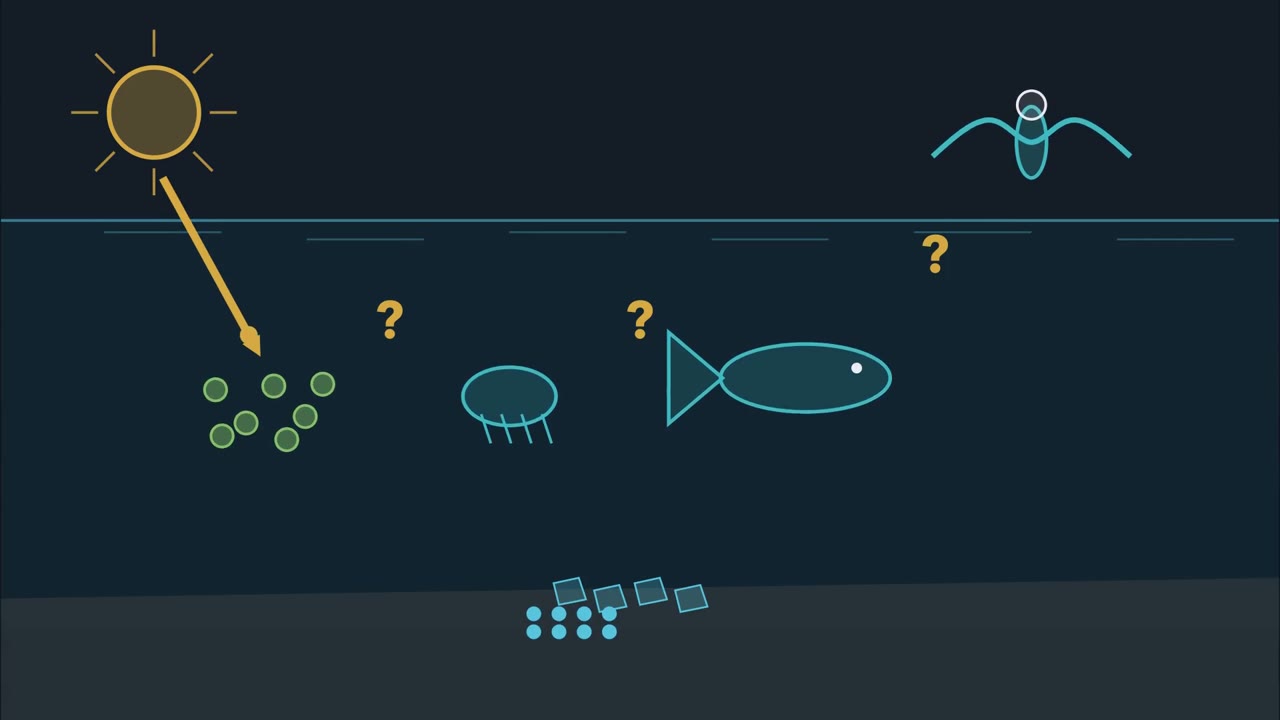 ▶ Watch Why Energy Pyramids Narrow · 3:37
Read the transcript of “Why Energy Pyramids Narrow”
Film transcript: Why Energy Pyramids Narrow
Why does far less of the energy captured by Bay plankton reach the osprey level? Watch a gold band of energy cross the Chesapeake Bay. It enters green phytoplankton from sunlight. Then teal zooplankton, menhaden, and an osprey take turns feeding. The band will change at every step.
Phytoplankton are producers because they capture light energy and store it in food. Animals are consumers because they get energy by eating. Blue decomposers get energy from dead matter and wastes. Gold arrows point from food to eater. Those arrows follow energy, not the animal doing the hunting. When zooplankton feed, the incoming gold band splits.
Cellular respiration releases part as spreading red heat. Uneaten pieces and undigested waste move toward blue decomposers. Only the tissue branch becomes new zooplankton tissue. That branch is available to a menhaden that feeds next. Zooplankton feed is available to a menhaden that feeds next. Now follow the same split inside a menhaden. Which outgoing branch can become osprey tissue? Watch all branches form. Choose before the labels appear.
The branch stored as new menhaden tissue can feed the osprey. Heat has dispersed into water and air. Uneaten or undigested material can still feed decomposers. It does not become osprey tissue through this link. The gold band reaching the osprey is narrower. Ecologists compare levels with energy transfer efficiency. It is the percentage measured at a level that appears at the next. The measurements must match in kind, area, and time. A familiar percentage appears on screen as a rough model. Real feeding steps can be higher or lower. Stack those matching measurements, with producers at the bottom. The result is an energy pyramid. Each bar is narrower because only part became new tissue above.
The shape tracks energy flow, not the body size of any organism. Many small producers can support fewer large predators. A real food web adds branches. Menhaden eat phytoplankton and zooplankton. Striped bass also eat menhaden. An osprey's trophic level can change with the path you follow. The same accounting still works at every link. Follow arrows from each food to its eater. Return to the osprey. Its food energy began with producers capturing sunlight. Along the path, heat spread and other material moved toward decomposers. The energy was transformed, not destroyed. But at each feeding step, only the tissue branch became available to the next consumer.
That is why energy pyramids narrow even when the exact percentage changes. Use the rule before any shortcut percentage. At each step, only part becomes tissue the next level can eat.
From the film
- At each step, only part becomes tissue the next level can eat.
- Food-web arrows point from food to eater, following the energy.
- Heat, uneaten matter and undigested matter leave less energy in new tissue.
- About 10 percent is a rough model, not a fixed rule.
The first film showed the energy band narrowing at every feeding step. How much of the plankton’s energy ever reaches the osprey chick, and where does the rest go? The simulation turns that rule into numbers you can test.
The one idea: At each step, only part becomes tissue the next level can eat.
Where it applies: two neighboring feeding levels, compared with the same kind of measurement (here, new tissue) over the same area and time. The share varies, and uneaten matter can still feed decomposers.
What do you think? Decide before you read.
-
Scientists disagree: Carbon atoms are used again and again: decomposers return them to the water and air, and plankton take them up. Energy enters as sunlight and leaves as heat. Ecologists who measure whole ecosystems find energy passing through once, while the same atoms come back around.
What scientists think
Scientists disagree: Carbon atoms are used again and again: decomposers return them to the water and air, and plankton take them up. Energy enters as sunlight and leaves as heat. Ecologists who measure whole ecosystems find energy passing through once, while the same atoms come back around.
-
Scientists disagree: Careful measurements in physics and biology show that energy is never destroyed. It changes form. When a fish swims or an osprey keeps warm, the chemical energy in food is changed into motion and heat, and the heat spreads into the water and air.
What scientists think
Scientists disagree: Careful measurements in physics and biology show that energy is never destroyed. It changes form. When a fish swims or an osprey keeps warm, the chemical energy in food is changed into motion and heat, and the heat spreads into the water and air.
-
Scientists disagree: Biologists usually draw the arrow from the food to the eater, and this course does too. The arrow shows which way the energy and matter move. An arrow from menhaden to osprey means the energy in the menhaden goes into the osprey.
What scientists think
Scientists disagree: Biologists usually draw the arrow from the food to the eater, and this course does too. The arrow shows which way the energy and matter move. An arrow from menhaden to osprey means the energy in the menhaden goes into the osprey.
Explore: build an energy pyramid
In the simulation, producers capture sunlight falling on a patch of Bay water. You choose how many feeding levels sit above them and what share passes up each step, from 5 to 20 percent. The pyramid shows the energy and heat at each level, and a switch shows carbon returning through decomposers.
- Captured by producers (level 1)
- Top level reached
- Heat or uneaten, all steps added
- Heat or uneaten + top level
In this sketch the producers start with 100,000 kJ per square meter per year (a made-up number), every step passes the same share, and bar widths are not to scale. Real measurements vary: the lesson reports about 13 and 21 percent for Cedar Bog Lake and about 6 percent as the average of a 2026 synthesis.
Rule to keep: about 10 percent is a rough rule of thumb, not a fixed law. Energy flows one way, from sunlight to heat, and much is lost at each step, so each level has less. Matter such as carbon cycles and is used again.
Try this.
- Set the transfer to 10 percent and add a fourth level. Predict how much of the producers’ energy reaches the top, then test it.
- Change the transfer to 5 percent, then 20 percent. Predict which setting can support more levels, then compare the fourth level at each.
- Record the heat-or-uneaten values and the top-level value. Add them and test whether they equal what the producers captured.
- Turn on the carbon switch. Predict whether carbon and energy follow the same path, then watch.
Explain: who eats whom in the Bay
- ecosystem
- producer
- consumer
- decomposer
- trophic level
- food chain
- food web
- energy pyramid
- biomass
- biomass pyramid
An ecosystem is all the living things in an area and the nonliving environment they interact with, such as water, light and temperature. The Chesapeake Bay is one ecosystem. A single marsh inside it can be studied as another.
Living things in it get energy in three main ways. A few, such as some plankton, use more than one.
- A producer captures energy from sunlight and stores it in food. In the open water of the Bay, the main producers are phytoplankton, tiny algae and photosynthetic bacteria (cyanobacteria) that drift in the water. Underwater grasses are producers too.
- A consumer gets energy by eating other living things. A primary consumer eats producers. A secondary consumer eats primary consumers, and a tertiary consumer eats secondary consumers.
- A decomposer, such as many bacteria and fungi, gets energy from dead matter and wastes.
A trophic level is a feeding step: producers are the first level, primary consumers the second, and so on.
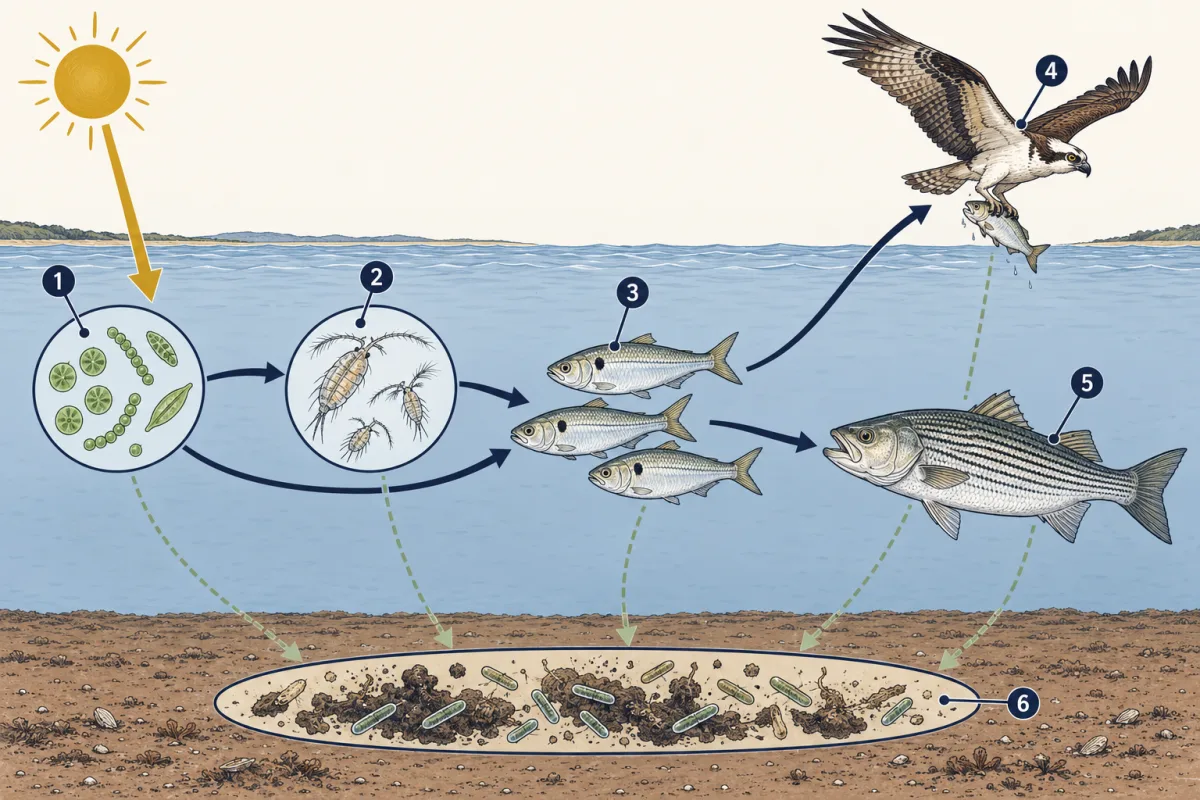
A food chain follows one feeding path. A food web links many food chains together. Arrows point from the food to the eater, the way the energy moves:
sunlight → phytoplankton → zooplankton → Atlantic menhaden → osprey
Zooplankton are small animals and single-celled consumers that drift in the water. Atlantic menhaden are small oily fish that filter both phytoplankton and zooplankton. Ospreys carry menhaden to their chicks, and striped bass eat menhaden too.
Predict. Menhaden eat phytoplankton directly on one path. What consumer level is an osprey that eats that menhaden?
Check your prediction
The menhaden is a primary consumer, so the osprey is secondary. With zooplankton in the path, the osprey is tertiary. A web shows this; a single chain hides it.
You will add bacteria and their recycling in Matter Cycles.
- phytoplankton
- zooplankton
- Atlantic menhaden
- osprey
- striped bass
- decomposers
- blank
- blank
- blank
- osprey
- striped bass
- blank
Word bank: Atlantic menhaden, decomposers, phytoplankton, zooplankton
- blank
- blank
- blank
- blank
- blank
- blank
Check your labels
- phytoplankton
- zooplankton
- Atlantic menhaden
- osprey
- striped bass
- decomposers
Explain: why each level gets less
Here is where the first film’s three branches come from. Phytoplankton store light energy in sugars by photosynthesis. When a zooplankton eats them, the heat comes from cellular respiration, the process that releases energy from food (Respiration and ATP). The parts that are not eaten, or eaten but not digested, mostly end up with decomposers.
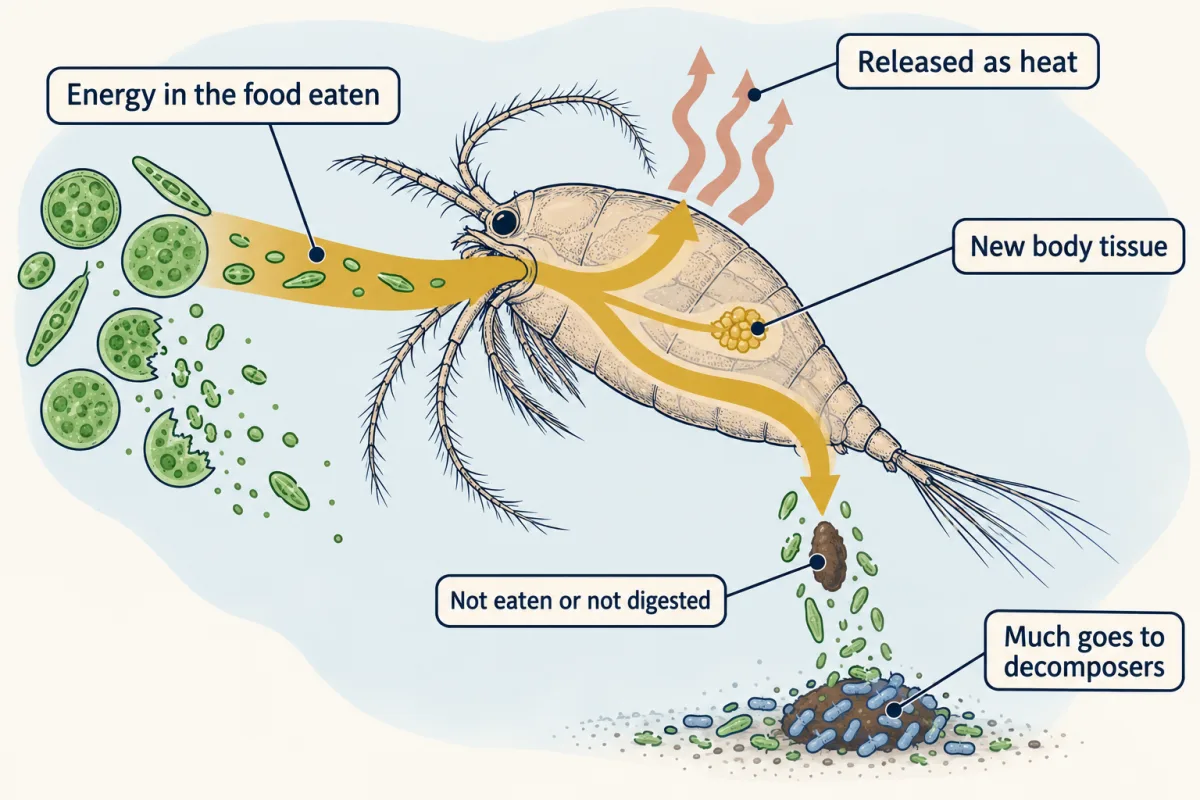
Energy transfer efficiency is the percentage of the energy at one trophic level that reaches the next. Both levels must use the same kind of measurement.
A common rule of thumb uses about 10 percent, but real measurements are often higher or lower. Use it first as a model. Suppose phytoplankton in a model patch of Bay add 100,000 kJ per square meter per year as new tissue.
Predict. If 10 percent becomes new tissue at each next level, how much reaches the osprey level after three steps?
Check your prediction
| Level | Calculation | New tissue energy (kJ per square meter per year) |
|---|---|---|
| Phytoplankton | given | 100,000 |
| Zooplankton | 100,000 × 0.10 | 10,000 |
| Menhaden | 10,000 × 0.10 | 1,000 |
| Osprey | 1,000 × 0.10 | 100 |
In this model, one-thousandth of the producers’ energy becomes tissue at the osprey level.
An energy pyramid stacks comparable energy measurements at each level, with producers at the bottom. It always narrows going up. A biomass pyramid stacks biomass, the mass of living things at each level, such as grams per square meter.
Predict. Could a biomass pyramid be upside down while its energy pyramid stays upright?
Check your prediction
Yes. Biomass pyramids usually narrow. But biomass is measured at one moment, while energy flow is measured over time. In the English Channel, phytoplankton divide and are eaten so quickly that zooplankton can outweigh them. Its energy pyramid stays upright.
A 2026 synthesis combined 2,052 estimates from 122 studies. It found an average energy transfer of about 6 percent, lower on land than in the sea. Because real values spread this widely, the simulation lets you try 5 to 20 percent. About 10 percent is a rough model, not a fixed rule. The shrinking supply is one likely reason food chains rarely have more than about five levels. Studies of lakes suggest that ecosystem size matters too.
The pyramid follows only the tissue branch. What happens to the heat and the leftover matter? The second film follows both.
Read the transcript of “Energy Flows, Matter Returns”
Film transcript: Energy Flows, Matter Returns
The energy pyramid followed only the tissue branch. What happens to energy that never becomes tissue for the next level? Return to the same Bay. Gold energy and green carbon now travel together, then separate. Sunlight enters the Bay as radiant energy. Phytoplankton change some into chemical energy in food.
Consumers change food energy into movement, new tissue, and red heat. Energy is never made or destroyed. It changes form as organisms live. Heat spreads through water and air. No living thing can capture that dispersed heat to build food again. The gold path moves forward and fades outward as red ripples.
Nearly every ecosystem needs a continuing energy supply. In the Bay, that supply is sunlight. A menhaden dies, and blue decomposers break it down. Can they return both its carbon and its usable food energy to phytoplankton? Hold both paths in mind.
Decomposers release much of the menhaden's green carbon as carbon dioxide. Phytoplankton can take that carbon up again. The green path closes into a loop. Energy does not. Decomposers also respire, so more chemical energy becomes heat and leaves the usable food pathway. Compare the maps. Carbon atoms pass through organisms, air, and water, and can be reused. Some may be buried or carried away. Energy enters, changes form, and disperses as heat.
Matter mostly cycles. Energy moves forward through this sunlit ecosystem. Not every ecosystem starts with sunlight. Some deep-sea vent communities begin with chemical energy. That changes the entrance, but energy still disperses as heat. The Bay picture has a clear scope, not a universal starting source. Ecologists test the picture with energy budgets. They compare neighboring feeding levels using matching measurements over the same area and time. Intake, new tissue production, and standing biomass are different measures. Mixing them makes a false transfer percentage. Transfer percentages vary among ecosystems and feeding steps.
Temperature, what gets eaten, digestion, and respiration can change the share reaching new tissue. That variation does not turn energy into a cycle. It changes how wide the next gold band becomes before the remaining energy disperses. Return to the osprey's fish. Its carbon may later enter decomposers, carbon dioxide, and phytoplankton again. Its energy can power movement or growth only before becoming dispersed heat. The same organism belongs to a matter loop and a forward energy path. Keep paths separate when reading any food web. Energy flows through ecosystems, while matter cycles and can be reused.
From the film
- Energy flows through ecosystems, while matter cycles and can be reused.
- Light energy becomes food energy, motion and heat.
- Decomposers return carbon to air and water, not usable energy to producers.
- Energy comparisons require matching measurements over the same area and time.
Explain: energy flows, matter cycles
The second film followed energy out of the Bay as heat and carbon back into phytoplankton, and noted that a few ecosystems, such as deep-sea vent communities, run on chemical energy instead of sunlight. The table sums up the contrast.
| Energy | Matter (such as carbon) | |
|---|---|---|
| Where it enters | sunlight captured by producers | already present in air, water and soil |
| What happens at each level | much is released as heat | atoms are passed on or released, not destroyed; some are buried or carried away |
| Path | one way | mostly a cycle, used again |
Elaborate: real energy budgets and osprey diets
Lindeman estimated how much energy each feeding level in a small Minnesota lake took in during a year. All three totals measure energy taken in, not new tissue. They include energy each level later released as heat in respiration, so they are larger than the new tissue each level built.
Predict. Using the table, what percentage passed from producers to primary consumers, and from primary to secondary consumers?
Check your prediction
Divide each level by the one below it. Producers to primary consumers is 14.8 ÷ 111.3 × 100, about 13.3 percent. Primary to secondary consumers is 3.1 ÷ 14.8 × 100, about 20.9 percent.
| Cedar Bog Lake level | Energy taken in (gram-calories per square centimeter per year) |
|---|---|
| Producers | 111.3 |
| Primary consumers | 14.8 |
| Secondary consumers | 3.1 |
Source: Lindeman, Ecology, 1942, corrected values in Tables II and IV, from about four years of study at Cedar Bog Lake. A gram-calorie is a unit of energy, about 4.2 joules. Lindeman printed 22.3 percent for the second step. That differs from the 20.9 percent these values give; rounding does not explain the gap, and the table does not say why.
Ospreys show that the menhaden link varies from place to place and year to year.
| Osprey sample (lower Chesapeake Bay) | Years | Menhaden share (%) |
|---|---|---|
| Lower-estuary nests, share of fish counted | 2006–2007 | 24.2 |
| Upper-estuary nests, share of fish counted | 2006–2007 | 1.5 |
| Lower-estuary nests, share of prey energy | 2006–2007 | 44.7 |
| Upper-estuary nests, share of prey energy | 2006–2007 | 4.5 |
| Mobjack Bay, mean of 7 nests | 1985 | 67.3 |
| Mobjack Bay, mean of 8 nests | 2006–2007 | 24.7 |
| Mobjack Bay, mean of 4 nests | 2021 | 30.2 |
Sources: the first four rows are from nest videos of 25 osprey pairs (Glass and Watts, Journal of Raptor Research, 2009). The last three are mean percentages of the diet, from fish recorded at nests, by Watts and colleagues, Frontiers in Marine Science, 2024.
Predict. At the lower-estuary nests, menhaden were 24.2 percent of fish counted but 44.7 percent of prey energy. Why might the shares differ?
Check your prediction
Fish differ in size and energy content. A smaller share by count can supply more energy. The table cannot show which difference caused the pattern.
- Compare the menhaden share by fish count and by energy at the upper-estuary nests too.
- How did the Mobjack Bay mean change from 1985 to 2021?
- Which comparisons describe a place, a year, or both? Why does that limit a broad conclusion?
Claim, evidence, reasoning
Make a claim that answers the essential question, using the Cedar Bog Lake data.
Start with: At each step of the food chain, blank of the energy reached the next level.
Start with: Producers took in blank gram-calories per square centimeter per year, and primary consumers took in blank, which is about blank percent.
Start with: The rest was blank, because organisms release energy as blank and some food goes to blank.
Compare with a model answer
At Cedar Bog Lake, only a small fraction of the energy reached each next level. Producers took in 111.3 gram-calories per square centimeter per year and primary consumers took in 14.8, about 13 percent. Secondary consumers took in 3.1, about 21 percent of the level below. Some of the rest was released as heat during respiration and some went to decomposers; in Lindeman’s full Table II, producers released 23.4 of their 111.3 as heat, and most of the remainder was plant and algal matter that was not eaten. Both percentages are higher than the 10 percent rule of thumb. Lindeman counted all the energy each level took in, including what it later released as heat, so his percentages are not measured the same way as the new-tissue share in the rule. Even so, the share varies from place to place, so the rule is only a rough guide. One limit: this is a single small lake studied over about four years before 1942, and the values are reconstructed estimates.
Saved in this browser only.
Design problem
Plan a study to test whether osprey chicks fed extra fish are more likely to survive to flying age. Name your variables, control, constants, sample size and how you protect the birds.
Saved in this browser only.
One way to do it
- Question: does extra food raise the share of nests that raise young?
- Independent variable: extra menhaden placed at the nest, or none.
- Dependent variable: whether each nest raises at least one chick to flying age, and how many.
- Control: nests that get no extra fish but are visited the same way.
- Constants: the same area and season, and nests that started with eggs at about the same time.
- Allocation: assign nests to groups at random. If some nests can only be control, as when boats cannot reach them, say so, because it could bias the result.
- Sample size: at least 15 nests per group, and repeat in more than one year.
- Ethics and safety: work under wildlife permits, keep visits short, and stay out of the nest during heat or storms.
- What results mean: higher success in the fed group supports food limitation at that site. It does not say why fish are scarce.
Evaluate: check your thinking
Only part moves up. The osprey chick’s energy began as sunlight caught by phytoplankton. At each feeding step, the rest spread as heat or stayed in matter for decomposers. Much of the carbon can cycle back to plankton, but the energy cannot.
Science practices you used: making predictions and testing them with a model, calculating percentages from a real data table, comparing samples from different places and years, planning a fair test with a control and random groups, and naming the limits of one study’s data.
Your notes
Select any text in the lesson to highlight it or add a note to it. Your highlights and notes are saved in this browser and collected in your notebook.
This browser is not letting the site save anything (a private window or strict privacy settings), so highlights and notes will be lost when you leave the page.
How we measure it
Video cameras at nests
A small camera above an osprey nest records the fish the adults bring to the chicks while it runs. Researchers identify and count the fish, then estimate the energy in each from its size and kind of fish.
Supplemental feeding experiment
Researchers give extra fish to some nests and not to others, then compare how many chicks survive in each group. A difference supports the idea that food was limiting the birds.
Energy budget of a lake
Measurements of how much energy each feeding level takes in, or builds into new tissue, in a year are turned into energy units for the same area. Dividing one level by the level below, using the same kind of measure, gives a transfer efficiency.
Where this lesson fits
Before thisReview first
- Respiration and ATPThis course · Lesson 5
You need cellular respiration from there to see why much energy leaves each level as heat.
- Capturing SunlightThis course · Lesson 4
You need how producers store sunlight as food energy from there to start the pyramid.
After thisStudy next
- Matter CyclesThis course · Lesson 31
It follows carbon and other matter as it returns to producers, the cycling side of this lesson's contrast.
Elsewhere on the siteFilms, simulations and method films in other courses
- A forest floor over five yearsSimulation · Life Science
The forest-floor simulation shows decomposers returning carbon while the sun keeps supplying energy, matching the energy-flows, matter-cycles idea.
- Set Up: Who Eats Whom?Film · Biology Together
It shows with picture cards and yarn how a hawk depends on grass through a chain of who eats whom.
Suggested by an AI model from the lessons themselves, then checked. How we use AI
Finish line
Test yourself
8 questions
Practice and MCAT-style, with explained answers.
Next · Lesson 31
Matter Cycles
How can rain falling on a farm help build a crab in the Chesapeake Bay?
Continue →