Ecology and Evolution · Unit 3: Environments and populations
Climate, Biomes and Environmental Variation
Rewritten on : new text, flashcards and film. Your notes and highlights stay, but the text around them may have moved.
The Amazon and the Sahara are both hot. Why is one a rainforest and the other a desert?
Pause when the reading reaches a film, and offer to play it. Saved on this device.
Watch the film now, or keep listening
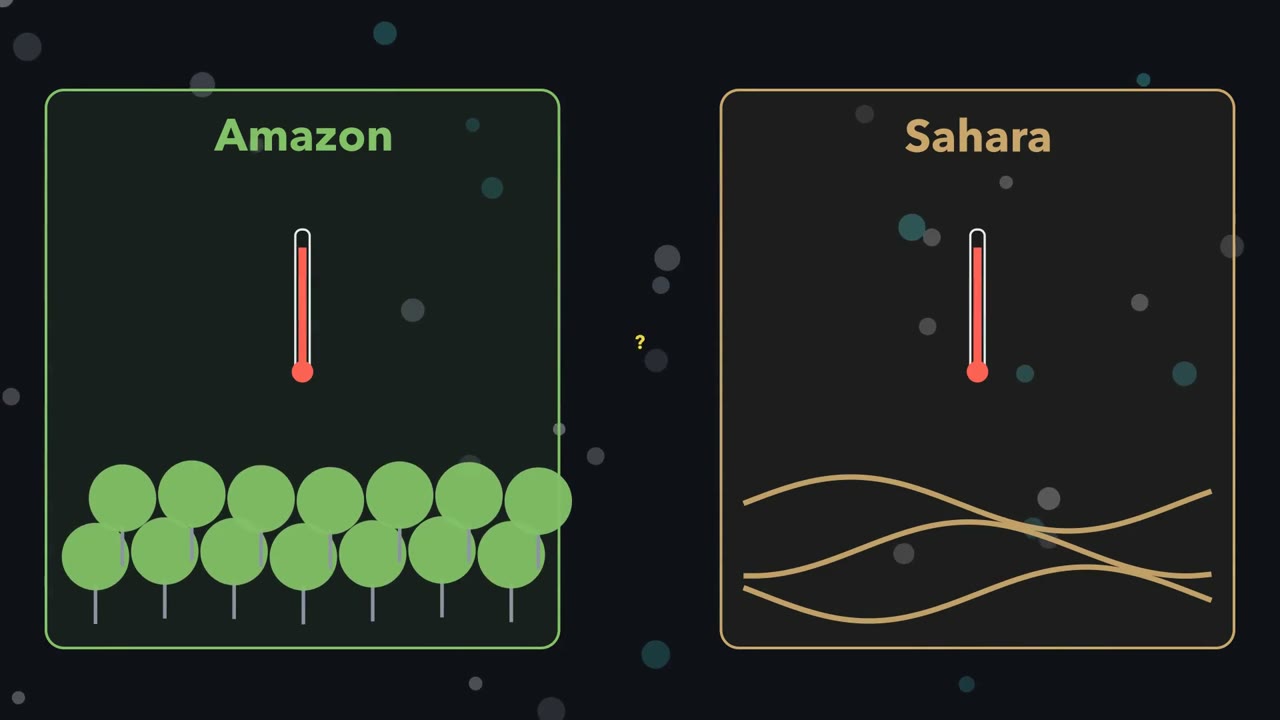 ▶ Watch Where the Rain Falls · 3:10
Read the transcript of “Where the Rain Falls”
Film transcript: Where the Rain Falls
The Amazon and the Sahara are both hot. So why is one a rainforest, and the other a desert? Each is a biome, a large region with similar climate and similar plants and animals. To guess a biome, ask two things of every month. How warm is it? How wet? Start with warmth. Shine a torch straight down at a table, and you get a small bright spot. Tilt it, and the same light spreads into a larger, dimmer oval. Sunlight does the same on a round Earth. Averaged over a year, it strikes the equator most directly, and the poles at a slant. So the tropics get the most energy per square metre, and the poles the least. But the Amazon and the Sahara get similar average warmth.
What differs is water, and moving air decides where it falls. Over the warm equator, moist air rises. As it rises, it expands and cools. Its water vapour condenses into cloud, and it rains. This is the equatorial rain belt. The air, now dry, flows toward the poles high up. Near 30° degrees north and south, it sinks back down. Sinking air is squeezed, and it warms. Warming takes it further from the point where its vapour condenses. So sinking air stays clear, and rain is rare. Many great deserts lie beneath it, the Sahara among them. So here is the first half of the rule. Rain falls where moist air rises and cools. It is scarce where air sinks and warms.
The rain belt does not stay put. Through the year, it shifts north and south. It roughly follows the overhead Sun, but lags behind it. Picture a town some way north of the equator, near the edge of that swing. Does it get rain all year, or only part of it?
Only part of it. The town is wet while the rain belt is overhead, and dry when the belt moves away. A wet season, then a dry one. Ecologists draw that on a climate diagram. Months run along the bottom. A red line shows temperature. A blue line shows rain. The scales are linked, so 10 °C sits level with 20 mm. When the blue line drops below the red, the month is read as dry. That is the second half of the rule. The warmer a month, the more rain it needs to count as humid. Read month by month, warmth and water give a first guess at the biome. A guess, not a final answer.
From the film
- Sunlight striking at a slant spreads over more ground, so over a year the tropics get the most energy per square metre and the poles the least.
- Where moist air rises it cools and drops rain; where air sinks it warms and dries, which is why many deserts lie near 30 degrees north and south.
- The rain belt shifts north and south through the year, roughly following the overhead Sun with a lag, giving many tropical places a wet season and a dry one.
- On a Walter-Lieth climate diagram, a month is read as dry when its rain in millimetres is below twice its temperature in degrees C.
- Monthly warmth and water give a first guess at a place's biome, not a final answer.
A biome is a large region with similar climate and similar dominant vegetation and animals: tropical wet forest, savanna (grass with scattered trees), desert, temperate grassland, chaparral, boreal forest, tundra.
The one idea. Rain falls where moist air rises and cools, and is scarce where air sinks and warms. The warmer a month, the more rain it needs to count as humid: on a Walter-Lieth climate diagram a month is read as dry when its rain, in millimetres, is less than twice its temperature in degrees C. Read month by month, warmth and water give a first guess at the biome.
Scope: broad biomes, from 30-year averages; not where any one species lives. The air rule is a broad-scale tendency: rising air rains only if it carries enough water vapour, and fronts and mountains make rain too. Fire, soils, the timing of rain and local microclimate can overturn the biome guess (second half of the lesson).
Weather is the state of the atmosphere at a given time and place; climate is its long-term pattern, summarized by convention as 30-year averages called climate normals.
Warmth: over a year, sunlight per square metre falls with latitude
The first film’s tilted torch has a number. The fraction of sunlight that reaches a horizontal surface is the cosine of the solar zenith angle, the angle between the Sun and the point directly overhead. With the Sun straight overhead, cos 0° = 1: all of it arrives. At 60 degrees from overhead, cos 60° = 0.5: the oval of light is twice as long, so each patch of ground gets half as much.
energy on a horizontal surface = energy on a surface facing the Sun x cos(zenith angle)
Worked problem A. At the top of the atmosphere, before air and cloud absorb or reflect any of it, a surface facing the Sun receives about 1,360 W m−2 (watts per square metre). With the Sun 60 degrees from overhead (roughly noon at latitude 60 degrees at an equinox), a horizontal surface receives 1,360 x cos 60 = 1,360 x 0.5 = 680 W m−2.
Day length matters too. At a solstice (June, December) one hemisphere leans furthest toward the Sun; at an equinox (March, September) day and night are about equal at most latitudes. The table’s point: on a midsummer day, long days at high latitude beat the slant; over a year they do not. Daily means at the top of the atmosphere, W m−2, for a tilt of 23.44 degrees and a constant Earth-Sun distance (computed):
| Latitude | Year-round mean | June solstice day | December solstice day |
|---|---|---|---|
| Equator | 415 | 397 | 397 |
| 30° N | 365 | 490 | 220 |
| 60° N | 236 | 492 | 24 |
| North Pole | 172 | 541 | 0 |
Over a year the tropics receive about 2.4 times what the poles do. That imbalance drives the air: the tropics gain more energy than they radiate away and the poles lose more, so the atmosphere and oceans carry heat poleward.
Predict. Earth is closest to the Sun in early January. If distance made the seasons, what would the two hemispheres both have in January? What actually differs between them?
Check your prediction
Both would have summer at once; instead their seasons are opposite. Earth’s axis is tilted about 23.4 degrees from the perpendicular to the plane of its orbit, so each hemisphere in turn leans toward the Sun, getting more direct light and longer days. That, not distance, makes the seasons. Distance changes sunlight by only about 7% between early January and early July; at 45 degrees north a midwinter day still gets only about a quarter of a midsummer day’s sunlight, distance included.
Water: where air rises and where it sinks
The first film’s sinking air dries because of a quantity it did not name: relative humidity, the water vapour present as a share of the amount that would saturate air at that temperature. Sinking air keeps its vapour but warms, so its relative humidity falls and cloud does not form. The Kalahari, like the Sahara, lies under this subsiding air.
The loop is the Hadley cell; at the surface, air flows from the subtropics back toward the equator. The idealized model adds a Ferrel cell in mid-latitudes and a polar cell at high latitudes. It is a cartoon: the real circulation is full of waves and eddies, and only the Hadley cell is driven directly by heating; the Ferrel cell is the averaged effect of mid-latitude storms.
The film’s swinging rain belt sets each place’s dry season, from none at some places near the equator to most of the year at its edges, and land and sea bend its path.
Earth’s rotation, through the Coriolis effect, deflects moving air and water to the right of their motion in the Northern Hemisphere and to the left in the Southern. It matters over hundreds to thousands of kilometres; it does not decide which way a sink drains.
Predict. In the Northern Hemisphere that surface flow heads south. Turned to the right, from which direction does it blow?
Check your prediction
Turning right from a southward heading points the air toward the west, so the wind blows from the northeast. These are the easterly trade winds. Air moving poleward in mid-latitudes is turned toward the east and becomes the westerlies.
Oceans and mountains bend the pattern
Winds, turned by Coriolis deflection, drive large surface currents that carry warm water from the tropics poleward and return cold water toward the equator. Density differences, set by temperature and salinity, help form deep water, which with winds, eddies and mixing sustains a slower deep circulation. Coasts beside warm currents are milder than their latitude suggests, and coasts beside cold currents are often cool and dry.
The popular claim that the Gulf Stream “keeps Europe warm” overstates the case: much of the winter contrast between western Europe and eastern North America comes from the atmosphere, although the ocean still moves a large share of heat poleward.
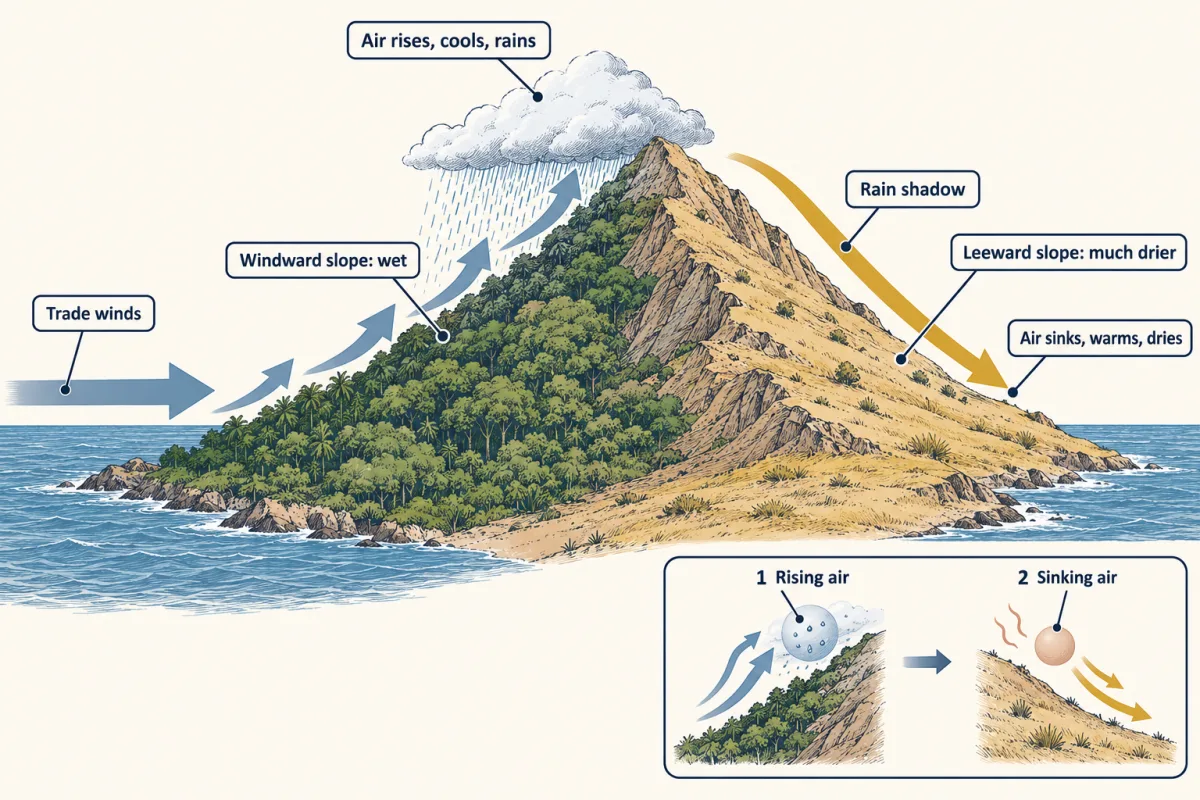
Mountains apply the same rule locally: the windward slope gets the rain, and the leeward side lies in a dry rain shadow.
Reading a climate diagram
Why does the film’s Walter-Lieth diagram draw the dry line at twice the temperature? The ratio is empirical, a marker of months dry enough to stress plants, not a measured water balance: potential evaporation, the water a wet surface would lose to the air, can be well above the line in a warm month (Going deeper). Always read the axis labels, the station, its elevation and the years averaged.
The Köppen-Geiger classification uses fixed thresholds and a letter code. It asks first whether a place gets too little rain for its warmth: it is arid (B) when its annual rain in mm is below 10 times a threshold that rises with mean annual temperature. In Beck and colleagues’ (2018) version, with MAT the mean annual temperature, the threshold is 2 x MAT + 28 when more than 70% of the rain falls in the warmer six months (April to September or October to March), 2 x MAT when more than 70% falls in the colder six, and 2 x MAT + 14 otherwise. A station that is not arid gets a temperature class, such as A (tropical: every month at least 18 degrees C), then that class’s own subtype rules. For class A the driest month decides: f, no dry month (at least 60 mm); m, monsoon; w, a marked dry season.
Worked problem B: station A. In this made-up data set, a lowland station has a mean temperature of 26 degrees C in every month. Mean monthly precipitation, January to December, is 140, 120, 150, 180, 200, 160, 140, 110, 90, 100, 130 and 160 mm. Assume these are 30-year means.
- Annual total. The twelve months sum to 1,680 mm.
- Dry period? At 26 degrees C the red line sits at 52 mm; the driest month, September, has 90 mm. Every month is humid: no dry period.
- Köppen-Geiger class. April to September holds 880 mm (52.4%), October to March 800 mm (47.6%). Neither half is warmer or holds more than 70%, so the “otherwise” threshold applies: 2 x 26 + 14 = 66, an arid cut-off of 660 mm, well below 1,680 mm: not arid. Coldest month 26 degrees C, at least 18: class A. Driest month 90 mm, at least 60: Af, tropical rainforest climate.
- Biome. Weak temperature seasonality and year-round rain fit tropical wet forest. That is a hypothesis to test against the vegetation present.
- Annual total
- Half-years (Apr–Sep / Oct–Mar)
- Threshold 2T + 14 (neither half-year has 70%)
- Arid cut-off 10 × threshold
- Coldest month ≥ 18 °C?
- Driest month ≥ 60 mm?
In this sketch: an invented station, the same temperature in every month, the lesson’s twelve monthly means scaled by one multiplier, so the half-year shares stay 52.4% and 47.6% and the 2T + 14 threshold applies. The precipitation axis is linear from 0 to 300 mm in this sketch; Walter’s own diagrams compress it above 100 mm, and the dry-month line here (at most 60 mm) lies below that.
Rule to keep: test aridity first, then the coldest month, then the driest month; the Walter-Lieth dry months (bars below the 2T line) are a separate, rule-of-thumb reading.
Keep station A’s average warmth, cut its rain by a third and crowd most of it into seven months, and the second film shows what the diagram says, and what it cannot.
Read the transcript of “Same Warmth, Two Answers”
Film transcript: Same Warmth, Two Answers
The first film built a rule. Rain falls where moist air rises, and warmer months need more rain to count as humid. Now test it on two made-up stations. Both average about 26 °C. What grows at each? Station A is the one you just worked. Its blue rain line rides above the red in every month. No month is dry. Its class is Af: tropical, with no dry month. That is a tropical rainforest climate. Station B has the same average warmth, though its months run from about 24 to 30 °C. But it gets about two thirds as much rain, and most of it falls from April to October. From November to March, the blue line drops below the red. Those five months fill with gold.
They are the dry season. Its class is Aw: tropical, with a marked dry season. That is a tropical savanna climate. The rule's first guess is grass with scattered trees. So far the rule gives two first guesses. Similar warmth, different rain, different climate classes. Now look at station B's rain once more. Staver, Archibald and Levin analysed tree cover across the tropics. They looked at places with about 1,000 to 2 ,000 and a half -thousand millimeters of rain a year. Those places also had a dry season shorter than seven months, by the study's own measure. There, tree cover was rarely in between. Places were mostly savanna, or mostly forest.
Station B's rain total falls in that range, and its diagram points to savanna. Would every place with a climate like that be savanna? No. In that window, savanna and forest were both found under similar climates. And fire was associated with keeping areas open. Where grass is open, fire can keep it open. A closed canopy can hold fire back. So each state may help keep itself going.
This is a pattern, not proof. Savanna and forest may be alternative states under similar climates. Whether those states are truly stable is still debated. So climate gives a first guess at the biome. Fire, soils, the timing of rain and microclimate can change the answer. A savanna climate does not guarantee a savanna.
From the film
- Two places with similar average warmth can get different first guesses at the biome because of how much rain falls and when.
- Station A has no dry month and a tropical rainforest climate (Af); station B has five dry months on its climate diagram and a tropical savanna climate (Aw).
- In Staver and colleagues' analysis, at about 1,000 to 2,500 mm of rain a year with a dry season shorter than seven months (by their own measure), tropical tree cover was mostly either savanna-like or forest-like, rarely in between.
- Fire was associated with keeping savanna open; the proposed feedback is that fire can keep open areas open and a closed canopy can hold fire back, so the two may be alternative states under similar climates.
- A savanna climate does not guarantee a savanna: climate gives a first guess, and fire, soils, rain timing and microclimate can change the answer.
Biomes are more than climate
The second film gave station B’s class without the arithmetic. Its temperatures, January to December, are 24, 26, 28, 30, 29, 27, 26, 25, 26, 27, 26 and 24 degrees C; its rain 5, 10, 30, 80, 150, 180, 200, 220, 160, 60, 15 and 5 mm.
Total 1,115 mm, mean 26.5 degrees C. April to September, the warmer half, holds 88.8% of the rain, so the threshold is 2 x 26.5 + 28 = 81 and the arid cut-off 810 mm: not arid. Coldest month 24 degrees C: class A. Driest month 5 mm, below 60 and below the monsoon (Am) cut of 100 − (annual total / 25) = 55.4 mm: Aw, tropical savanna climate.
Fire and alternative states. The film’s window comes from Staver, Archibald and Levin’s (2011) analysis of tree cover in tropical Africa, Australia and South America. Ecologists call the film’s pattern, tree cover rarely in between, bimodal. The study is correlational: it shows what occurs together, not cause, so, as in how to test an evolutionary explanation, keep pattern and mechanism apart. The study measured dry-season length its own way, not by the Walter-Lieth count, so station B’s 1,115 mm total falls within the study’s rainfall range, but its five Walter-Lieth dry months do not show that it lies inside the full window. The strength of the film’s fire feedback depends on local conditions. Whether these states are truly stable is still debated.
Soils. Water-holding capacity and nutrients differ under the same rain, so the same climate can support different vegetation.
Rainfall timing. Annual totals hide timing: a few large storms can soak deeper or run off, and long gaps can dry the topsoil. Whether timing alone changes the plants is a question for an experiment.
Design problem
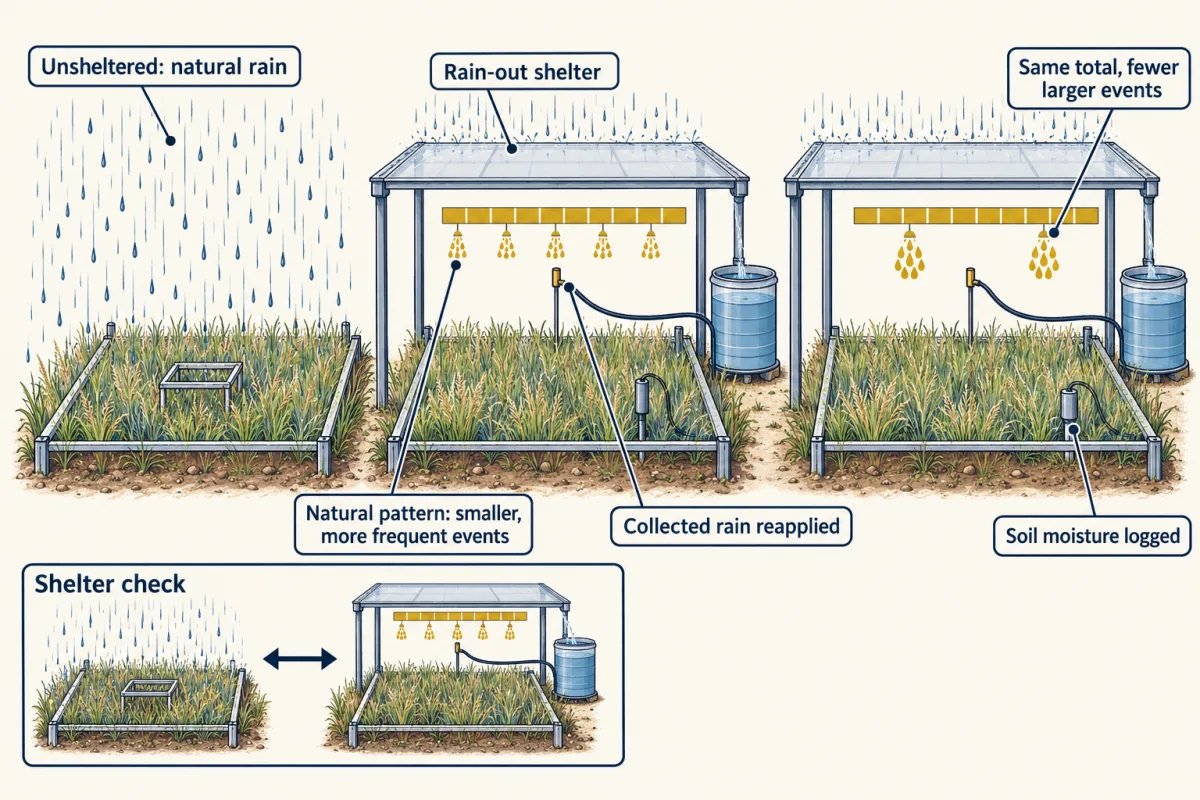
Two grasslands receive the same mean annual rainfall, but at one it comes in frequent small showers and at the other in a few large storms. Design an experiment to test whether rainfall timing, with the total held constant, changes plant production.
Saved in this browser only.
One way to do it
Comparing the two sites cannot separate timing from soils, species pools and history, so manipulate timing within one grassland. Build rain-out shelters over randomly assigned, replicated plots and reapply the rain by irrigation: the natural pattern on some, the same total in fewer, larger events on others. Unsheltered plots check that the shelters themselves (shade, warming) do not change the result. Log soil moisture to confirm the treatment made it more variable, and measure aboveground net primary production (new plant growth above the soil) and species diversity for several years, since one year’s weather can dominate. Knapp and colleagues (2002) did this for four years in a native mesic grassland, one with moderate rather than scarce rainfall. Fewer, larger events raised soil-moisture variability, lowered production and raised species diversity. The answer applies to that grassland.
Microclimate
Predict. A weather station sits in open ground, as stations normally do. A logger hangs beneath a forest canopy nearby. On a hot summer afternoon, which reads higher? In a cold spell?
Check your prediction
The open station reads hotter in the heat. De Frenne and colleagues (2019) compiled 714 paired temperatures beneath forest canopies and in nearby open habitat at 98 sites on five continents: understories averaged about 1.7 degrees C cooler in mean temperature and 4.1 degrees C cooler in maximum temperature, and canopies warmed the understory in cold conditions. The temperature an organism experiences is not the station’s.
Observation versus projection
Beck and colleagues (2023) reconstructed that about 5% of land outside Antarctica changed major Köppen-Geiger class between 1901 to 1930 and 1991 to 2020. Between 1991 to 2020 and 2071 to 2099 their models project 5% under the low-emission scenario SSP1-2.6, 8% under the middle scenario SSP2-4.5 and 13% under the high-emission scenario SSP5-8.5. The first is a reconstruction from observations; the projections are model results under stated scenarios. Neither is a biome change, which depends on dispersal, soils, fire and time.
Going deeper
Worked problem A, continued: the whole-planet average
Earth intercepts sunlight over a disk of area pi r2 but spreads it, through day and night, over a sphere of area 4 pi r2. The global mean is 1,360 / 4 = 340 W m−2, a top-of-atmosphere average; about 29% of incoming sunlight is reflected back to space.
Who explained the Gulf Stream’s share
Seager and colleagues argued in 2002 that the atmosphere carries much of the contrast: prevailing westerlies bring air warmed by heat the ocean stored over summer onto Europe’s west coast, and the large-scale wind pattern, shaped partly by the Rocky Mountains, brings cold continental air to eastern North America. Changes in Gulf Stream heat transport still affect Europe’s climate over decades.
Climate diagrams in practice
The current World Meteorological Organization standard period for normals is 1991 to 2020. Above 100 mm per month, Walter’s own diagrams compressed the rain scale, and ClimateCharts.net keeps the 1 degree C to 2 mm ratio only up to 100 mm. Thornthwaite’s potential evaporation at a steady 26 degrees C is about 125 mm for a standard 30-day month of 12-hour days, before the day-length corrections a real station needs: over twice station A’s 52 mm line. Actual evaporation is capped by the water available.
Plants of hot, dry biomes
In hot, dry biomes many plants use C4 or CAM photosynthesis, variations on the carbon fixation covered in the light reactions and the Calvin cycle.
Your notes
Select any text in the lesson to highlight it or add a note to it. Your highlights and notes are saved in this browser and collected in your notebook.
This browser is not letting the site save anything (a private window or strict privacy settings), so highlights and notes will be lost when you leave the page.
How we measure it
Walter-Lieth climate diagram
Mean monthly temperature and mean monthly precipitation are plotted on one chart, with 10 degrees C level with 20 mm. Months where precipitation falls below temperature are read as dry. Check the station, its elevation, the averaging period and the axis scaling, which differ among tools.
Köppen-Geiger threshold classification
A climate is assigned a class by a fixed sequence of rules on monthly temperature and precipitation and their seasonality: aridity first, then the temperature classes, then subtypes. Modern gridded versions report a confidence level with each class.
Rainfall manipulation with shelters
Shelters keep natural rain off field plots, and water is reapplied on a chosen schedule. This lets an experimenter change the size and spacing of storms while holding the total constant, separating rainfall timing from rainfall amount.
Paired microclimate logging
Temperature loggers are placed at the same time beneath a forest canopy and in nearby open ground. The difference between them measures how much the canopy buffers the temperatures organisms experience, compared with what a standard weather station reports.
Practice questions on this lesson (3) → MCAT-style, original, each with an explanation
Where this lesson fits
After thisStudy next
- Distributions, Niches and TolerancesThis course · Lesson 12
It takes climate and tolerance limits and asks where individual species can live, beyond the broad biome guess here.
- Diversity, Disturbance and SuccessionThis course · Lesson 19
It uses the fire and disturbance point from this lesson to explain how vegetation changes after disturbance.
- Global Change: Species on the MoveThis course · Lesson 24
It builds on the observed-versus-projected climate change distinction to ask how species ranges follow shifting climate.
Elsewhere on the siteFilms, simulations and method films in other courses
- Take a boat down the JamesSimulation · Life Science
Nonliving conditions such as temperature and rainfall help decide which living things can live where.
- Follow an atomSimulation · Biology
The rising and sinking air that brings or withholds rain also moves water between reservoirs.
Suggested by an AI model from the lessons themselves, then checked. How we use AI
Finish line
Test yourself
8 questions
Practice and MCAT-style, with explained answers.
Next · Lesson 12
Distributions, Niches and Tolerances
A dune plant was planted 60 km past its own range edge, and the planted population more than tripled. So what was stopping it?
Continue →