Ecology and Evolution · Unit 4: Interactions and communities
New to this? Review it at high school level: Microbes in Bodies and Ecosystems
Mutualism, Parasitism and Coevolution
Rewritten on : new text, flashcards and film. Your notes and highlights stay, but the text around them may have moved.
The same root fungus can help a plant in poor soil and cost it in rich soil. Is it a mutualist or a parasite?
Pause when the reading reaches a film, and offer to play it. Saved on this device.
Watch the film now, or keep listening
Builds on:How to Test an Evolutionary ExplanationNatural Selection in Ecological ContextPredation and Community EffectsWhy these?
 ▶ Watch The Net Decides the Sign · 3:36
Read the transcript of “The Net Decides the Sign”
Film transcript: The Net Decides the Sign
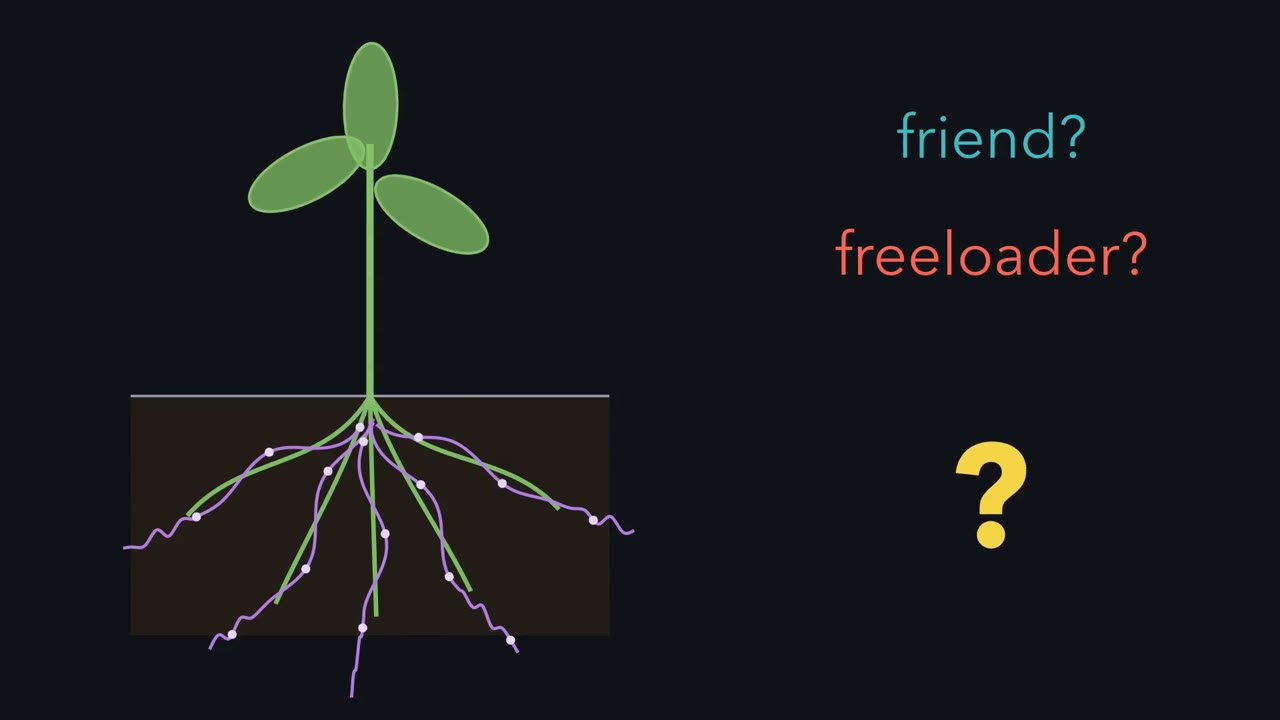
A fungus lives in a plant's roots. Is it a friend or a freeloader? You cannot tell by looking. So how would you find out? Measure each partner's fitness, its survival and reproduction. Then compare it with the same organism living without the partner. The difference is the partner's net effect. Picture a balance. On one side sits the benefit the partner brings. On the other sits the cost it takes.
Benefit minus cost is the net. The sign of that net names the interaction. Both partners gain: mutualism. One gains, the other shows no net change: commensalism. One gains, the other loses: parasitism. Now load the balance for a root fungus. The fungus takes carbon from the plant. That is the cost. It supplies soil nutrients, especially phosphorus. That is the benefit. In this sketch, phosphorus starts scarce, so the fungus's delivery is worth a lot. The benefit outweighs the cost. The plant's net is positive. Now add phosphorus until it is plentiful. Suppose the carbon cost stays the same. Where does the plant's net go?
The benefit shrinks, because phosphorus is no longer scarce. In this sketch, the net slides through zero. The same fungus now costs the plant. If the fungus still gains, the pair has moved from mutualism toward parasitism. Ecologists call this the mutualism-parasitism continuum. Where a pair sits depends on conditions. A net of zero needs care too. A large benefit and a large cost can cancel. A level balance can still be carrying heavy loads. The partner's own traits load the balance as well. Rhizobia are bacteria in legume root nodules, small swellings on the roots. They fix nitrogen from the air and take carbon in return. Now picture a strain that takes carbon but skips the fixing.
It could leave more offspring than an honest strain, and spread. What stops it? One answer is a host sanction. The host cuts the reproduction of rhizobia in nodules that do not fix. That puts a new weight on the cheater's cost side. Now let the partners evolve. A change in one shifts the other's balance, so selection on the other changes. If the other then evolves in response, that is coevolution.
Daniel Janzen set this standard. A good fit between two species is not the evidence. Change in both partners is. So an interaction's sign is not a label fixed to a species. Each partner's side is a net, measured against life without the partner. Conditions can move it.
From the film
- An interaction is scored by its net effect on each partner: benefit minus cost, compared with life without the partner.
- The sign follows the net, so the same root fungus can help a plant in poor soil and cost it in rich soil.
- A net of zero can hide a large benefit and a large cost that cancel.
- A partner that takes the reward and skips the service can be held back if the host cuts its reproduction enough, a host sanction.
- Coevolution means each partner evolves in response to the other; a good fit alone does not show it.
After the first film’s root fungus, this text covers what it left out: how far the continuum reaches, how a mutualism survives cheaters, and what it takes to show that two species shaped each other.
The one idea. Each partner’s side of an interaction is a net: benefit minus cost, measured against life without the partner. The interaction’s sign is the pair of those nets, so it can change when conditions, or the partner’s own traits, push a net across zero. When each partner evolves in response to the other, the two coevolve; pairing partners from different times is one powerful way to test for it.
Scope: fitness (survival and reproduction) in one environment, compared with the same organism without the partner. The rule is bookkeeping: it says what to measure, not which mechanism produces the benefit or the cost. “Reciprocal” means change in both partners; change in one partner while the other stays fixed is adaptation, not coevolution. Time-shift shapes are predictions of simple models: evidence, not proof. A difference across time shows that something changed. A treatment with one partner held fixed helps tell reciprocal feedback from one-sided adaptation, but showing coevolution still needs heritable change measured in both partners. These limits apply to every time-shift result below.
Signs are measured nets
Beyond the film’s sketch, the real case is an arbuscular mycorrhizal fungus, the most widespread kind of root fungus. Johnson, Graham and Smith (1997) argued that when the plant’s costs exceed its benefits, as can happen when nutrients are plentiful, the fungus might be considered parasitic from the plant’s side. Calling the whole pair parasitism also needs the fungus’s net to stay positive. Predation shares the parasite’s +,- sign but usually kills the prey outright.
Microbes sit on the continuum too. In early tests, Escherichia coli carrying the phage M13, a virus that infects without killing its host, grew faster and reached higher density than uninfected cells. Shapiro, Williams and Turner (2016) read this as a facultative mutualism, a helpful partnership the host can live without: a virus, usually filed as a parasite, scored as a partner.
Keeping a mutualism honest
A host sanction, the host cutting the fitness of partners that do not deliver, holds back the film’s non-fixing rhizobia only if the penalty outweighs what they save by skipping the work. The hard part is showing that a sanction exists.
Kiers, Rousseau, West and Denison (2003) tested this in soybean, Glycine max, with Bradyrhizobium japonicum. Comparing a fixing strain with a non-fixing one would be confounded: two strains differ at many genes, so the plant could be responding to any of them. They kept the strain and removed the service, replacing the nitrogen in the air around roots or single nodules with argon. Rhizobial reproductive success fell by about 50% in nodules that could not fix. Reduced oxygen supply to those nodules was implicated as a possible mechanism, not shown to be the cause.
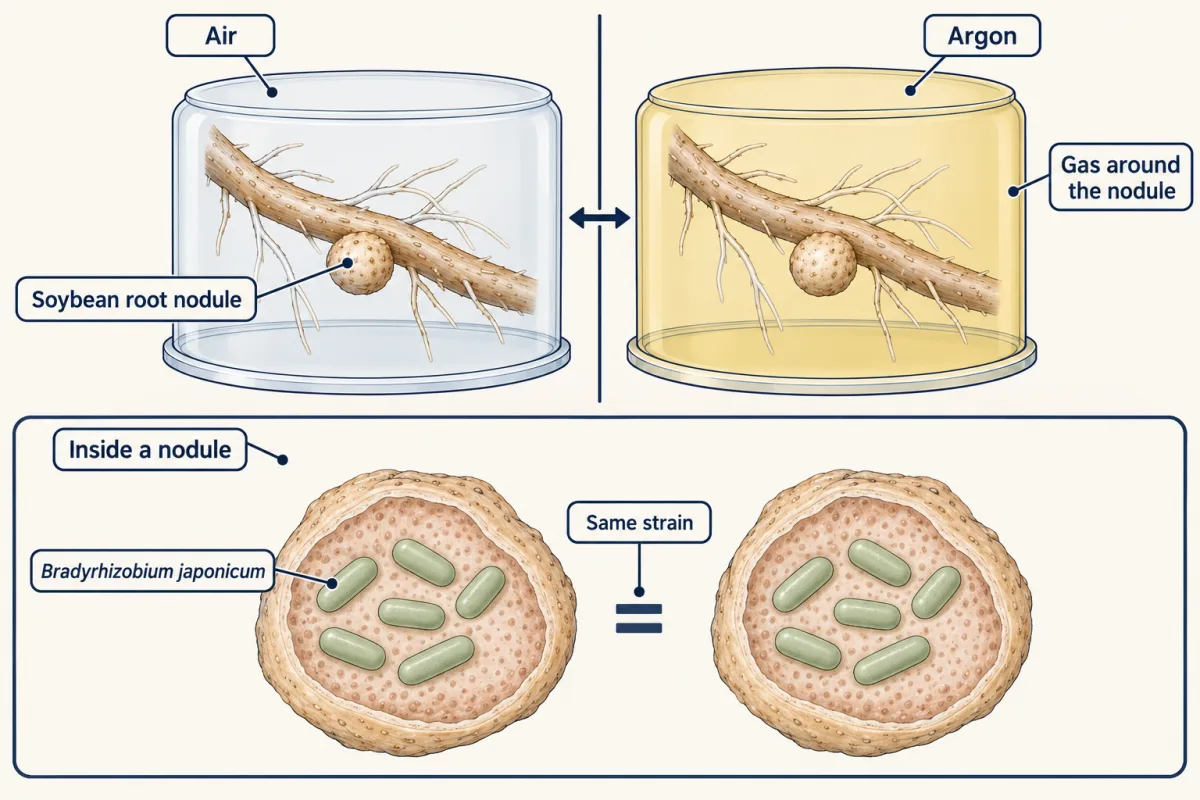
“Sanction” names a measured effect, not a decision: plants that cut the reproduction of rhizobia in non-fixing nodules, by whatever mechanism, leave fewer cheaters in the soil, and that effect is what selection can maintain.
Predict. Give a legume plenty of nitrogen fertilizer. Would you expect it to keep sanctioning rhizobia that do not fix?
Check your prediction
Probably not, and in one laboratory study it did not. Fronk and colleagues (2025) grew Lotus japonicus with fixing and non-fixing rhizobia. Under nitrogen fertilization the plants no longer discriminated between them, and they reduced their overall investment, making small nodules with fewer rhizobia. With nitrogen in the soil, the rhizobium’s service is worth less to the plant, the sanction on non-fixers is lost and, on this reading, a non-fixer’s net rises relative to a fixer’s.
When is it coevolution?
Daniel Janzen’s 1980 standard, from his note “When is it coevolution?”, asks for change in one partner, then a response in the other. It is strict because a good fit is easy to explain without coevolution. A fruit may suit a bird because the plant’s lineage evolved in response to other dispersers long ago, or because the bird happened to be able to use a fruit that was already there. Neither history is reciprocal.
In the one idea’s terms, each partner’s traits sit on the other’s balance. Hosts and parasites with short generations, such as bacteria and phages or water fleas and their microparasites, give some of the clearest tests, because they evolve quickly and can impose strong selection on each other. The second film shows how frozen samples from many times are paired and read.
Read the transcript of “Reading Evolution Across Time”
Film transcript: Reading Evolution Across Time
The first film scored each partner's side as a net. When both partners evolve, each resets the other's net. How can you see that? Take a bacterium and a phage, a virus that infects bacteria. Freeze samples of both every two weeks, to revive later.
Now cross them in a time-shift assay. Phages from one time meet hosts from the past, the same time and the future. If neither partner's heritable traits changed, every pairing should give about the same infection rate. A repeatable difference means at least one partner changed. The shape hints at how. First, an arms race. Host resistance and phage infectivity both rise, in repeated rounds. Take one phage from the middle of the series. Test it on past, same-time and future hosts. Which does it infect best?
The past hosts. This phage has never met the resistance that later hosts evolved. Infection falls from past hosts to future ones, and keeps falling as the gap grows. Fluctuating selection works differently. Whichever host type is common gets attacked most. Rare types then gain, and the advantage keeps shifting.
Phages track the common host type, so they tend to do best on hosts of about their own time. As the gap grows, infection rises and falls, with no long-run trend. So read the shape as evidence, not proof. A one-way trend points to escalation. A wave with no long-run trend points to tracking. Evolution can also act within a population cycle.
Picture a chemostat, a vessel with a steady inflow and a matching outflow. Rotifers graze on algae. In classical models, prey rise, predators multiply, prey crash, predators starve. Rotifer peaks trail algal peaks by about a quarter cycle. That delay, as a fraction of the period, is the phase lag. Takehito Yoshida and colleagues started the algae in two ways. A clone is a set of genetically identical cells. One clone cannot evolve by selection among clones.
Several clones can. One clone gave short cycles, close to the quarter lag. Several clones gave long cycles, with rotifer and algal peaks largely out of step. The algae carry their own balance. Defence against grazing costs them in nutrient competition. Many rotifers favour defence. Few rotifers favour fast growth.
These runs showed prey evolution changing population cycles. Predator evolution was not tested. So this is eco-evolutionary feedback, not shown coevolution. Pairing partners from different times reveals change. A trend points to escalation, a wave to tracking. Coevolution also needs heritable change in both partners, checked with controls.
From the film
- A time-shift assay pairs parasites with hosts from the past, the same time and the future; if neither partner's heritable traits changed, every pairing should give about the same infection rate.
- In an arms race, a parasite infects past hosts best and future hosts worst, and the difference grows with the time gap: a one-way trend points to escalation.
- In fluctuating selection, parasites do best on hosts of about their own time, and infection rises and falls as the gap grows: a wave points to tracking. Both shapes are evidence, not proof: coevolution also needs heritable change in both partners.
- In rotifer-alga chemostats, algae able to evolve gave long cycles with predator and prey peaks largely out of step, and defended algae were poorer competitors for nutrients.
- Those runs showed prey evolution changing population cycles, not coevolution: predator evolution was not tested.
Arms races, cycles and the length of the record
The film’s tracking is usually driven by negative frequency-dependent selection, whose arithmetic is in population genetics. Arms races need not run forever: escalation can slow or stop.
Predict. A lab samples a phage and its host for 20 weeks. In its time-shift assay, infection falls steadily from past hosts to future ones. Can it conclude that this is an arms race?
Check your prediction
Not yet. Under fluctuating selection, infection rises and falls with the time gap, and a record that covers only one slope of that wave also shows a steady fall. The length needed depends on the cycle, which is rarely known in advance. Long, densely sampled records with many replicate lines are what tell the two apart.
Real systems mix the two: in one bacterium-phage time-shift study most phages fitted frequency-dependent selection and some also showed directional selection (Betts and colleagues, 2014). Sequencing adds a second test, against phage on a host held at one genotype (Paterson and colleagues, 2010). Both are in Going deeper; phage biology is in bacterial and phage genetics.
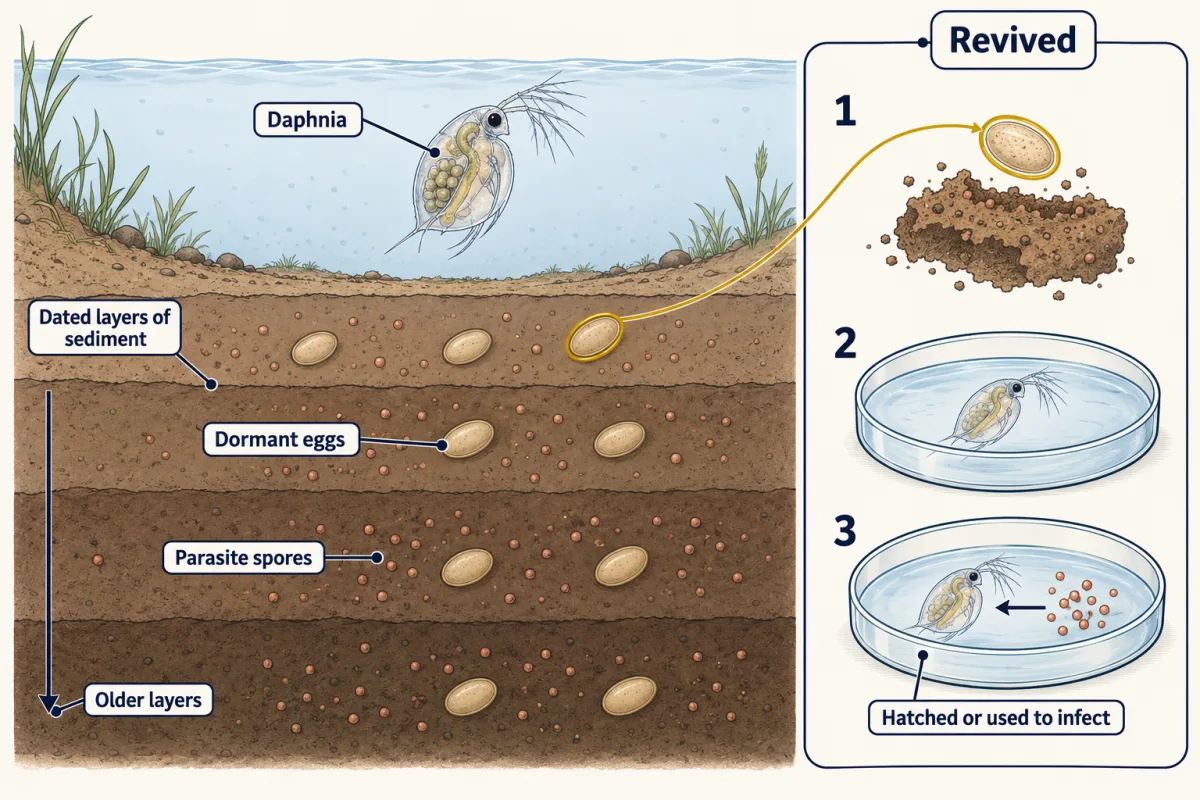
Decaestecker and colleagues (2007) used dormant Daphnia eggs and parasite spores from dated layers of pond sediment, a method called resurrection ecology. Parasites had adapted to their hosts within a few years, and virulence, the harm done to an infected host, increased through the record. In that Daphnia system the result ran against the common claim that parasites evolve toward harmlessness, though it comes from one host and one parasite. Myxoma virus in Australian rabbits is the classic field case: after its release around 1950 its virulence fell to intermediate levels, not to zero.
Rotifers and algae: evolution inside a population cycle
The second film’s chemostat runs come from Yoshida, Jones, Ellner, Fussmann and Hairston (2003): the rotifer Brachionus calyciflorus grazing the alga Chlorella vulgaris under nitrogen limitation, with the algae started as one clone or several.
Predict. Suppose a one-clone run had also given long cycles with peaks largely out of step. What would that do to the case that prey evolution caused the long cycles?
Check your prediction
It would undercut it. One-clone algae cannot evolve by selection among clones, so the long lag would need another cause, which could act in the multiclonal runs too. A long lag alone does not show that algae evolved; the causal case came from that design contrast and from a measured trade-off: algal clones that resisted grazing were poorer competitors for nutrients.
That trade-off closes a loop. Grazing favours defended clones; as they spread, edible food for rotifers falls; rotifers decline; with grazing relaxed, faster-growing undefended clones regain ground, and the cycle repeats. The loop is eco-evolutionary feedback: evolution changes population numbers, and the numbers change selection. It rests on the same kind of trade-off you met in competition, and the general case is in selection in an ecological context.
Design problem
You have frozen samples of a bacterium and its phage taken every two weeks for 20 weeks. Design a test that separates an arms race from fluctuating selection.
Saved in this browser only.
One way to do it
Revive hosts and phage from all 11 time points (weeks 0, 2, 4 up to 20). For each phage time point, challenge hosts from the past, the same time and the future, for example phage from week 10 against hosts from weeks 4, 10 and 16. Measure infection as the proportion of host colonies a phage lyses, with several colonies per host-phage pairing.
Predictions. Add the hosts’ side to the second film’s two shapes: under an arms race, hosts resist past phage best. Under fluctuating selection, infection shows a peak or a dip at or near contemporary hosts, depending on which partner is ahead.
Controls. Run several replicate lines, since one line could follow either path by chance. Sample long and densely enough to catch a reversal. Add Paterson’s constant-host treatment, phage evolving on a host held at one genotype, to help tell reciprocal change from phage-only adaptation. To claim coevolution, also show heritable change in both hosts and phage.
Going deeper
Worked problem: reading a phase lag from peak times
In classical models predator peaks trail prey peaks by about a quarter of a cycle, as the second film showed.
Worked problem. Here is an invented data set. Assume the cycles are regular, the period does not change during the run, and each predator peak is matched with the prey peak just before it. (In the real experiment the treatments did not share a period; here they do, to keep the arithmetic clean.)
- Run A: prey peak on days 10, 40 and 70; rotifers peak on days 17.5, 47.5 and 77.5.
- Run B: prey peak on the same days; rotifers peak on days 25, 55 and 85.
- Period. 40 - 10 = 30 days, and 70 - 40 = 30 days. The period is 30 days.
- Lag in run A. 17.5 - 10 = 7.5 days, so 7.5 / 30 = 0.25 cycle. That is the classical quarter lag.
- Lag in run B. 25 - 10 = 15 days, so 15 / 30 = 0.50 cycle. Predator peaks sit at prey troughs: antiphase, the far end of “largely out of step”.
phase lag (cycles) = delay between peaks (days) / period (days)
Drag the markers (or focus one and press the arrow keys; Page Up and Page Down move 5 days): P1 and P2 on two successive prey peaks, R on the predator peak just after P1.
▼ model lag ▲ your measured lag
- Model (expected)
- Your markers (observed)
In this sketch: regular cycles, a fixed period within each run, abundance in relative units (not to scale), and curves drawn from the lag alone. Runs A and B and the practice case are invented numbers, not Yoshida’s data; in the real experiment the two treatments did not share a period. The two cases are named in words only, because the lesson gives no numeric ranges.
Rule to keep: phase lag (cycles) = delay between peaks (days) / period (days), with each predator peak matched to the prey peak just before it. The lag alone does not prove that the prey evolved.
- Compare. The real single-clone runs came close to it, with a mean lag of 0.32 cycle (range 0.26 to 0.36). Run B’s 0.50 is antiphase, near the long multiclonal cycles, whose mean lag was 0.56 cycle (range 0.41 to 0.68). Run B resembles the evolving-prey runs.
Commensalism as a stable outcome
A commensal zero is a net, so small costs and benefits can cancel. Mathis and Bronstein’s 2020 review argued that commensalism can persist as a stable outcome rather than a waystation to something else.
Other root fungi
Ectomycorrhizal fungi on many forest trees mainly supply nitrogen rather than phosphorus.
The phage that stopped helping
Shapiro, Williams and Turner (2016) followed the M13 partnership through experimental evolution. After evolution in treatments that allowed both vertical and horizontal spread, the phage no longer helped the ancestral strain, even though the infected bacteria evolving alongside it grew fastest.
Scope of the soybean result
The roughly 50% fall in rhizobial reproduction belongs to soybean in that study, not to every legume.
Time-shift and sequencing details
The time-shift study of Betts, Kaltz and Hochberg (2014) used Pseudomonas aeruginosa PAO1 and six lytic phages (phages that burst the cells they infect), and five of the six gave patterns consistent with frequency-dependent selection, while two of the six also showed directional selection. Paterson and colleagues (2010) let the phage phi2 evolve with Pseudomonas fluorescens SBW25 or with a host held at a constant genotype. Sequencing showed faster phage molecular evolution, and more divergence between replicate populations, when the host coevolved. Both results apply to those laboratory populations and say nothing about phage therapy.
The worm, probiotic and phage-therapy bridge
For human health, these laboratory and field systems show mechanisms, not treatments. Pathogen variants that escape host defences, such as those in Toll-like receptor signalling and antigen receptors, can leave more descendants, which puts those defences under reciprocal selection. Experiments in the nematode Caenorhabditis elegans (Rafaluk-Mohr and colleagues, 2018) found that a mildly parasitic gut bacterium, newly paired with the worm, coevolved with its host toward a protective, mutually beneficial partnership when a pathogen was present. That is a worm result, not evidence for any human probiotic or phage therapy.
Your notes
Select any text in the lesson to highlight it or add a note to it. Your highlights and notes are saved in this browser and collected in your notebook.
This browser is not letting the site save anything (a private window or strict privacy settings), so highlights and notes will be lost when you leave the page.
How we measure it
Time-shift assay
Partners sampled at different times are crossed: hosts from one time point are challenged with parasites from the past, the same time and the future. A one-way trend that grows with the time gap suggests an arms race; infection that rises and falls as the gap spans a cycle, with no long-run trend, suggests fluctuating selection. A short record that covers only one slope of a fluctuating wave can look like an arms race, so sampling must be long and dense enough to catch a reversal.
Resurrection ecology
Dormant eggs and spores are recovered from dated sediment layers and hatched or used to infect, so that past host and parasite populations can be tested against each other and against present ones.
Clonal-diversity manipulation in chemostats
A prey population is started either as one clone, with no genetic variation for selection to act on, or as several clones. Comparing the population cycles of the two treatments tests whether prey evolution changes the dynamics.
Within-strain service manipulation
The same partner strain is made to stop providing its service, for example by replacing nitrogen with argon around rhizobial nodules. Any host response can then be tied to the service rather than to other genetic differences between strains.
Practice questions on this lesson (3) → MCAT-style, original, each with an explanation
Where this lesson fits
Before thisReview first
- How to Test an Evolutionary ExplanationThis course · Lesson 1
You need its test of whether a change counts as evolution before judging time-shift results here.
- Natural Selection in Ecological ContextThis course · Lesson 3
Its trade-offs and frequency-dependent selection are used here to explain tracking and defended-versus-fast-growing prey.
- Predation and Community EffectsThis course · Lesson 17
You need its predator-prey cycles and phase lags to read the rotifer-alga chemostat results.
After thisStudy next
- Nutrient CyclingThis course · Lesson 22
Root fungi and rhizobia supply plant nutrients, and this lesson shows how those nutrient flows move through ecosystems.
- Biodiversity and Ecosystem FunctionThis course · Lesson 23
Complementary species benefits, like partner exchanges here, help explain why diverse plots out-grow single-species plots.
Elsewhere on the siteFilms, simulations and method films in other courses
- Switch off a microbe groupSimulation · Biology
Switching off a microbe group shows what a plant loses without its root bacteria.
- Who Unlocks the Matter?Film · Biology
Soybean root nodules show bacteria that give the plant usable nitrogen, the mutualism tested here.
- Pair up two speciesSimulation · Life Science
Pairing species by what each partner gains or loses practises scoring an interaction's sign.
Suggested by an AI model from the lessons themselves, then checked. How we use AI
Finish line
Test yourself
8 questions
Practice and MCAT-style, with explained answers.
Next · Lesson 19
Diversity, Disturbance and Succession
Two plots hold the same four species. Can one be more diverse than the other?
Continue →