Ecology and Evolution · Unit 5: Ecosystem processes
New to this? Review it at high school level: Microbes in Bodies and Ecosystems, Matter Cycles
Nutrient Cycling
Rewritten on : new text, flashcards and film. Your notes and highlights stay, but the text around them may have moved.
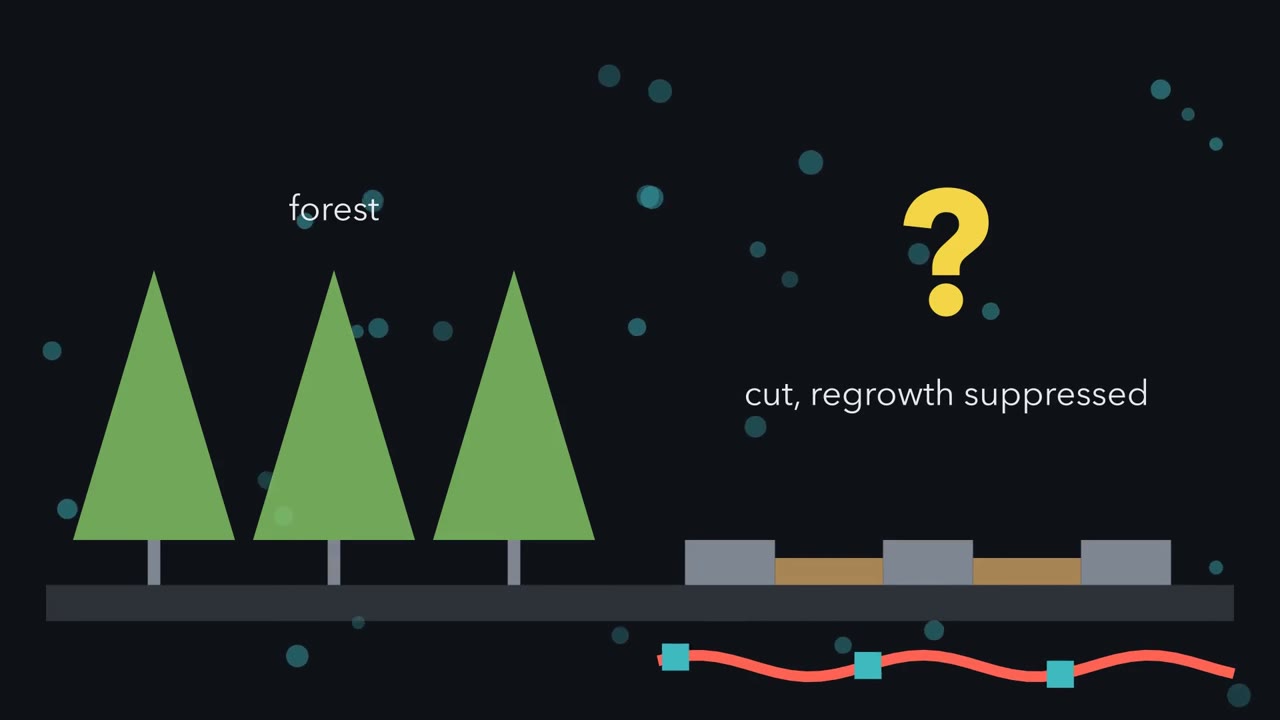
Cut a forest, leave the logs where they fall and keep it from growing back. Nobody adds fertiliser, yet its stream starts carrying far more nitrogen. Where does that nitrogen come from?
Pause when the reading reaches a film, and offer to play it. Saved on this device.
Watch the film now, or keep listening
Builds on:Energy Flow and ProductivityWhy these?
 ▶ Watch The Loop Inside the Line · 3:02
Read the transcript of “The Loop Inside the Line”
Film transcript: The Loop Inside the Line
Where does the nitrogen in a cut forest's stream come from? Cut a forest, keep it from growing back, and its stream carries far more nitrogen than before. Nobody added fertiliser, and the logs stayed where they fell. To find the source, keep accounts, the way a bank does. First, draw a line around the valley. Inside the line, nitrogen sits in pools, such as the soil and the trees. A pool is like a bank balance. A flux is a transfer, like a deposit or a withdrawal. Here nitrogen crosses the line in two ways. From the air, rain and snow deposit 8 kg per hectare each year. Microbes fix 6 more. It leaves in two ways. The stream carries 3 away, and microbes release 2 to the air as gas.
The store changes only by what crosses the line. Change in stock = inputs − outputs. This forest gains 9 kg of nitrogen per hectare each year. The line and the year must be stated before any adding. But most nitrogen never crosses the line at all. Decomposers release it from dead leaves as ammonium. Trees take it up, grow leaves, and drop them again. That loop moves about 90 kg per hectare each year. Here it is the biggest flux in the valley, far bigger than all the inputs together. Yet the counter never sees it. Nitrogen leaving one pool in the loop enters another pool inside the same line. In the sum, those transfers cancel. Cancelling is bookkeeping.
It does not mean the loop is small. Now cut the trees, and keep new plants from growing. Does the loop simply stop, or does it go somewhere? It goes somewhere. Decomposers keep releasing nitrogen, but no roots take it up. Microbes turn the extra ammonium into nitrate, which soil holds weakly. So the loop breaks open and spills across the line. Nitrate pours out in the stream, and the counter turns negative. Likens, Bormann and colleagues saw this at Hubbard Brook, in New Hampshire. The stream from their cut watershed carried far more nitrate and calcium than the uncut one. Rain brought in no more nitrogen than before. The forest's own recycled nitrogen was leaving.
A store changes only across its boundary, and here the broken loop crossed it.
From the film
- An element's store inside a boundary changes only by what crosses it: change in stock = inputs - outputs, for a stated boundary and interval.
- Inside a forest, decomposers and plants pass nitrogen round a loop that is often several times larger than all the inputs.
- That loop never crosses the boundary, so it cancels in the budget, yet here it is the largest flux.
- Cut the trees and stop regrowth, and decomposers keep releasing nitrogen that no plant takes up; much of it leaves in the stream as nitrate.
- At Hubbard Brook the stream from the cut watershed carried far more nitrate and calcium than the uncut one: the broken loop had crossed the boundary.
Nutrient cycling is the reuse of a limited supply of elements such as carbon, nitrogen and phosphorus. The first film kept one forest’s nitrogen accounts.
The one idea. A store of an element changes only by what crosses its boundary: change in stock = inputs − outputs. Inside, decomposers release the element and plants take it up again. That loop can be several times larger than all the inputs, yet it cancels in the sum. The store grows while inputs exceed outputs and shrinks while outputs exceed inputs. Break the loop, and part of its large flow can cross the line: stores change only across the boundary, and a broken loop can cross it.
Pools, fluxes and residence time
A pool (or stock) is the amount of an element in one compartment at one time, in mass per area (kg N per hectare). A flux is a transfer between pools, or across the boundary (the line that decides what counts as inside), in mass per area per time: kg N ha⁻¹ yr⁻¹, where the −1 exponent reads as “per”.
change in stock = inputs − outputs (for a stated boundary and interval)
residence time = stock / flux through the pool
Residence time is the average time an atom spends in a pool when inflow and outflow balance. This is the mass balance from energy flow, except that energy leaves as heat while atoms are reused.
Worked problem. Use the first film’s invented watershed (one stream; boundary from canopy to bedrock; fluxes in kg N ha⁻¹ yr⁻¹; steady rates; water and its dissolved nitrogen leave only by the stream). Its net gain of +9 kg N ha⁻¹ yr⁻¹ (inputs 14; outputs 3 by the stream and 2 by denitrification) is stored in wood and soil.
- How long does an atom stay? The soil organic N pool is 4,500 kg N per hectare, and gross mineralisation (decomposers releasing organic N as ammonium) is 90 kg N ha⁻¹ yr⁻¹. Residence time = 4,500 / 90 = 50 years, the average wait before decomposers release an atom. That assumes the pool is near balance: the +9 is a whole-watershed gain, and the budget does not say how much of it reaches the soil, so 50 years is an estimate. That loop is about six times the watershed’s inputs (90 / 14 = 6.4).
- Disturbance. Cut the forest and suppress regrowth. Suppose stream export rises to 40 while the other terms stay fixed (an assumption; gas losses could rise too). Outputs = 40 + 2 = 42, and change = 14 − 42 = −28 kg N ha⁻¹ yr⁻¹, a net loss.
Predict. Mineralisation keeps running at about 90. If all the extra stream nitrogen came from that loop, roughly what share of the loop is now leaking out?
Check your prediction
About two fifths: export rose by 40 − 3 = 37, and 37 / 90 = 0.41. That rests on the assumption; a bulk budget cannot tell which atoms left.
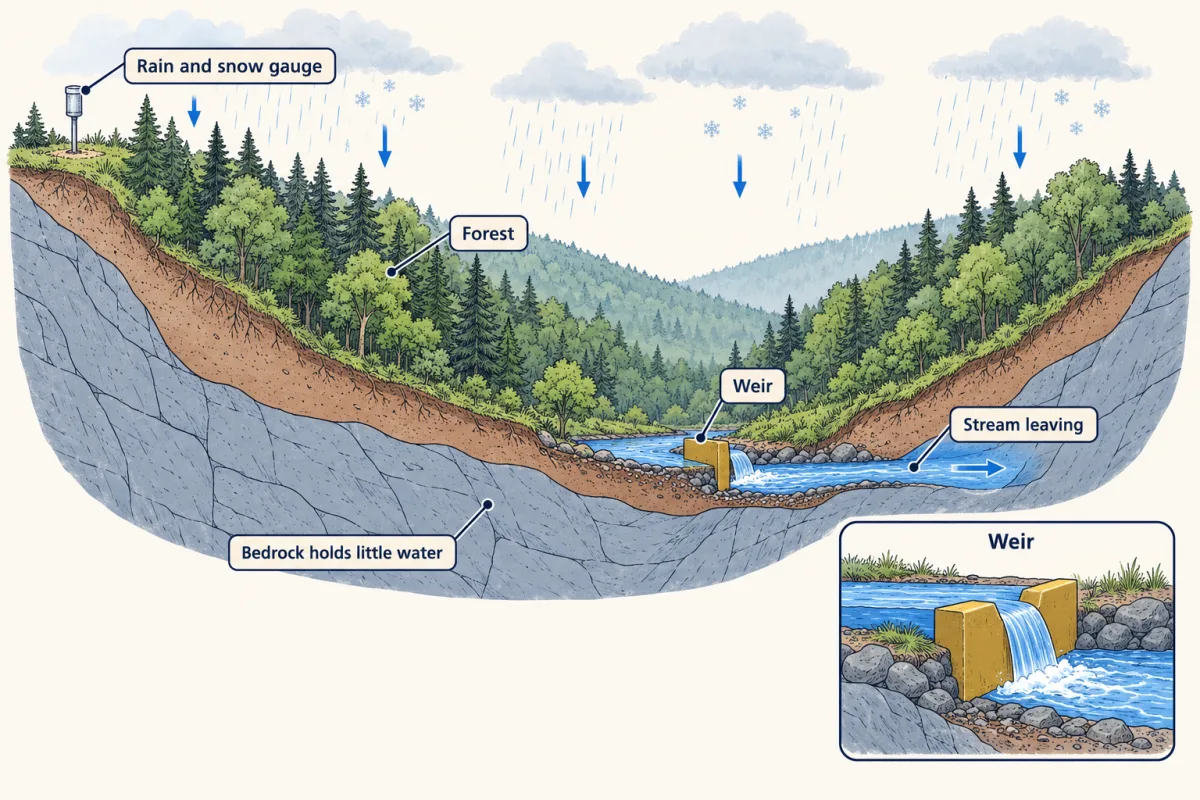
The invented rise shows the direction of the real Hubbard Brook result (Likens, Bormann and colleagues, Ecological Monographs, 1970), not its size. Their small-watershed approach used valleys on watertight bedrock that lets little water seep deep, so a weir (a low dam with a notch that gauges stream flow) measured nearly everything leaving in liquid water. The felled trees stayed on site and herbicide kept regrowth down, so plant uptake fell sharply with no nutrients carried off in wood; an uncut watershed was the reference. Cutting and herbicide also changed drainage, soil temperature and moisture, and microbial activity, so the result is their combined effect, not uptake loss alone. Nitrate is a negative ion and drainage water stays electrically neutral, so positive ions (cations) such as calcium leave with it; and with few leaves, little water returns to the air by transpiration (evaporation from leaves), so more drains through.
- Inputs | outputs
- —
- Change in stored N = inputs − outputs
- —
- Soil pool residence time = stock / flux
- —
- Mineralisation / external inputs
- —
- Internal-loop check: mineralisation 45 | 90 | 180
- —
In this sketch: an invented watershed, boundary from canopy to bedrock; rates hold steady through the year; water, with its dissolved nitrogen, leaves only by the stream; denitrification is held at 2, the soil organic N pool at 4,500 and gross mineralisation at 90; all fluxes are kg N ha⁻¹ yr⁻¹. The 45 and 180 in the check are halved and doubled values, in this sketch. The sketch shows the logic of a budget, and the invented rise in export shows the direction of the Hubbard Brook result, not its size.
Keep the rule: change in stock = inputs − outputs for a stated boundary and interval. Mineralisation is an output of the soil pool and an input of the plant pool, so it cancels in the whole-watershed sum, even when it is the largest flux.
Scope. A budget covers one element, one boundary and one interval, stated before any adding; where the line goes decides which transfers are inputs and outputs. The rule is accounting: it shows that a store changed and through which boundary flux, not which process controls the system. That needs a causal test, most directly, at this scale, a whole-ecosystem experiment like this one.
The carbon cycle: fast exchanges laid over slow stores
The large pools of carbon outside carbonate rock are the ocean, the atmosphere, living plants, soil and fossil fuels. Two biological fluxes dominate the fast exchange between them. Photosynthesis by plants and phytoplankton moves CO2 into organic matter (the Calvin cycle has the chemistry). Respiration by plants, animals and decomposers returns it as CO2; on land, plants respire roughly as much as decomposers do (oxidative phosphorylation has the mechanism). In the Northern Hemisphere the two run out of phase: atmospheric CO2 falls each summer, when photosynthesis outpaces respiration, and rises each winter.
The ocean exchanges CO2 with the air across its surface; dissolved CO2 forms bicarbonate and carbonate, so the ocean holds far more carbon than the air. Fossil carbon is organic matter buried over millions of years.
Predict. Draw the boundary around the fast cycle (air, ocean, plants, soil). Is burning fossil fuel an internal transfer or a boundary flux?
Check your prediction
A boundary flux. Left alone, fossil carbon is a pool with almost no outflow; burning it opens a large flux from a slow pool into the fast ones. Photosynthesis and respiration, however large, stay inside the line.
The nitrogen cycle: microbes run most of the transformations
The atmosphere is about 78 percent N2, but its triple bond puts it out of reach of most organisms. Most of the microbial transformations are redox reactions: they move electrons (oxidation removes them, reduction adds them). Nitrogen’s oxidation state runs from −3 in ammonium through 0 in N2 to +5 in nitrate. Five classic steps:
- Fixation reduces N2 to ammonia, using the enzyme nitrogenase. Some bacteria and archaea do it, free-living or in symbioses such as rhizobia in legume root nodules. Lightning and fertiliser manufacture also fix nitrogen.
- Ammonification releases ammonium from organic nitrogen as decomposers break down dead matter, with no change in oxidation state (amino-acid nitrogen is covered in protein turnover and amino acid catabolism).
- Nitrification oxidises ammonia through nitrite to nitrate and requires oxygen. The textbook version uses two groups: ammonia oxidisers (bacteria, and archaea such as the marine isolate Könneke and colleagues reported in 2005) and nitrite oxidisers.
- Denitrification reduces nitrate or nitrite, in low-oxygen soils and sediments, to gases that can include NO, N2O and N2.
- Leaching carries nitrate in drainage water to streams and rivers; it is transport in water, not a reaction.
Which steps cross the boundary depends on where the line is drawn. For the watershed line, fixation is an input; denitrification and the nitrate leaving at the stream outlet are outputs; ammonification, nitrification, plant uptake and litter fall stay inside as the loop.
Two discoveries have added to that list. One is anammox (anaerobic ammonium oxidation), which joins ammonium and nitrite into N2 without oxygen, another gas output:
NH4+ + NO2− → N2 + 2 H2O
First described in wastewater bioreactors, anammox was found by Kuypers and colleagues in the Black Sea, just below the layer of water that still has oxygen, and has been measured in marine sediments: in some oxygen-poor waters and sediments, denitrification is not the only biological route back to N2. The other is comammox: Nitrospira bacteria that carry out complete ammonia oxidation to nitrate within one organism, so the two chemical steps of nitrification need not belong to two organisms.
Phosphorus: the element no microbe can fix
Phosphorus has no major gas, so no organism can pull it from the air as nitrogen fixers pull N2. It enters ecosystems mainly as phosphate-bearing rock weathers, and much of it ends in marine sediments; over geological time, uplift of those sediments is the main route back to land (seabirds and fish that migrate from the sea up rivers return a smaller amount). In soil, phosphate binds to mineral surfaces and comes off again (sorption and desorption), microbes store some in their biomass and free phosphate from dead matter with enzymes called phosphatases, and plants take up the dissolved form, orthophosphate. Every nucleotide carries it (nucleotide metabolism). Dust and smoke do carry some through the air on particles (Going deeper).
In budget terms, with the boundary drawn around a lake’s water and its sediments, its phosphorus and nitrogen both rise only when inputs exceed outputs, and phosphorus released from sediment is an internal transfer (around the water alone, it would be an input). But nitrogen has an input phosphorus lacks: fixation from the air. A nutrient is limiting when adding it on its own increases production, and a lake rich in nutrients and dense with algae is eutrophic. Which input sets a lake’s algae? David Schindler tested it on whole lakes.
Read the transcript of “Two Halves of One Lake”
Film transcript: Two Halves of One Lake
Phosphorus has no major gas, so no microbe can fix it from the air. Nitrogen can be fixed by microbes. So when a lake turns green with algae, which input should you cut, nitrogen or phosphorus? Both elements reach a lake as inputs, such as inflowing water, dust and fertiliser. Only nitrogen has a second kind of input, fixation from the air by microbes. Which one sets how much algae a lake can hold? David Schindler was invited to lead whole-lake experiments in northwestern Ontario. Small lakes were set aside, so whole ecosystems could be changed and watched for years. Short tests in bottles can miss slow changes, like a rise in nitrogen fixation.
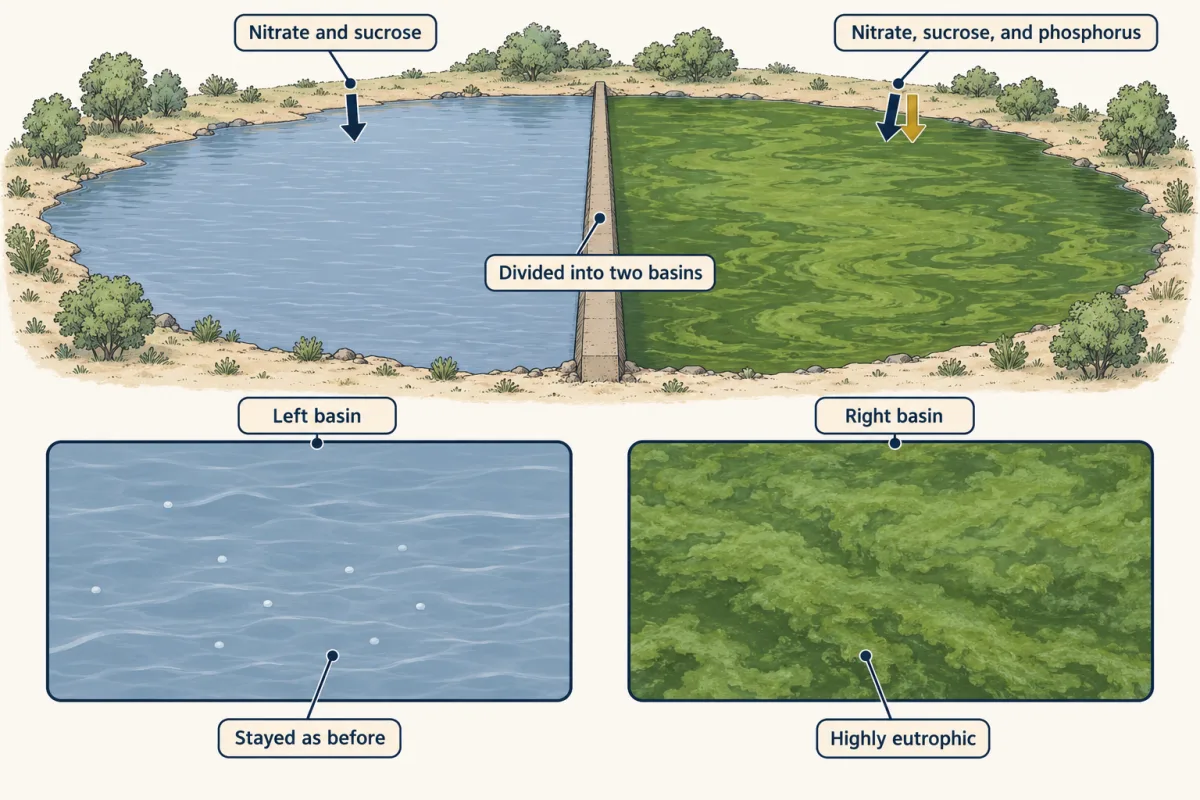
Lake 226 was divided by a barrier into two basins. Both basins received nitrogen, as nitrate, and carbon, as the sugar sucrose. One basin also received phosphorus. The other got none. So the only difference in what each half was given was that one element. Both halves had plenty of nitrogen and carbon to work with. Only one had phosphorus. Which half turns green?
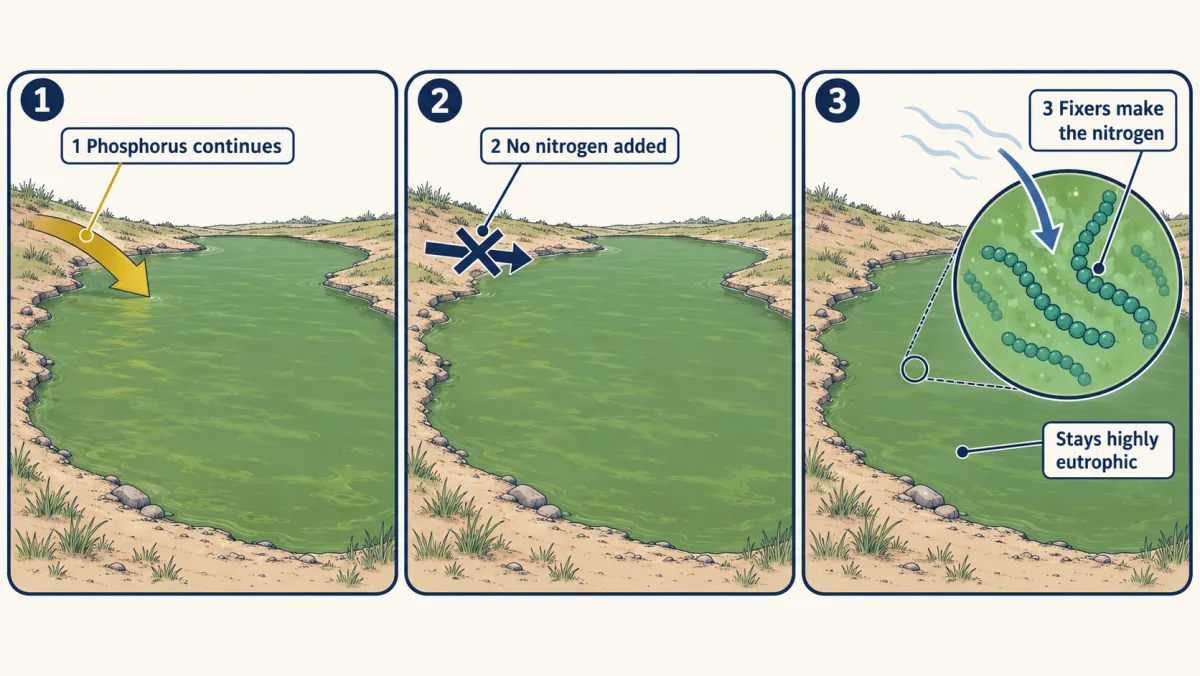
Only the phosphorus basin. It became highly eutrophic, rich in nutrients and dense with algae. The other basin stayed as it had been. So in that lake, with nitrogen and carbon plentiful, phosphorus limited the algae. A nutrient is limiting when adding it on its own raises production. Lake 227 was fertilised with both nitrogen and phosphorus for years. Then the nitrogen fertiliser stopped. The phosphorus kept coming. With its nitrogen input cut, you might expect the algae to fade. They did not. Cyanobacteria that fix nitrogen took over. They fixed nitrogen from the air, an input that kept coming after the fertiliser stopped. Its rate can still respond to phosphorus supply and other conditions.
The lake stayed highly eutrophic, year after year. Algae stayed as abundant as the phosphorus allowed. Fixation had made up the missing nitrogen. These are small lakes in Ontario, and one lake is not a replicate. Other lakes, and many estuaries, can respond to nitrogen. And production is often co-limited, rising only when both nutrients are added together. So in these lakes, phosphorus supply set how much algae the lake could hold. Fixers can make up missing nitrogen. No microbe can fix phosphorus.
From the film
- In Lake 226 both basins received nitrogen and carbon, but only the basin that also received phosphorus became highly eutrophic.
- In Lake 227, nitrogen fertiliser stopped in 1990 while phosphorus continued, and the lake stayed highly eutrophic.
- Nitrogen-fixing cyanobacteria took nitrogen from the air and made up the nitrogen that was no longer added.
- No microbe can fix phosphorus from the air, so in these lakes phosphorus supply set how much algae the lake could hold.
- These are two Ontario lakes; other lakes and many estuaries can respond to nitrogen.
What the second film left out
Lake 227 was fertilised from 1969, and Schindler and colleagues’ 2008 analysis covers 37 years, the last 16 (1990 to 2005) with phosphorus alone.
Two nutrients co-limit production when it rises only if both are added together, a common result in nitrogen and phosphorus addition studies. On land, a 2020 synthesis of field phosphorus-addition experiments found significant phosphorus limitation in many natural ecosystems and croplands, including outside the tropics (numbers in Going deeper).
What a budget can and cannot show
Every result above rests on the one rule: a store changes only by what crosses its boundary. So a budget is only as good as its measured fluxes.
Worked check. Global Carbon Budget 2024 estimated, for 2023, emissions E = 11.1 ± 0.9 GtC yr⁻¹ (gigatonnes of carbon per year), atmospheric accumulation A = 5.9 ± 0.2, ocean sink O = 2.9 ± 0.4 and land sink L = 2.3 ± 1.0 (± one standard deviation, a measure of uncertainty). The residual is:
B = E − A − O − L = 11.1 − 5.9 − 2.9 − 2.3 = 0.0 GtC yr⁻¹
Predict. The residual is zero. Does that show every term was measured well?
Check your prediction
No. The zero comes from rounding (the unrounded source figure is about −0.02), and the land sink alone is uncertain by ±1.0, nearly half its value and far more than the residual. Errors in two terms could cancel and still give zero.
Budgets often fail to close. Four common reasons:
- Unmeasured fluxes. N2 lost by denitrification is hard to detect against an atmosphere that is mostly N2. Rock can be an input: weathering of nitrogen-rich mica schist supplied nitrogen at forest sites in the Klamath Mountains.
- Sampling frequency and record length. Li and colleagues (2019), subsampling a daily watershed record, found that the uncertainty of estimated nutrient export depended on how often samples were taken. In a mid-latitude hardwood forest, Melillo and colleagues (2017) found that over 26 years of soil warming, phases of carbon loss alternated with phases of no detectable loss. A short record would have misled.
- Tracer bias. Adding 15N2 (N2 made with the heavy isotope 15N, so it can be traced) as a gas bubble, which does not fully equilibrate with water, can underestimate nitrogen fixation (Mohr and colleagues, 2010).
- Compensating errors, as in the carbon check above.
Design problem
A lake manager has a different lake with summer algal blooms and wants to know whether to control nitrogen or phosphorus. Using the two designs from the second film, plan the test, and say what it can and cannot show.
Saved in this browser only.
One way to do it
Manipulate the whole lake: bottle experiments miss slow responses such as rising nitrogen fixation, nutrient release from sediments or changes in grazing. Collect years of pre-treatment data on it and on an untreated reference lake, then divide it, as in Lake 226. Measure chlorophyll (the green pigment, a proxy for the amount of algae), dissolved and total nitrogen and phosphorus, phytoplankton species, and nitrogen fixation (with 15N2 dissolved in water beforehand, not added as a bubble).
Read the results as the films did. If fixation rises after nitrogen is cut, as in Lake 227, controlling nitrogen alone may fail in that lake.
Limits: one lake is not a replicate, so repeat across lakes; and the result applies to small Ontario lakes and may differ in estuaries and other lakes.
Going deeper
Dates and discovery chronologies
The Hubbard Brook watershed was cut between 18 November and 31 December 1965, and herbicide kept regrowth down for the next three growing seasons.
Kuypers and colleagues published the Black Sea anammox result in 2003. In 2015 two groups, van Kessel and colleagues and Daims and colleagues, each reported in Nature enriched Nitrospira that perform complete ammonia oxidation to nitrate within one organism. In 2017 Kits and colleagues isolated one of them, Nitrospira inopinata, in pure culture and showed that it oxidised ammonia to nitrate stoichiometrically.
The Lake 226 result appeared in Science in 1974. A PNAS profile records that Schindler was invited in 1968 to head the experimental-lakes project.
A new case of fixation
UCYN-A is a nitrogen-fixing cyanobacterium that lives inside one marine alga, Braarudosphaera bigelowii. In 2024 Coale and colleagues interpreted it as an early-stage nitrogen-fixing organelle; the result is for that alga and its partner.
Phosphorus: aerosol source and terrestrial limitation figures
Barkley and colleagues (2019), sampling aerosols at Cayenne, French Guiana, and modelling their transport, reported that African aerosols carry phosphorus to the Amazon and tropical Atlantic, and that smoke from biomass burning in southern Africa, not only desert dust, is a substantial source of the soluble phosphorus.
Hou and colleagues’ 2020 synthesis found significant phosphorus limitation in 46.2 percent of 652 field phosphorus-addition experiments in natural ecosystems and croplands, including outside the tropics. In the 436 experiments in natural terrestrial ecosystems, phosphorus addition raised aboveground plant production by a mean of 34.9 percent.
How loose is a zero?
If the four carbon-budget uncertainties were independent, the residual’s standard uncertainty would be about ±1.4 GtC yr⁻¹ (the square root of 0.9² + 0.2² + 0.4² + 1.0²), far larger than the unrounded residual of about −0.02.
Measurement-error case details
Morford and colleagues estimated 1.6 to 10.7 kg N ha⁻¹ yr⁻¹ from weathering at three Klamath Mountains forest sites on nitrogen-rich mica schist. Mohr and colleagues (2010) found that the bubble method underestimated fixation by 60 percent in a 12-hour incubation of Crocosphaera watsonii cultures.
Your notes
Select any text in the lesson to highlight it or add a note to it. Your highlights and notes are saved in this browser and collected in your notebook.
This browser is not letting the site save anything (a private window or strict privacy settings), so highlights and notes will be lost when you leave the page.
How we measure it
Small-watershed budget
Choose a watershed on watertight bedrock, gauge precipitation and its chemistry, and measure stream flow and chemistry at a weir. Inputs minus outputs gives the net gain or loss through the measured routes (gas exchange such as fixation and denitrification needs separate measurement), and a treated watershed can be compared with an untreated reference.
Whole-lake manipulation
Add or withhold nutrients to an entire lake or a divided basin and follow chlorophyll, nutrients and nitrogen fixation for years against pre-treatment data and an untreated lake. It tests limitation at the scale managers act on, but one lake is not a replicate.
15N tracer methods
Add the heavy isotope 15N and follow it: into biomass for nitrogen fixation, into N2 for denitrification or anammox, or as the dilution of a labelled ammonium pool by newly made unlabelled ammonium (isotope pool dilution) for gross mineralisation. The answer depends on how well the label mixes with the pool being measured.
Practice questions on this lesson (3) → MCAT-style, original, each with an explanation
Where this lesson fits
Before thisReview first
- Energy Flow and ProductivityThis course · Lesson 21
You need its mass-balance and pools-and-fluxes bookkeeping here, where atoms are reused instead of leaving as heat.
After thisStudy next
- Biodiversity and Ecosystem FunctionThis course · Lesson 23
It asks how the species present change the uptake and cycling of nutrients that this lesson budgets.
- Global Change: Species on the MoveThis course · Lesson 24
It applies budgets and boundary fluxes to how added carbon and nitrogen change ecosystems.
Elsewhere on the siteFilms, simulations and method films in other courses
- Follow an atomSimulation · Biology
It lets you follow an atom through reservoirs and processes, the pools-and-fluxes picture used here.
- Design a watershed fixSimulation · Biology
It shows nitrogen and phosphorus leaving a watershed and driving algae and low oxygen.
- Switch off a microbe groupSimulation · Biology
It shows what a system loses when nitrogen-handling microbes are switched off.
- Nitrogen Everywhere, and Not a Bit to UseFilm · Life Science
It shows why nitrogen gas in air is unusable until microbes convert it.
Suggested by an AI model from the lessons themselves, then checked. How we use AI
Finish line
Test yourself
8 questions
Practice and MCAT-style, with explained answers.
Next · Lesson 23
Biodiversity and Ecosystem Function
Grassland plots sown with sixteen species generally out-grew plots with one, yet the species inside them were, on average, less steady from year to year. How can the total be steadier than its parts?
Continue →