Organismal Biology · Unit 3: Supply and exchange
Carrying Oxygen and Carbon Dioxide
Rewritten on : new text, flashcards and film. Your notes and highlights stay, but the text around them may have moved.
A litre of your arterial blood carries about 200 mL of oxygen. If that blood were plasma alone, it would carry about 3 mL. What makes up the difference, and how does carbon dioxide get back to the lungs?
Pause when the reading reaches a film, and offer to play it. Saved on this device.
Watch the film now, or keep listening
Builds on:Gas Exchange and BreathingCirculation and the HeartSize, Scale and SurfaceWhy these?
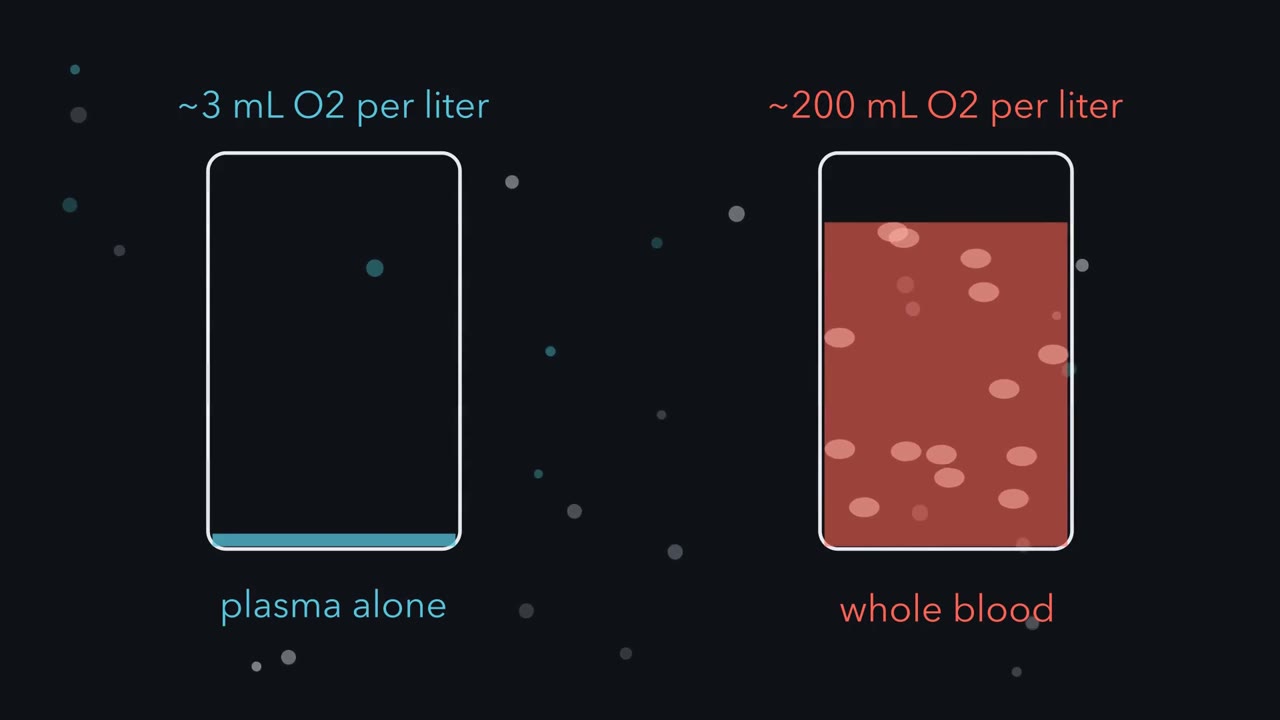 ▶ Watch Why Blood Needs an S-Shaped Carrier · 3:18
Read the transcript of “Why Blood Needs an S-Shaped Carrier”
Film transcript: Why Blood Needs an S-Shaped Carrier
A litre of plasma carries about three millilitres of oxygen, but a litre of your blood carries about two hundred. What makes up the difference, and how does blood give it up in the right places? Plasma is mostly water, and oxygen dissolves poorly in water. The difference rides on hemoglobin, an iron-containing protein packed inside red blood cells. Saturation is the share of hemoglobin's binding sites that hold oxygen. Plot it against oxygen pressure and mark where blood loads and where it unloads. Blood loads in the lungs, where oxygen pressure is high. At rest, it leaves the tissues at a much lower pressure. Each decilitre of blood has a maximum load of oxygen on hemoglobin, its carrying capacity. The load actually carried is capacity times saturation.
Hemoglobin releases that capacity times the drop in saturation, from lung to tissue. That drop is the gap between two points on one curve. Try a simple carrier first, with one binding site per molecule. Give it a loose grip, half full at about the same pressure as blood. In the lungs, it fills only to about four-fifths. So tighten its grip, until it fills in the lungs. What happens when that blood reaches the tissue?
It holds on. At tissue pressure it is still nearly full, so it releases almost nothing. Between lung and tissue pressures, a one-site carrier faces a trade-off: fill well, or give up a lot. Hemoglobin escapes the trade-off. Its curve is S-shaped. Near the top it is nearly flat, so a modest fall in lung pressure costs little.
Below that, it falls steeply. At rest, the tissue point sits at the shoulder, where the steep part begins. Blood gives up about a quarter of its oxygen. The other three-quarters comes back unused, as a reserve. In hard work, the oxygen pressure of blood leaving active tissue can fall into the steep middle. Now the same blood gives up about two-thirds. Why the S? Hemoglobin has four binding sites. In a simple picture, the molecule switches shape as a whole. Each oxygen that binds makes the switch to the high-affinity shape more likely. So once some sites hold oxygen, the rest fill with a smaller rise in pressure. Emptying runs the same way in reverse.
That is cooperative binding. Between these lung and tissue pressures, a one-site carrier cannot both load fully and unload a lot. Cooperative binding lets one carrier load fully in the lungs, and still unload a lot in the tissues.
From the film
- Plasma alone would carry about 3 mL of oxygen per litre; hemoglobin in red cells raises that to about 200 mL.
- Hemoglobin releases its carrying capacity times the drop in saturation between lungs and tissue.
- Between lung and tissue pressures, a one-site carrier cannot both load fully and unload a lot: a loose grip leaves it four-fifths full, a tight grip keeps it nearly full in tissue.
- Cooperative binding gives hemoglobin an S-shaped curve, so one carrier loads fully in the lungs and still unloads a lot in the tissues.
This text picks up where the first film stops. It builds on gas exchange, where oxygen enters the blood, and on blood and vessels and the heart, which move it.
The one idea. Each decilitre (dL, a tenth of a litre) of blood releases oxygen from hemoglobin equal to its carrying capacity (the oxygen its hemoglobin holds when fully loaded, about 20 mL per dL) times the fall in saturation (the share of binding sites holding oxygen) between the lungs and the tissue: oxygen released from hemoglobin = capacity × (saturation in the lungs − saturation in the tissue) Hemoglobin’s S-shaped curve keeps the first saturation near full and lets the second fall far, so one carrier loads fully and still unloads a lot.
Scope: adult human blood at equilibrium, with arterial blood near 100 mmHg and blood returning from resting tissues near 40 mmHg; mixed or regional venous PO2 can approach 20 mmHg in hard exercise. These are blood PO2 points, not universal tissue PO2 values, so “tissue” on the curve, here and in the films, means blood leaving the tissue. Over that range a one-site carrier cannot both load fully and unload a lot, and a modest right shift costs little in the lungs. Dissolved oxygen adds about 0.18 mL per dL, about 4%, to the resting release.
Where the points sit on the curve
Gases diffuse from high to low partial pressure, the share of a gas mixture’s pressure due to one gas, written PO2 for oxygen and measured in mmHg (millimetres of mercury). For blood, picture it sealed in a flask under gas: once oxygen stops moving between them, the gas’s PO2 is the blood’s.
Dissolved oxygen is about 0.003 mL per dL for each mmHg, only 0.3 mL per dL at 100 mmHg, so almost all the oxygen rides on hemoglobin; the predominant adult human form, HbA, has four chains (two alpha and two beta) and four oxygen-binding sites. Saturation plotted against PO2 is the oxygen dissociation curve, S-shaped, or sigmoid, for adult human blood.
The first film’s saturations come from the Severinghaus model, a standard equation fitted to human blood, with a capacity of 20.1 mL per dL (1.34 mL per g × 15 g hemoglobin per dL); the numbers are in Going deeper. The curve is nearly flat above about 60 mmHg and steepest between about 10 and 35 mmHg, so the resting point at 40 sits on the shoulder and the steep middle is the reserve for hard work.
The films’ “grip” is the P50, the PO2 at which hemoglobin is half saturated. It measures affinity, how tightly the carrier holds oxygen; a tight grip is half full at a low pressure, so a higher P50 means lower affinity. In a standard model of human blood at 37 degrees C, pH 7.4 and a carbon dioxide pressure of 40 mmHg, P50 is 26.8 mmHg.
The first film’s two-shape cartoon of cooperative binding is a simplification; how the four chains actually pass the change is told in protein binding and allostery.
How much oxygen does the body use?
Oxygen delivery is arterial oxygen content times the cardiac output (blood pumped by the heart each minute). At steady state, the Fick principle says oxygen use is cardiac output times the arterial-minus-mixed-venous difference in content.
Worked problem. Take an illustrative adult human at rest. Assume hemoglobin 15 g per dL, 1.34 mL of oxygen per g of fully saturated hemoglobin (a common working value; see Going deeper), dissolved oxygen 0.003 mL per dL per mmHg and a cardiac output of 5.0 L per min.
oxygen content = (1.34 x hemoglobin x saturation) + (0.003 x PO2) oxygen use = cardiac output x (arterial content - venous content)
- Arterial blood (saturation 98%, PO2 100 mmHg): bound = 1.34 x 15 x 0.98 = 19.70 mL per dL; dissolved = 0.003 x 100 = 0.30 mL per dL; total 20.00 mL per dL.
- Mixed venous blood (blood returning from the whole body, mixed in the right side of the heart; saturation 75%, PO2 40 mmHg): bound = 1.34 x 15 x 0.75 = 15.08 mL per dL; dissolved = 0.12 mL per dL; total 15.20 mL per dL.
- Difference: 20.00 - 15.20 = 4.80 mL per dL. The tissues took 4.80 / 20.00 = 24% of the oxygen offered.
- Fick principle: 5.0 L per min is 50 dL per min. Delivery is 50 x 20.00 = 1,000 mL per min; use is 50 x 4.80 = 240 mL per min.
The saturations are rounded; the 4.80 is 4.62 from hemoglobin (the film’s 4.6) plus 0.18 dissolved, and dissolved oxygen is 1.5% of arterial content (0.30 of 20.00 mL per dL). The unused three-quarters is the reserve tissues draw on in exercise (muscle and movement).
- Arterial (saturation 98%, PO2 100 mmHg)
- Mixed venous (PO2 40 mmHg)
- Difference, and share used
- Delivery (cardiac output x arterial content)
- Oxygen use (Fick principle)
- Dissolved share of arterial content
In this sketch: an illustrative adult human at rest, steady state, 1.34 mL O2 per g of fully saturated hemoglobin (a common working value; the theoretical figure is near 1.39), 0.003 mL per dL per mmHg dissolved, arterial saturation 98% and PO2 100 mmHg, and venous PO2 held at 40 mmHg whatever the venous saturation. Slider settings other than the worked values are not claims about any person.
Oxygen content is bound plus dissolved, and oxygen use is cardiac output times the arterial-venous difference. Lower pH or more carbon dioxide (the Bohr effect) shifts the curve right, and higher temperature and more BPG are separate effects that also raise P50; at the same PO2 the blood then holds less oxygen. No curve is drawn because the lesson gives no equation for it.
What makes blood release more of that reserve in working tissue? The second film follows the experiment that first found out.
Read the transcript of “Bohr's Dog Blood: Shifting the Curve”
Film transcript: Bohr's Dog Blood: Shifting the Curve
Working tissue pours out carbon dioxide. Does that change how tightly blood holds oxygen, or does carbon dioxide just ride along? The first film showed blood delivering its drop in saturation, from lung to tissue. Now ask what makes that drop bigger where tissue is working. In Copenhagen in 1903, Christian Bohr worked with Karl Hasselbalch and August Krogh. They took fresh dog blood. They exposed samples to gas at a set oxygen pressure, and measured how much oxygen the blood bound. Repeating this at many pressures traces the curve. Then they raised the carbon dioxide in the gas, and measured again at the same oxygen pressures. If carbon dioxide simply rode along, nothing should change.
Only carbon dioxide changed, so any difference came from it, or from the acid it forms. If something does change, where will it show most? At a low oxygen pressure, or near full saturation? More carbon dioxide lowered oxygen binding. The effect was large at low oxygen pressures and small near full saturation. The curve had moved to the right. Today this is called the Bohr effect: a fall in oxygen affinity when pH falls or carbon dioxide rises. The shift raises P50, the oxygen pressure at which hemoglobin is half full. A higher P50 means a looser grip. Now bring back the bands. In the lungs, the shifted curve is still nearly full. Loading barely changes.
But at tissue pressure the shifted curve sits lower. So the release bracket grows, by about two-fifths at rest in this model. And that happens where it matters. Working tissue is high in carbon dioxide and low in oxygen, so blood gives up more exactly there. Published in 1904, the paper offered a reason why blood gives up oxygen more readily in active tissue. Two other changes also shift the curve right. Warmer tissue lowers affinity, and working muscle is warmer than resting muscle. So does more BPG, a small molecule made in red cells. They are separate effects, each with its own cause. The name Bohr effect is kept for pH and carbon dioxide alone.
So a modest right shift costs little in the lungs, where blood loads. It pays out in working tissue, where blood unloads and the need is greatest.
From the film
- Bohr, Hasselbalch and Krogh found that more carbon dioxide lowered oxygen binding in dog blood at the same oxygen pressure, most at low oxygen pressures; the design could not separate carbon dioxide from the acid it forms.
- The Bohr effect is the fall in affinity when pH falls or carbon dioxide rises; it shifts the curve right and raises P50.
- Higher temperature and more BPG also shift the curve right, but they are separate effects, not the Bohr effect.
- A modest right shift barely changes loading in the lungs but raises release in working tissue, where carbon dioxide is high and PO2 low.
Shifting the curve: what the experiment left open
Bohr’s experiment showed that carbon dioxide lowers affinity, but not how, since carbon dioxide also makes blood more acidic. Later work took up the question; the carbon dioxide section below shows both at work, the acid and carbon dioxide bound to the protein.
BPG, 2,3-bisphosphoglycerate, is made in red cells from a side branch of glycolysis and acts inside them. It binds preferentially to the deoxygenated, low-affinity form of hemoglobin, about one molecule per four-chain hemoglobin, in the cavity between the beta chains. By favouring that form, it raises P50.
Higher pH, less carbon dioxide, lower temperature or less BPG shift the curve left, toward higher affinity. A left-shifted carrier suits a supply that is not air in the lungs: another blood, as for the fetus, or blood feeding a store, as for myoglobin in muscle.
Other carriers, other settings
Predict. Fetal blood’s curve sits to the left of the mother’s. At the placenta, oxygen diffuses from the mother’s blood into fetal blood, which has the lower PO2. How does the left shift help?
Check your prediction
At its lower PO2, fetal blood still reaches a high saturation, so it takes up more oxygen than adult blood would there. Both bloods still carry oxygen; the net flow runs from mother to fetus, down the PO2 difference (see animal reproduction).
The human fetus. Fetal hemoglobin, which has gamma chains in place of the adult beta chains, still binds BPG but responds less to it, a large part of why fetal blood grips tighter. In 1970 H. Franklin Bunn and Robin Briehl showed that, with BPG removed and then added back at the same concentration, adult hemoglobin’s P50 rose about twofold while fetal hemoglobin’s rose less.
Myoglobin. Myoglobin, a single-chain oxygen store in muscle, behaves much like the first film’s tight one-site carrier: its curve is hyperbolic, rising steeply from zero and flattening early, and its P50 is about a tenth of blood’s (Going deeper). It takes up oxygen from blood and gives it up only when the PO2 inside muscle fibres is very low, as in hard work.
Body size. Among mammals, small species tend to have higher P50 values than large ones, a pattern described by Knut Schmidt-Nielsen and J. L. Larimer in 1958, though the trend is loose and differs among lineages. A mouse uses more oxygen per gram of tissue than an elephant (see size and scaling), and lower affinity favours unloading. Shifts linked to altitude, in the bar-headed goose and the llama, are in protein binding and allostery.
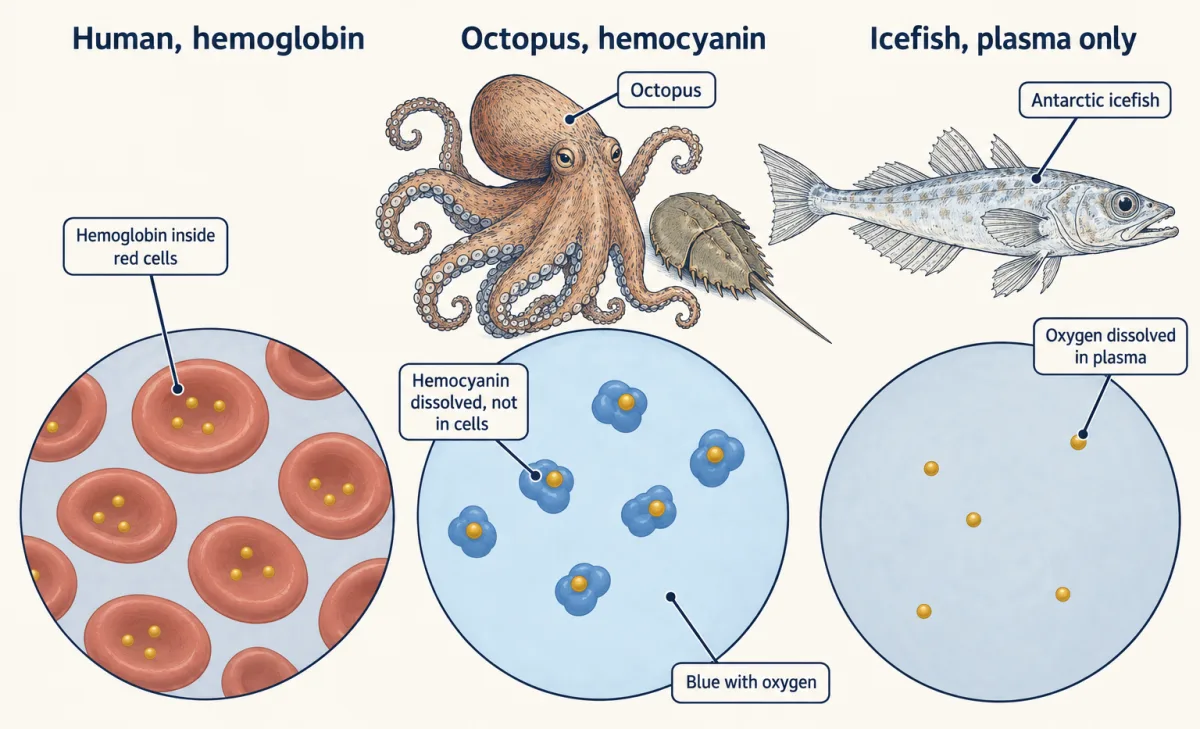
Other carriers, and none. Horseshoe crabs and octopuses carry oxygen on hemocyanin, a copper-containing protein dissolved in their blood instead of packed in cells. It is colourless without oxygen and blue with it. Adult Antarctic icefish have almost no red cells and no working hemoglobin, as Johan Ruud reported in 1954; their oxygen travels dissolved in plasma, in near-freezing water that holds more dissolved gas than warm water.
Carrying carbon dioxide back
Carbon dioxide returns to the lungs mostly as bicarbonate (HCO3-, formed when carbon dioxide reacts with water). For resting tissue, one careful review estimates about 85% as bicarbonate, 10% dissolved and 5% on hemoglobin, approximations that depend on what is counted and change in exercise. Many textbooks give hemoglobin near a quarter, an older figure now thought too high.
Bicarbonate. In red cells, the enzyme carbonic anhydrase speeds the reaction of carbon dioxide with water (see enzyme action):
CO2 + H2O ⇌ H2CO3 ⇌ H+ + HCO3-
The bicarbonate leaves the red cell in exchange for a chloride ion through a membrane exchanger (see membrane transport) and travels in plasma. Hemoglobin takes up most of the hydrogen ions, acting as a buffer; this is one way carbon dioxide lowers hemoglobin’s affinity in tissue capillaries, part of the Bohr effect. In the lungs the reactions run backwards and carbon dioxide diffuses out.
Carbamino compounds. Some carbon dioxide binds directly to the end amino groups of hemoglobin’s chains, forming carbamino compounds, not to the iron where oxygen sits. Blocking those amino groups in horse hemoglobin removed the oxygen-linked part of this binding.
Predict. Deoxygenated hemoglobin takes up hydrogen ions more readily than oxygenated hemoglobin, and forms more carbamino compounds. So as blood loads oxygen in the lungs, does it hold more or less carbon dioxide at the same carbon dioxide pressure?
Check your prediction
Less. As oxygen binds, hemoglobin lets go of its hydrogen ions and carbamino carbon dioxide; the hydrogen ions turn bicarbonate back into carbon dioxide, which is breathed away. This is the Haldane effect, described by Christiansen, Douglas and Haldane in 1914: at the same carbon dioxide pressure, deoxygenated blood carries more carbon dioxide than oxygenated blood. In tissue it runs the other way: deoxygenated hemoglobin removes the H+ made with each bicarbonate and lets the reaction run further to the right.
So the Bohr and Haldane effects are one coupling seen from each side: carbon dioxide and acid acting on oxygen binding, and oxygen acting on carbon dioxide carriage. For oxygen it is the one idea at work: working tissue’s carbon dioxide and acid widen the fall in saturation between lung and tissue. Bicarbonate also links to blood pH, which the kidney helps regulate.
Design problem
Human fetal blood binds oxygen more tightly than adult blood. Is that built into fetal hemoglobin itself, so it binds more tightly even in a test tube with no BPG, or does it come from its response to BPG? Design an experiment to tell.
Saved in this browser only.
One way to do it
Strip purified adult and fetal hemoglobin of BPG and other organic phosphates, as Bunn and Briehl did in 1970. First, measure each stripped hemoglobin’s P50: if fetal hemoglobin were much tighter-binding on its own, its P50 would already be lower here.
Second, add back the same BPG concentration to both. Bunn and Briehl used 0.2 mM BPG and got the result described above, a weaker fetal response.
Hold pH, temperature, buffer, salt and hemoglobin concentration equal, since each changes P50, and test several BPG concentrations, not one. Then check whole blood, comparing cord blood with adult blood, as Enoki and colleagues did in 1972. Test-tube conditions may be far from body temperature, so repeat at 37 degrees C before applying the numbers to a living fetus.
Going deeper
The films’ carriers, by the numbers
Severinghaus model, capacity 20.1 mL per dL; the first film’s points are the first row. A shift stretches the pressure axis of the whole curve, a simplification; the one-site carriers are imaginary. Dissolved oxygen would add 0.18 mL per dL to each release.
| Carrier | Saturation at 100 mmHg | at 40 mmHg | at 20 mmHg | Released from hemoglobin, 100 to 40 |
|---|---|---|---|---|
| Adult human blood, P50 26.8 | 97.7% | 74.9% | 32.0% | 4.6 mL per dL |
| Shifted right, P50 32 | 96.2% | 64.6% | 23.6% | 6.4 mL per dL |
| One-site carrier, P50 26.8 | 78.9% | 59.9% | 42.7% | 3.8 mL per dL |
| One-site carrier, P50 3 | 97.1% | 93.0% | 87.0% | 0.8 mL per dL |
The right shift costs about 1.5 points of loading but raises resting release by about two-fifths; a large shift or a low lung PO2 would cost more. The loose one-site carrier releases almost as much at rest (3.8 against 4.6 mL per dL) but leaves the lungs about four-fifths full and has far less reserve (about 7 against 13 mL per dL down to 20 mmHg); the tight one releases under 1 mL per dL. Myoglobin escapes this by unloading at far lower pressures, inside muscle fibres.
Shoulder and reserve, by slope
In the model, saturation changes by about 0.07 percentage points per mmHg at 100 mmHg, about 1.3 at 40 mmHg and about 2.6 near 25 mmHg.
Units and the 1.34 figure
1 Torr is essentially the same unit as 1 mmHg. The worked problem’s 1.34 mL of oxygen per g of fully saturated hemoglobin is a common working value; the theoretical figure is near 1.39.
Hemolymph
In animals with an open circulation, such as horseshoe crabs, the fluid that carries hemocyanin is called hemolymph; octopuses have a closed circulation.
Who found that BPG lowers affinity
Ruth and Reinhold Benesch reported that BPG lowers hemoglobin’s oxygen affinity in 1967, as did Alfred Chanutin and Richard Curnish the same year.
The fetal hemoglobin pocket and cord blood
Later work traced much of fetal hemoglobin’s weaker response to BPG to one swap in the BPG pocket: where the beta chain has histidine at position 143, the gamma chain has serine. Whole cord blood also had higher affinity than adult blood in a 1972 comparison by Enoki and colleagues.
Myoglobin and blood: the numbers
Horse myoglobin in solution at 37 degrees C and pH 7.0 has a P50 of 2.39 Torr, roughly a tenth of the 26.8 mmHg modelled for human blood. Keep in mind that one number comes from purified horse protein and the other from a model of human blood.
Your notes
Select any text in the lesson to highlight it or add a note to it. Your highlights and notes are saved in this browser and collected in your notebook.
This browser is not letting the site save anything (a private window or strict privacy settings), so highlights and notes will be lost when you leave the page.
How we measure it
Gas equilibration (tonometry)
Expose a blood or hemoglobin sample to a gas mixture of known oxygen and carbon dioxide partial pressure until it comes to equilibrium, then measure the bound oxygen. Repeating it at many oxygen pressures traces the dissociation curve, and changing one gas at a time tests its effect.
Oxygen equilibrium spectrophotometry
Oxygenated and deoxygenated hemoglobin or myoglobin absorb light differently, so the spectrum of a sample gives its saturation. Fitting several wavelengths at once can also correct for oxidized pigment, as the 1997 horse myoglobin study did for metmyoglobin.
Phosphate stripping and add-back
Remove BPG and other organic phosphates from purified hemoglobin, then add back a known amount and measure the change in P50. Comparing two hemoglobins under identical conditions separates their built-in affinity from their response to the effector.
Chemical blocking of amino groups
React selected chain-end amino groups of hemoglobin with cyanate so they can no longer bind carbon dioxide, then compare carbon dioxide binding by the oxygenated and deoxygenated forms. If the difference vanishes while the protein otherwise works normally, those groups most likely carried it.
Practice questions on this lesson (8) → MCAT-style, original, each with an explanation
Where this lesson fits
Before thisReview first
- Gas Exchange and BreathingThis course · Lesson 12
This lesson starts where oxygen enters the blood in the lungs, using the partial pressures set up there.
- Circulation and the HeartThis course · Lesson 10
You need cardiac output from there to calculate oxygen delivery and use by the Fick principle.
- Size, Scale and SurfaceThis course · Lesson 2
Its link between body size and oxygen use per gram explains why small mammals have higher P50 values.
After thisStudy next
- Osmoregulation and Nitrogenous WasteThis course · Lesson 15
It continues the unit on exchange, with water and salts replacing gases as the supply problem.
Suggested by an AI model from the lessons themselves, then checked. How we use AI
Finish line
Test yourself
13 questions
Practice and MCAT-style, with explained answers.
Next · Lesson 14
Digestive Systems and Nutrition
Why would a rabbit eat some of its own droppings?
Continue →