Organismal Biology · Unit 1: Organisms and their diversity
Size, Scale and Surface
Rewritten on : new text, flashcards and film. Your notes and highlights stay, but the text around them may have moved.
A flatworm has no lungs and no heart. Why can't a mouse manage the same way?
Pause when the reading reaches a film, and offer to play it. Saved on this device.
Watch the film now, or keep listening
Builds on:What an Organism Has to DoDiffusion and OsmosisWhy these?
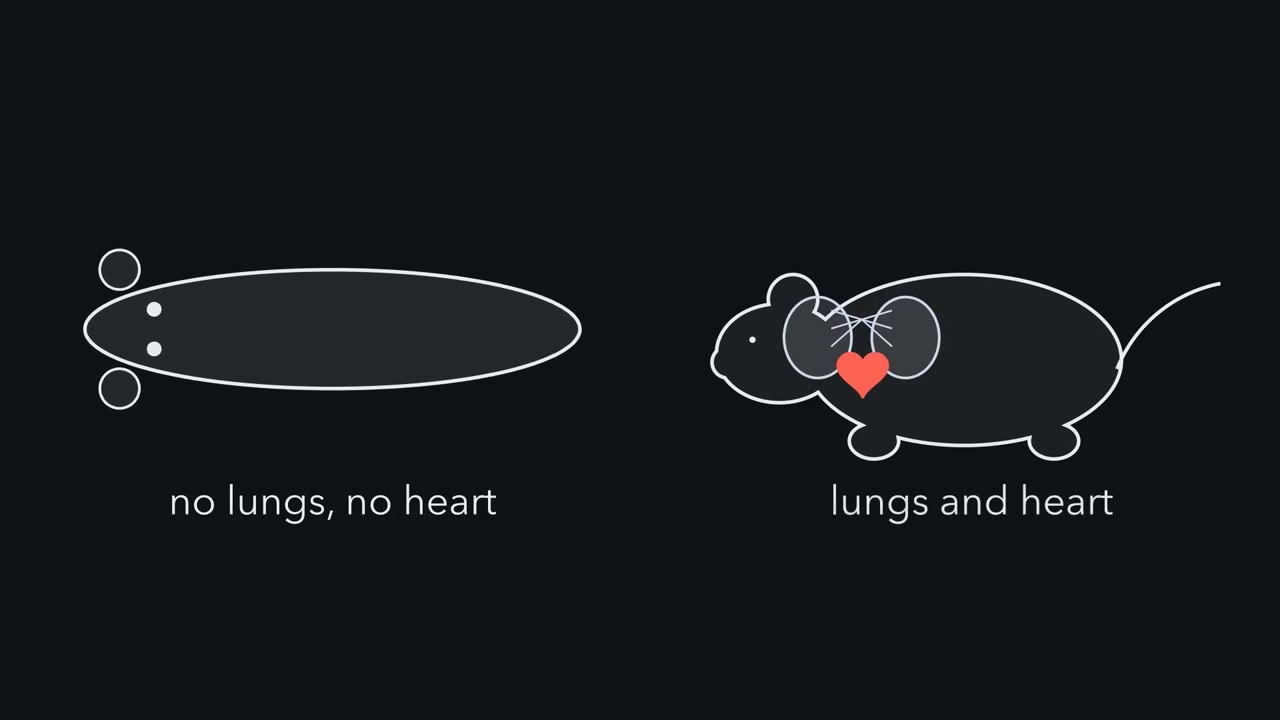 ▶ Watch Why a Mouse Needs Plumbing · 3:16
Read the transcript of “Why a Mouse Needs Plumbing”
Film transcript: Why a Mouse Needs Plumbing
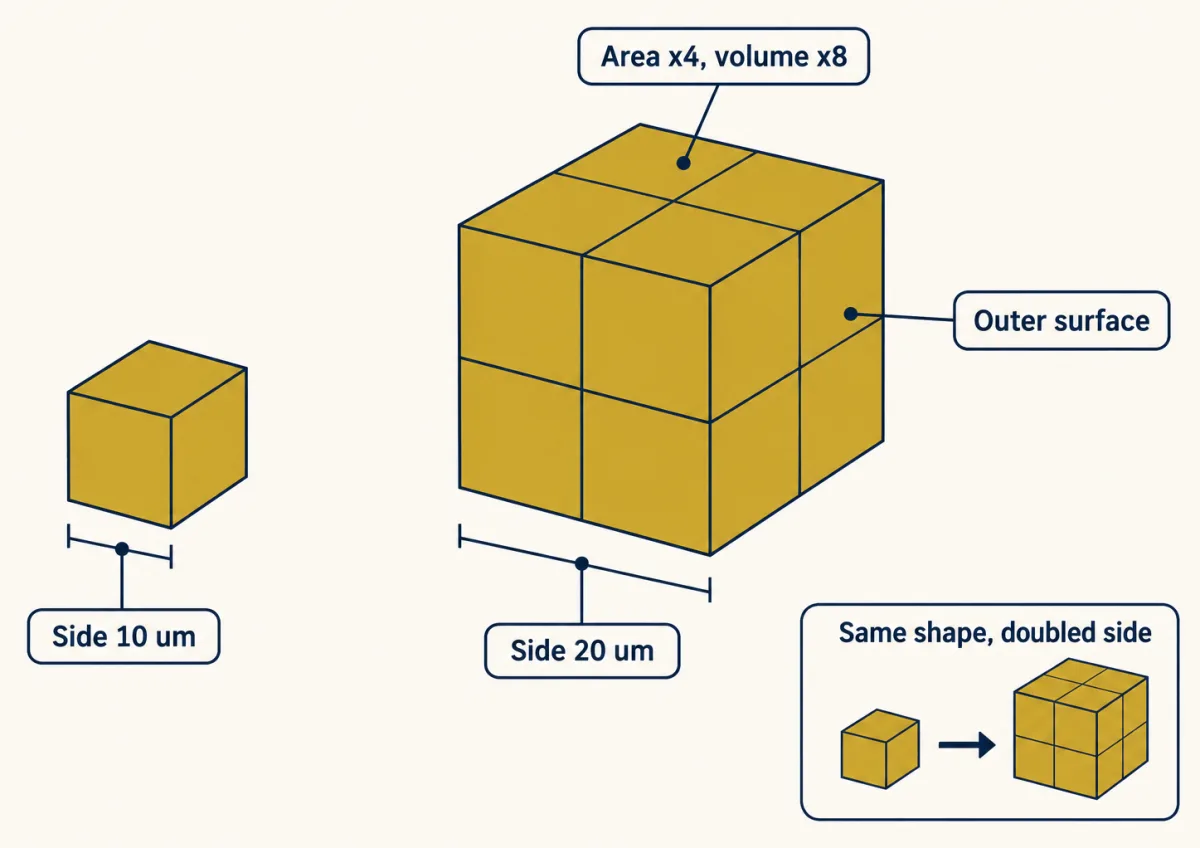
A flatworm has no lungs and no heart. A mouse has both. What changed when the body got bigger? Everything a body takes in must cross a surface, oxygen included. Take a tiny cube of living tissue. Its gold faces are its surface, and its inside is its volume. Now make every side twice as long. The big cube holds eight times as much inside. But its outer surface grows only four times. So each bit of inside now has half as much surface to feed it. There is a second change, and it matters more. The centre of the big cube now sits twice as far from any face. Oxygen must travel farther. Oxygen gets in by diffusion. Each molecule wanders in random steps, as likely backward as forward.
Across five micrometres, that walk takes about a hundredth of a second. Now double the distance to ten micrometres. How much longer does the walk take? Four times as long. Diffusion time grows with the square of the distance. Twice as far costs four times the wait, and ten times as far costs a hundred. That is quick across a cell. Now zoom out to one centimetre, about a finger's width. The same random walk takes about fourteen hours. So picture a solid ball of living tissue, breathing only through its gold skin. Oxygen soaks in from the surface, and the tissue burns it on the way in. Tissue holds little dissolved oxygen, about a minute's worth or less at resting mammal rates. So supply must keep pace.
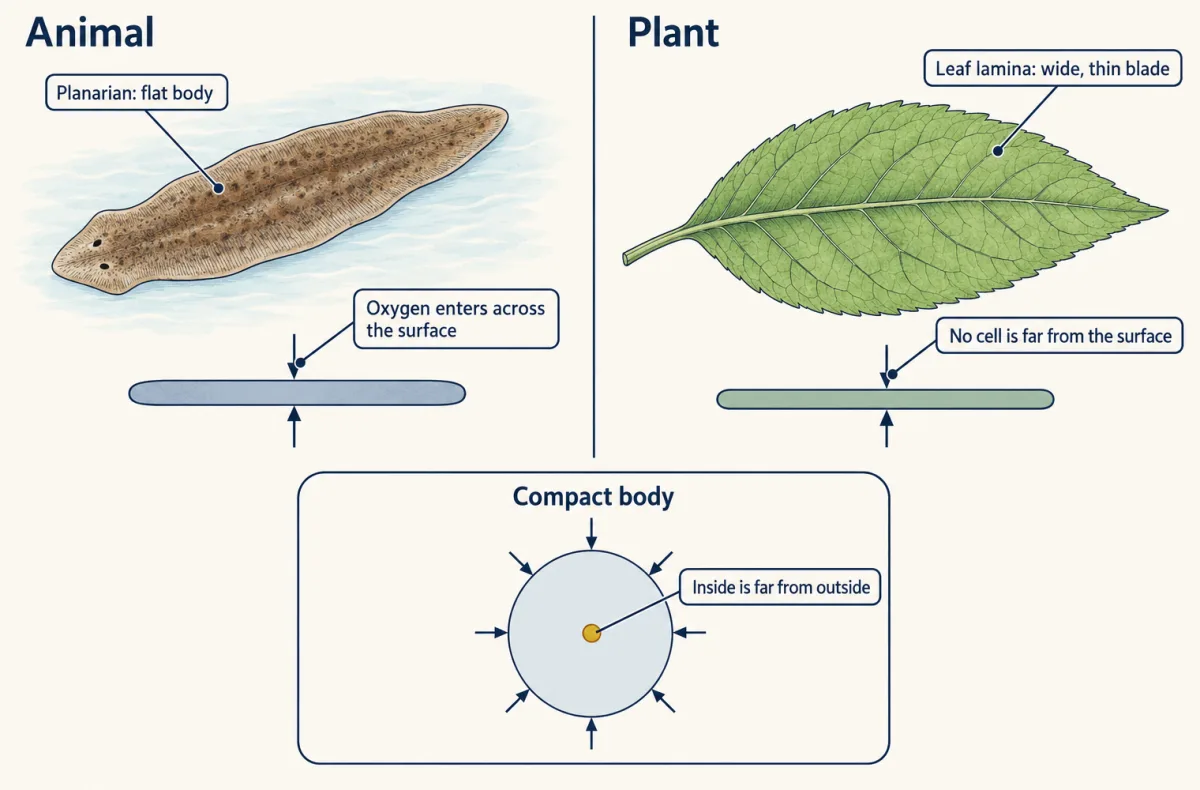
In this ideal model, a big enough ball runs out at its centre. How big can the ball get before its centre just runs dry? In this model, slow tissue allows a little over a millimetre of radius. Busy tissue allows only a few tenths of a millimetre. A flatworm takes another route. It grows long and wide, but stays thin. Every cell stays close to the outside, so diffusion is enough. A mouse is thick, and its tissue runs fast. So it moves fluid in bulk. Pumped air and pumped blood carry oxygen most of the way in. Bulk flow brings the supply close, but it does not finish the job. Diffusion still carries oxygen across the last few micrometres, through thin walls.
So, for the same shape fed only from outside, a bigger body means a longer path. Bodies stay thin, add inner surface, or pump fluid. In thick, busy animals, bulk flow does most of the carrying.
From the film
- When a body grows without changing shape, its surface grows four times for every eight times its volume, so each bit of inside has less surface.
- The inside also ends up farther from the surface, and diffusion is quick across a cell but slow across a body: twice the distance takes four times as long.
- In a simple model of a solid ball of tissue fed from its surface, oxygen from air runs out at the centre once the radius passes about 1.5 mm for slow tissue, or a few tenths of a millimetre for busy tissue.
- For the same shape fed only from outside, a bigger body means a longer path, so bodies stay thin, add inner surface or pump fluid; in thick, busy animals, bulk flow does most of the carrying and diffusion finishes the last few micrometres.
A flatworm has no lungs and no heart, yet oxygen reaches all its cells; a mouse needs both. The first film traces why; this text adds the depth limit, plants, and energy use. It builds on what an organism has to do.
The one idea. When a body grows without changing shape, its middle ends up farther from its outer surface, and diffusion time grows with the square of that distance. In a simple model of a solid ball of tissue fed from air at its surface, oxygen runs out at the centre once the radius passes about 1.5 mm for slow tissue, or a few tenths of a millimetre for busy tissue; other shapes give other limits. So bodies stay thin, add internal exchange surfaces, or move fluid in bulk (bulk flow: pumped blood, air or sap), leaving diffusion only the last few micrometres.
Scope: oxygen in metabolically active tissue, bodies compared at the same shape and density and supplied from their outer surface. The depth numbers come from an idealized model (Going deeper); low-demand tissue, or a cell with an unusual internal arrangement, shifts the limit.
A bigger cube has less skin per unit of inside
The surface-area-to-volume ratio, outer area divided by enclosed volume, measures the first cost the first film’s cubes showed: less surface per bit of inside. For an ideal cube of side s, the area is 6s² (six square faces) and the volume s³.
In words Surface area over volume is six s squared over s cubed, which simplifies to six over s.
- 6s²“six s squared”
- the area of the cube’s six square faces, each s × sum²
- s³“s cubed”
- the cube’s volume, s × s × sum³
- 6/s“six over s”
- the ratio: surface per unit of volume. Area divided by volume leaves one length on the bottom, so the unit is per length.per um
Sanity check s sits on the bottom, so the ratio falls as the cube grows. A very small cube has a huge ratio, which is why single cells can manage by diffusion alone.
Try one number
Cancel step by step: s² / s³ = (s × s) / (s × s × s). Two s’s cancel top and bottom, leaving 1/s, so 6s² / s³ = 6/s.
For a cube of side 10 um: 6/10 = 0.6 per um. A sphere of radius r gives 3/r (Going deeper).
Need a refresher? powers and roots · rates and “per”
For real cell sizes and shapes, see the measured eukaryotic cell.
Diffusion: fast over micrometres, slow over centimetres
Diffusion is the net spread of molecules from where they are more concentrated to where they are less, driven by their random motion. Its speed is set by the diffusion coefficient, D. For a small molecule in water, D is about 1,000 um² per s. Crossing membranes is in membrane transport.
In a simple model of free diffusion along one direction, the mean squared distance travelled in time t is 2Dt; its square root is the typical distance L. Set L² = 2Dt and divide by 2D:
In words The time is the distance squared, divided by two times the diffusion coefficient.
- t“t”
- the typical time to spread a distance L along one directions
- L²“L squared”
- the distance, multiplied by itselfum²
- D“D”
- the diffusion coefficient: how fast this molecule spreads in this medium. About 1,000 um² per s for a small molecule in water.um² per s
Sanity check Double the distance and the time goes up four times, because L is squared. A larger D, a faster-spreading molecule, means a shorter time.
Try one number
The distance the first film skipped: L = 1 mm = 1,000 um, D = 1,000 um² per s. L² = 1,000,000 um², and 2D = 2,000 um² per s.
t = 1,000,000 / 2,000 = 500 s, a little over 8 minutes. Units: um² divided by um² per s leaves seconds. These are rough, typical times (Going deeper).
Need a refresher? powers and roots · units and prefixes
How deep can diffusion reach?
The table fills in the middle of the first film’s model-ball range, from the same idealized model:
| Oxygen use of the tissue (mL O₂ per g per hour) | Largest radius of a solid ball whose centre still gets oxygen |
|---|---|
| 0.05 (slow) | 1.45 mm |
| 0.3 | 0.59 mm |
| 1.0 | 0.33 mm |
| 3.0 (busy) | 0.19 mm |
For scale, a resting human averages about 0.2 mL O₂ per g per hour over the whole body; on the 3/4 fit later in this lesson, which is in energy units, a resting mouse uses about seven times as much per gram. Depth goes as one over the square root of the rate of use, so tenfold faster use (0.3 to 3.0) cuts reach only about threefold.
Predict. Planarians, like many flatworms, are flattened and take oxygen in by diffusion through two faces; a ball takes it in from every direction. In the same model, is a sheet’s largest half-thickness (face to middle) bigger or smaller than the ball’s largest radius?
Check your prediction
Smaller. The sheet’s half-thickness limits are 0.84, 0.34, 0.19 and 0.11 mm, less than the ball’s radius at every rate by a factor of about 1.7, the square root of 3. Flattening does not allow thicker tissue; it works because length and width can grow while thickness stays under the limit.
Four answers in two kingdoms
Flattening. Besides the planarian, the blade, or lamina, of a typical eudicot leaf (a broad-leaved flowering plant, such as a bean) is a wide, thin sheet in which no cell is far from the surface.
Folding. The mammalian lung folds its exchange surface into a vast number of small air sacs, the alveoli. Exchange depends on that area divided by the barrier’s thickness, because a thin barrier is a short diffusion distance. Leaves fold surface inside too: their mesophyll, the photosynthetic tissue, is full of air spaces. Using X-ray microCT, Mathers and colleagues (2018) measured 21.3 mm² of exposed mesophyll surface per mm² of leaf area in barley and 15.5 in rice. Area over area has no units: the inside surface is fifteen to twenty times the leaf’s one-face area, unlike the cube’s ratio in per um.
Branching. The airways of the mammalian lung divide about 23 times in the standard textbook model of the adult human, from the trachea to the alveolar sacs. In a typical eudicot leaf, veins branch from the midrib, the main central vein, into finer and finer veins. Their xylem carries water and minerals, and dense fine veins shorten the path water must take from the xylem, through living tissue, to where it evaporates.
Bulk flow. Bulk flow moves a whole fluid, and everything in it, by a pressure difference or by motors. Breathing, blood circulation and sap in phloem (sugar-carrying tissue) are bulk flow (gas exchange, circulation, plant transport). Even single cells use it: in the giant cells of the alga Chara, motors drive the cytoplasm round at up to about 100 um per s.
None of these removes diffusion. In the mammalian lung, transport shifts from bulk airflow toward diffusion in the finest branches, and oxygen crosses the alveolar wall into the blood by diffusion, not by active transport.
Bulk flow has to deliver whatever the tissue burns. So how much does a body burn, and does every kilogram burn the same? The second film follows the experiments that first asked.
Read the transcript of “Does Every Gram Cost the Same?”
Film transcript: Does Every Gram Cost the Same?
A human is more than two thousand times heavier than a mouse. Does the human burn two thousand times as much energy every day? The first film showed why a thick, busy body pumps blood and air. That flow has to deliver whatever the tissue burns. So how much does a body burn? In 1883, Max Rubner asked a simple question. Does every gram of an animal cost the same to run? He studied resting dogs of many sizes. Dogs suit the question well. One species spans a wide range of sizes. So size can change without changing the kind of animal. Take one dog that is ten times heavier than another. If every gram cost the same, it would make ten times the heat.
Does it? No. Total heat rose with size, but much less steeply than mass. Each kilogram of a small dog made more heat than each kilogram of a big one. Then Rubner divided each dog's heat by its estimated body surface. The values came out roughly equal. Heat tracked surface more closely than mass. In 1932, Max Kleiber gathered resting rates for animals from rats to steers. He plotted them on logarithmic axes, where a power law becomes a straight line. Metabolic rate equals a constant, called a, times body mass raised to a power, called b. On these axes, b is the slope of the line. If b were one, every kilogram would cost the same. Kleiber's line had a slope near three quarters.
Rubner's surface rule implies two thirds. Now place a mouse and a human on the widely used three-quarter fit. The human burns far more in total, but only a few hundred times more. Divide each by body mass. Each kilogram of mouse burns about seven times as much as each kilogram of human. That is a fitted prediction, not a single measurement. In most comparisons of adult mammals and birds, b is positive but below one. So total rate rises more slowly than mass, and rate per kilogram falls as mass rises. Treat three quarters as a fit, not a law. The exponent changes with the animals, their state and the method. Its cause is still debated. So across most adult mammals and birds, bigger animals burn more in total.
But they burn less per kilogram.
From the film
- Rubner found that bigger dogs make more heat in total but less heat per kilogram.
- Metabolic rate is fitted as a constant times body mass to a power b, and b is positive but below 1 in most comparisons of adult mammals and birds: bigger burns more in total, but less per kilogram.
- On the widely used fit with b = 3/4, a mouse burns about seven times as much per kilogram as a human: a fitted prediction, not a single measurement.
- The exponent is a fitted number that changes with the animals, their state and the method, and its cause is still debated.
Body mass and metabolism: Rubner, Kleiber and the debate
Metabolic rate is the rate at which an organism uses energy; basal metabolic rate is that rate in an adult endotherm (an animal that keeps itself warm with its own heat: mammals and birds) at rest, fasted, and at a temperature where it spends nothing extra on heating or cooling.
Rubner’s 1883 “surface law” is usually quoted as an exponent near 2/3, but what he reported was heat roughly constant per unit of estimated body surface. That implies 2/3 if the dogs are treated as one shape and one density: surface grows as length², mass as length³, so surface grows as mass to the power 2/3. It ruled out simple proportionality in these dogs; it did not show that surface heat loss is the cause in other animals. Kleiber’s 1932 fit, rats to steers, gave about 3/4. Both are written as power laws:
In words Metabolic rate equals a constant times body mass raised to the power b.
- a“a”
- a constant for the group of animals: the rate of a 1 kg animal, since 1 to any power is 1. M goes in as a plain number of kilograms, so a carries the units.kcal per day
- Mb“M to the power b”
- body mass M, in kilograms, raised to the power b, the exponent. Plot log rate against log mass and the power law becomes a straight line, log rate = log a + b × log M, whose slope is b.
Sanity check If b were 1, rate would be proportional to mass: ten times the mass, ten times the rate, and the same rate per kilogram. If b is between 0 and 1, rate rises more slowly than mass, so rate per kilogram falls as animals get bigger.
Try one number
Kleiber’s b = 0.75, one animal ten times heavier than another: the rate goes up by 100.75, about 5.6 times, not ten (a calculator job: type 10, press the power key, type 0.75).
Need a refresher? powers and roots · log scales
For rate per kilogram, divide the total by M: rate per kg = a × Mb / M. Dividing powers of the same thing subtracts exponents, Mb / M1 = Mb − 1, so
rate per kg = a × Mb − 1
With b = 0.75 the exponent is −0.25, a negative power, so rate per kilogram falls as M rises.
Worked problem. The second film held b at 0.75 on the widely quoted mammal fit, basal metabolic rate of about 70 x M0.75 kcal per day with M in kg, whose exponent is debated. Now change b:
- The mouse’s rate per kilogram over the human’s is (Mmouse / Mhuman)b − 1.
- A negative power flips a fraction: that equals (Mhuman / Mmouse)1 − b.
- The mass ratio is 70 / 0.03 = 2,333. With b = 3/4 the power is 1/4: 2,3331/4, about 7. With b = 2/3 the power is 1/3, a cube root: 2,3331/3, about 13 (check: 13 × 13 × 13 = 2,197).
The exponent alone nearly doubles the predicted difference. White and Seymour (2003) found a mammalian exponent near 2/3 once body temperature and digestive state were controlled. The exponent depends on the group, the state (basal, field or maximal), temperature and method, and no explanation of it is settled.
In this sketch: one mammal fit, basal rate = a × Mb with a = 70 kcal per day and M in kg; a fitted line, not measurements; no data points. The line is drawn from 10 g to 1,000 kg only so you can move the markers; the lesson uses it for the 30 g mouse and the 70 kg adult human.
- Ratio of totals, heavier ÷ lighter
- –
- Ratio of rates per kg, lighter ÷ heavier
- –
3/4 is an empirical fit, not a law. White and Seymour (2003) found a mammalian exponent near 2/3 once body temperature and digestive state were controlled; Griebeler and Werner (2016) found no single exponent for all the groups. The exponent depends on the group, the state, temperature and method, no explanation of it is settled, and a fitted slope cannot confirm a mechanism.
Rule to keep: rate per kg = a × M(b − 1), so when b is below 1 the rate per kilogram falls as mass rises. The sketch is a fitted line, not a measurement of any animal. The lesson rounds along the way, so its figures are slightly rounder.
Design problem
Illustrative data: plotting log basal metabolic rate against log body mass gives a slope of 0.70 for 40 rodent species and 0.68 for 40 bird species. Pooling those species with shrews and whales gives a slope of 0.76. A classmate says the pooled slope confirms that metabolic rate is set by the branching geometry of blood vessels, as one well-known network model (West, Brown and Enquist, 1997) proposes. What does each slope tell you, and what would you say to your classmate?
Saved in this browser only.
One way to do it
Each slope is an estimate of b for that set of animals. Within rodents, a 100-fold rise in mass predicts about 1000.70, roughly 25 times the total rate (100 is 10², so 1000.70 = 101.4); within birds, about 1000.68, roughly 23 times. The pooled slope is a different quantity. Adding shrews and whales stretches the mass range, and if the groups differ in their constant a, the line through all of them can be steeper or shallower than the line within any one group. At 0.76, a 100-fold rise predicts about 33 times the rate.
Before trusting any of the three, ask how the rates were measured (basal, field or maximal), at what temperature, and with what regression. Related species are not independent points, so a phylogenetic regression may give a different slope from an ordinary one; see reading phylogenetic trees.
To your classmate: a slope near 3/4 is consistent with the network model, but so are other explanations, and the within-group slopes here are nearer 2/3. A fitted number cannot confirm a mechanism. Testing one would need a prediction that rival explanations do not share, checked in data collected under the same conditions.
Does a lower rate per kilogram rescue a big body?
Predict. On the 3/4 fit, a kilogram of human burns about a seventh of what a kilogram of mouse burns, and the depth table says slower tissue is supplied more deeply. Could that let a human-sized body shaped like a mouse live on diffusion through its skin?
Check your prediction
No; it helps, but far too slowly. Reach grows only with the square root of the drop in demand. From mouse to human the body gets about 13 times wider (2,3331/3), but the reach grows only about 2.6-fold on the 3/4 fit (the square root of 7), and about 3.6-fold with b = 2/3 (the square root of 13).
And the outer surface? For bodies of one shape and one density, b = 2/3 would keep demand per unit of outer surface constant with size, and b = 3/4 would raise it about 1.9-fold from mouse to human. That does not mean skin could supply a mammal, whose oxygen enters through its lungs. Either way, the middle moves away faster than reach grows. The one idea again: for the same shape, a bigger body means a longer path, so bodies stay thin, add inner surface or pump fluid. Next, metabolic rate meets body temperature in thermoregulation.
Going deeper
The sphere’s ratio, step by step
For a sphere of radius r, surface area over volume is 4πr² / (4/3 πr³) = 3/r. Here π (“pi”) is about 3.14, and it cancels: π over π is 1, 4 divided by 4/3 is 3, and r² over r³ leaves 1/r.
What t = L² / 2D does and does not measure
The formula gives a typical spread along one coordinate, not the time to fill a cell or the first arrival: some molecules arrive sooner, and evening out a whole region takes longer.
The depth model behind the table
The table uses an idealized steady-state model: uniform tissue using oxygen at a constant rate Q per unit volume, surface oxygen held at air’s P = 0.21 atm, no internal supply or carrier-bound oxygen, and the centre just reaching zero. Then the largest ball radius is √(6KP/Q) and the largest sheet half-thickness √(2KP/Q), so their ratio is √3. K is Krogh’s diffusion constant, the diffusion coefficient times oxygen’s solubility in tissue: 1.4 × 10⁻⁵ mL O₂ per cm per min per atm. To use the table’s rates in mL O₂ per g per hour, take tissue density as 1 g per cm³ and divide by 60 to get Q per cm³ per minute. The human figure of about 0.2 is a resting oxygen use of about 250 mL per minute spread over 70 kg.
Since rate per kilogram goes as Mb − 1, reach grows as M^((1 − b)/2), against a body radius growing as M1/3, assuming one shape, constant density, K and P, and tissue demand in step with the whole body’s rate per kilogram.
Stores barely help. Tissue in equilibrium with air would hold about 0.0045 mL of dissolved O₂ per mL, an upper bound, lasting about 1.3 minutes at the resting human rate, about 11 seconds at seven times that, and about 5 minutes at the table’s slowest rate. Real tissue oxygen and carrier-bound stores differ.
More on the exponent
Allometry is the study of how a trait changes with body size when it does not change in simple proportion. Griebeler and Werner (2016), comparing ordinary and phylogenetic regression across 17 mammalian orders, found no single exponent for all the groups.
A limit with exceptions
These limits are conditional. Volland and colleagues (2022) described a bacterium, Candidatus Thiomargarita magnifica, whose cells averaged more than 9,000 um long: shape and internal arrangement can push a single cell far beyond the usual size.
Your notes
Select any text in the lesson to highlight it or add a note to it. Your highlights and notes are saved in this browser and collected in your notebook.
This browser is not letting the site save anything (a private window or strict privacy settings), so highlights and notes will be lost when you leave the page.
How we measure it
Respirometry and indirect calorimetry
Measure how fast an animal consumes oxygen (or produces carbon dioxide) while it rests in a chamber, then convert the gas exchange into a rate of energy use. Done under standard conditions (adult, at rest, fasted, thermoneutral), it gives a basal metabolic rate that can be compared across species.
Comparative regression on log-log axes, ordinary and phylogenetic
Plot the logarithm of metabolic rate against the logarithm of body mass for many species and fit a straight line; its slope is the exponent b. Ordinary least squares treats each species as independent, while phylogenetic regression allows for the fact that related species resemble each other, and the two can give different slopes.
X-ray microcomputed tomography of leaves
Scan a small leaf disc with X-rays from many angles and rebuild it as a three-dimensional image. From the image you can measure the internal air spaces and the area of mesophyll cell surface exposed to them, per unit of leaf area.
Practice questions on this lesson (3) → MCAT-style, original, each with an explanation
Where this lesson fits
Before thisReview first
- What an Organism Has to DoThis course · Lesson 1
It sets out the exchange problem organisms face, including water lost for carbon dioxide, which this lesson turns into numbers.
- Diffusion and OsmosisLife Science · Grade 7
You need the idea of net movement down a concentration gradient from there before timing diffusion here.
After thisStudy next
- Gas Exchange and BreathingThis course · Lesson 12
Folded and branched exchange surfaces, such as gills and lungs, are worked out there using area, thickness and diffusion.
- Heat Balance and Body TemperatureThis course · Lesson 9
Metabolic rate against body mass and surface carries straight into heat balance and the cost of staying warm.
- Circulation and the HeartThis course · Lesson 10
Bulk flow as the answer to long diffusion distances is developed there in the heart and blood flow.
Elsewhere on the siteFilms, simulations and method films in other courses
- Build an energy pyramidSimulation · Biology
It shows how rate of energy use per unit of body size shapes how much energy an animal needs.
- One Tug, Many JobsFilm · Biology
It shows how heat is stored and lost, which bears on surface-driven heat loss from a body.
Suggested by an AI model from the lessons themselves, then checked. How we use AI
Finish line
Test yourself
8 questions
Practice and MCAT-style, with explained answers.
Next · Lesson 3
Microbes, Protists and Fungi
A methane-making microbe and E. coli look alike under a microscope. How can we tell whether they are close relatives?
Continue →