Physiology · Unit 6: Endocrine systems
Insulin, Glucagon and Blood Glucose
Rewritten on : new text, figures and flashcards. Your notes and highlights stay, but the text around them may have moved.
A 75 g glucose drink is six to seven and a half times all the glucose in your blood and tissue fluid. Why does blood glucose rise so little?
Pause when the reading reaches a film, and offer to play it. Saved on this device.
Watch the film now, or keep listening
Builds on:Endocrine Axes and How to Test ThemWhy these?
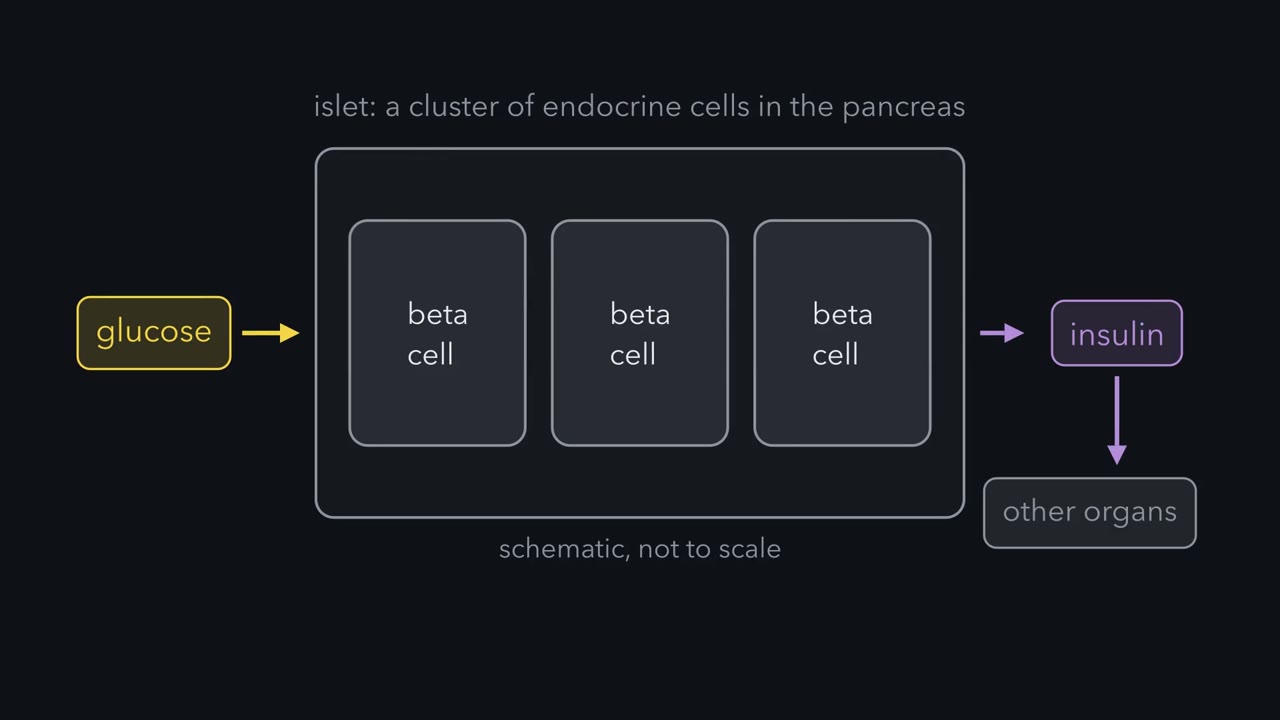 ▶ Watch A Beta Cell Burns Glucose to Read It · 2:45
Read the transcript of “A Beta Cell Burns Glucose to Read It”
Film transcript: A Beta Cell Burns Glucose to Read It
An islet is a cluster of endocrine cells in the pancreas. Its beta cells secrete insulin. Raise the glucose around them, and insulin comes out. Insulin then changes how glucose moves between organs. But first, a question. How does glucose become an electrical signal? Here is the working answer. The cell reads glucose by burning it. Glucose enters the beta cell. Mouse beta cells take it up through a transporter called GLUT2. In isolated nondiabetic human beta cells examined in 1995, GLUT1 predominated. Predominance does not mean exclusivity. Inside, an enzyme called glucokinase adds a phosphate to glucose. In a working model, this step sets the rate of glucose metabolism.
Further metabolism raises ATP relative to ADP. The model connects that rise to the closure of KATP channels. These are potassium channels that are sensitive to nucleotides inside the cell. With the channels closed, there is less outward potassium current. That favors depolarization, a shift to a less negative membrane potential. Then voltage-gated calcium channels open, and calcium enters the cell. Once calcium enters, exocytosis follows. In exocytosis, a granule fuses with the surface membrane. The fusion releases insulin. Now read the chain once more. Glucose is metabolized. ATP rises relative to ADP. KATP channels close. The membrane depolarizes.
Calcium enters. Insulin is released. This is the trigger; other signals amplify it. How can we test whether metabolism links glucose to the channel? In 1984, Ashcroft, Harrison and Ashcroft recorded single channels in isolated rat beta cells. In cell-attached patch clamp, a pipette seals against a patch of membrane while the cell stays intact. A potassium channel that was active at low glucose closed when glucose increased. The closure required glucose metabolism. That argued against glucose binding outside the cell as a sufficient explanation. What did that show? It supported a metabolic link to depolarization in this rat preparation. It did not identify ATP as the messenger.
It did not establish the entire secretion sequence. Separately, Cook and Hales reported ATP inhibition from the cytoplasmic side of excised beta-cell membrane patches. Together, the experiments support the metabolic channel model. Keep the rule. A beta cell reads glucose by burning it.
Drink 75 g of glucose, the standard test dose, and you swallow six to seven and a half times all the glucose dissolved in your blood and the fluid around your cells. Yet in a healthy person blood glucose rises from about 90 to a peak near 140 to 160 mg/dL, and is back below 140 within two hours.
Nearly all that sugar leaves the blood about as fast as it arrives. One cell measures it, two hormones move it, and the gut sends a warning ahead.
The film at the top covers only the section “A beta cell reads glucose by burning it.” The basic endocrine loop is in the endocrine system.
Blood glucose is a balance, not a tank
Glucose spreads through plasma and the fluid between cells. At a fasting level of 90 mg/dL (5 mM), that pool holds about 10 to 12 g in an adult; the blood itself holds about 4 to 5 g, roughly a teaspoon.
Predict. If none of a 75 g drink left the blood, how high would blood glucose go?
Check your prediction
Roughly 600 mg/dL higher. The pool spreads over about 1.6 to 1.9 dL of fluid per kilogram of body mass, so in a 70 kg adult, 75 g would raise glucose by about 560 to 670 mg/dL. The real peak is near 140 to 160. That figure is a ceiling that treats all 75 g as arriving at once; absorption actually takes about two hours, and the liver takes up some on first pass. Still, disposal is what holds the peak down: something removes glucose almost as fast as the gut delivers it.
The pool also empties all the time. After an overnight fast the liver adds about 2 mg of glucose per kilogram per minute (about 140 mg a minute at 70 kg), and the tissues remove the same amount, so the whole pool is replaced in roughly an hour and a quarter.
So blood glucose is not a tank. It is the level where two flows meet. Appearance is glucose entering the blood: from the gut after a meal (the liver still adds some), otherwise from the liver, with a smaller share from the kidney. Disposal is glucose leaving into tissues that burn or store it. When appearance runs ahead, the level climbs.
The one idea to carry through this lesson. Blood glucose stays level only while glucose entering the blood equals glucose leaving it. Insulin pushes that balance down from both sides at once: the liver releases less, and muscle and fat take up more. Glucagon pushes the liver back toward releasing.
The rule covers adults over minutes to hours with glucose below the kidney’s threshold, about 180 mg/dL, so almost none is lost in urine. Insulin is the main lever, not the only one (Going deeper, “What the rule leaves out”).
One puzzle is saved for later: the same blood glucose, reached by vein instead of by mouth, releases much less insulin.
A beta cell reads glucose by burning it
An islet is a cluster of endocrine cells in the pancreas; its beta cells secrete insulin. Glucose enters by facilitated diffusion (membrane transport): mainly through GLUT2 in mouse beta cells, while GLUT1 predominated over GLUT2 in the isolated nondiabetic human beta cells de Vos and colleagues examined in 1995 (predominance, not exclusivity).
Why burning can measure
Most cells start glucose metabolism with hexokinase, half-saturated at about 0.05 mM. If a cell’s glucose matched the blood’s, hexokinase would be more than 98% saturated at fasting levels and above, so its rate would barely change with the blood level. Beta cells use glucokinase, half-saturated near 8 mM.
| Glucose | Hexokinase (share of top rate) | Glucokinase (share of top rate) |
|---|---|---|
| 3 mM (54 mg/dL) | 98% | 16% |
| 5 mM (90 mg/dL) | 99% | 31% |
| 8 mM (144 mg/dL) | 99% | 50% |
| 12 mM (216 mg/dL) | over 99% | 67% |
Calculated from a hexokinase half-saturation of 0.05 mM and a glucokinase half-saturation of 8 mM with a Hill coefficient of about 1.7.
Glucokinase works on the steep middle of its curve: double glucose from 5 to 10 mM and glucokinase nearly doubles its rate (×1.9); hexokinase barely moves (×1.005). In the standard sensing model glucokinase’s step sets the rate of beta-cell glucose metabolism, so burning follows the blood level: a measurement.
From fuel to a signal
- Faster glucose metabolism raises ATP relative to ADP.
- The rise closes KATP channels, potassium channels sensitive to nucleotides inside the cell.
- Less outward potassium current favors depolarization, a shift to a less negative membrane potential.
- Voltage-gated calcium channels open, and calcium enters.
- Calcium triggers exocytosis: insulin granules fuse with the surface membrane and release insulin.
This is the triggering pathway (the film calls it the trigger). Other signals amplify it: further metabolic signals, and cAMP from hormones such as the incretins, raise how much insulin that calcium releases. Voltage principles are in resting membranes and action potentials; fusion machinery is in synaptic transmission.
The evidence: in 1984 Frances M. Ashcroft, Donna E. Harrison and Stephen J. H. Ashcroft recorded single channels in isolated rat beta cells by cell-attached patch clamp (a pipette sealed against a membrane patch of an intact cell). A potassium channel active at low glucose closed when glucose rose, and closure required glucose metabolism. Separately, Cook and Hales reported ATP inhibiting the channel from the cytoplasmic side of excised patches. Where that ATP comes from is still argued over (Going deeper, “Where the ATP comes from”).
Reconstitution supports a channel built from Kir6.2 and SUR1. Sulfonylureas, type 2 diabetes drugs, close it; diazoxide, used for low blood glucose caused by excess insulin, opens it.
Predict. What does each drug do to insulin release?
Check your prediction
A sulfonylurea closes the channel without waiting for ATP to rise, so the cell depolarizes and releases insulin even when glucose is not high: it skips the reading step. Diazoxide holds the channel open, so the cell cannot depolarize and releases less insulin even when glucose is high.
Insulin comes in two phases
Hold glucose high and steady (a hyperglycemic clamp) and insulin does not come out flat. DeFronzo, Tobin and Andres reported an early burst within the first six minutes in their 1979 human experiments, then a progressively increasing second phase while the stimulus remains.
Insulin says store, glucagon says release
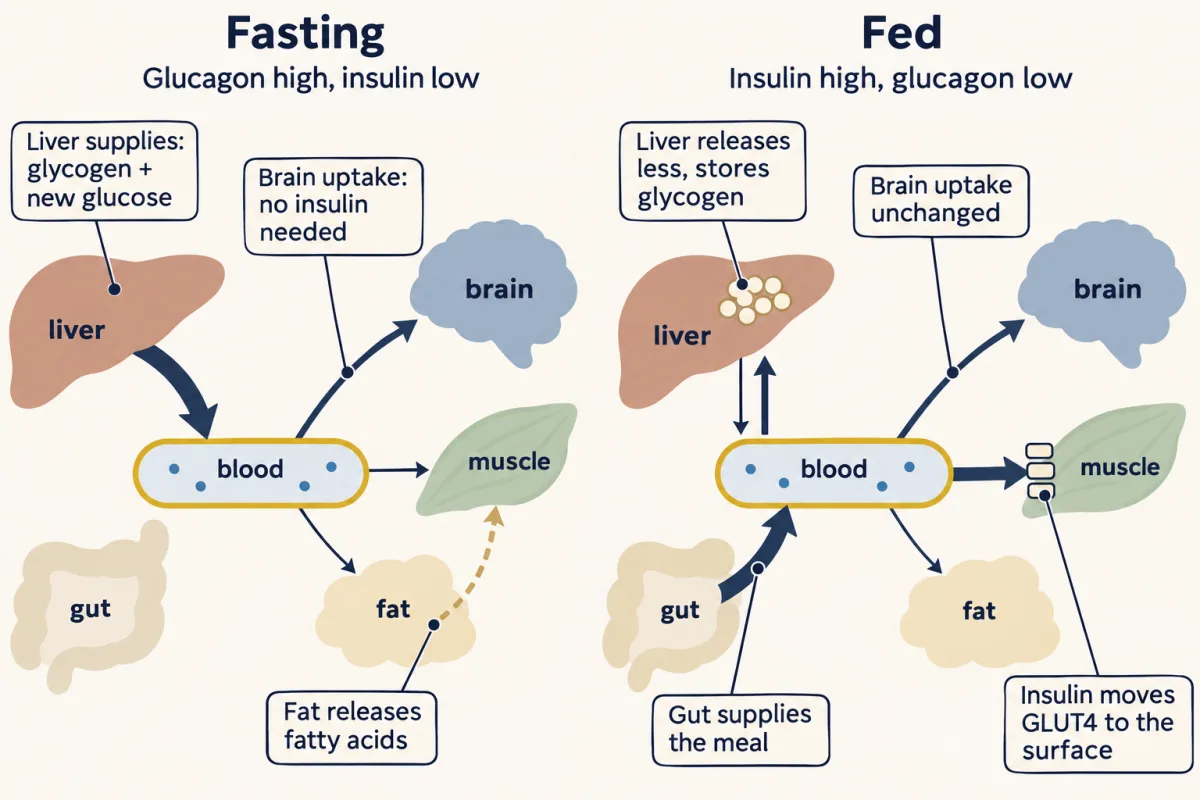
The brain does not wait for insulin. It draws about 120 g of glucose a day whatever insulin does, about half or more of the glucose leaving the blood after an overnight fast. So between meals supply cannot switch off: if the liver stopped while uptake continued at the fasting rate, glucose would fall from 90 to 50 mg/dL in about half an hour (32 to 38 min at the fasting uptake rate; the fastest case, since uptake slows as glucose falls).
Fasting: the liver supplies
Between meals insulin is low and glucagon relatively high. The liver supplies what the tissues use by breaking down glycogen (glycogenolysis) and building new glucose from lactate, amino acids and glycerol (gluconeogenesis; see gluconeogenesis). Glucagon drives that output through liver receptors that signal via Gs and cAMP–PKA; its quick effect is mostly on glycogen breakdown.
Low insulin matters as much as high glucagon: fat cells then break stored triglyceride into fatty acids and glycerol (lipolysis). Muscle and liver burn the fat, sparing glucose for the brain, and the liver turns part of it into ketone bodies (integration of metabolism).
Fed: the body stores
After a carbohydrate-rich meal insulin rises, glucagon falls, and insulin works on both sides at once.
- Supply falls. The liver sharply cuts its glucose release and stores glucose as glycogen (human liver experiments). A small rise in insulin turns the liver down first: it needs lower concentrations than uptake elsewhere does.
- Removal rises. Through its receptor, a receptor tyrosine kinase (PI3K–Akt–insulin signaling), insulin moves GLUT4 transporters from internal vesicles to the surface of muscle and fat cells (human muscle biopsies). Muscle takes roughly four-fifths of the extra uptake in insulin-clamp studies, storing much of it as glycogen. Fat takes a small share; its bigger insulin job is shutting off lipolysis.
Predict. Muscle holds several times the liver’s glycogen (about 400 g against about 100 g). During an overnight fast, can muscle glycogen keep blood glucose up?
Check your prediction
No. Glycogen breaks down to glucose 6-phosphate, and only a cell with glucose-6-phosphatase can remove the phosphate and let free glucose out. The liver (and kidney) has it; muscle does not, so muscle glycogen fuels only the muscle.
The liver’s transporter, GLUT2, needs no insulin and lets glucose cross either way; which way depends on whether the liver is storing or releasing. Transport and net hepatic glucose output are different things.
| Tissue | Insulin (fed) | Glucagon (fasting) |
|---|---|---|
| Liver | Cuts glucose release; builds glycogen | Raises glucose release: glycogen breakdown and new glucose synthesis |
| Skeletal muscle | Moves GLUT4 to the surface; takes most of the insulin-stimulated uptake; builds glycogen | Little or no direct effect* |
| White fat | Moves GLUT4 to the surface (small share of uptake); shuts off lipolysis | Little direct effect at normal concentrations* |
| Brain | Not needed for glucose uptake | No direct effect on glucose uptake |
*The human evidence, and its limits, is in Going deeper, “Glucagon outside the liver.”
So the hormones are not mirror images. Among the fuel-handling tissues, insulin acts on liver, muscle and fat; glucagon acts essentially on the liver. The liver is where they meet.
What sets glucagon
Alpha cells release glucagon by calcium-dependent exocytosis. Low glucose may stimulate them through their own electrical sensing and autonomic nerves; amino acids can stimulate them through a liver–alpha-cell feedback loop. As glucose rises, neighbors hold them back by paracrine (local, cell-to-cell) signals: in human islet experiments, insulin from beta cells and somatostatin from neighboring delta cells did this (Going deeper, “Alpha cells in and out of the islet”). After a carbohydrate meal, rising insulin may help hold glucagon down through these local signals, alongside the direct effect of glucose.
When glucose falls, the defenses come in order: insulin secretion falls first, then glucagon and epinephrine rise, and cortisol and growth hormone help over hours. The fast defenders mostly raise the liver’s supply; falling insulin and rising epinephrine also slow uptake by muscle and fat.
The gut sends word ahead: incretins
Back to the saved puzzle. An incretin is a gut hormone that amplifies glucose-stimulated insulin secretion. The same dose by vein would not give the same blood glucose curve, so instead an intravenous infusion on another day copies the curve the oral dose produced: an isoglycemic comparison.
Predict. Oral glucose releases more insulin than the matched infusion, though the beta cell saw the same glucose. What does the extra insulin tell you?
Check your prediction
Something besides blood glucose reached the beta cell, and it came with the oral route. That extra response is the incretin effect. It is attributed to feed-forward signals, chiefly gut hormones, sent while the meal is still being absorbed, that make the beta cell answer louder.
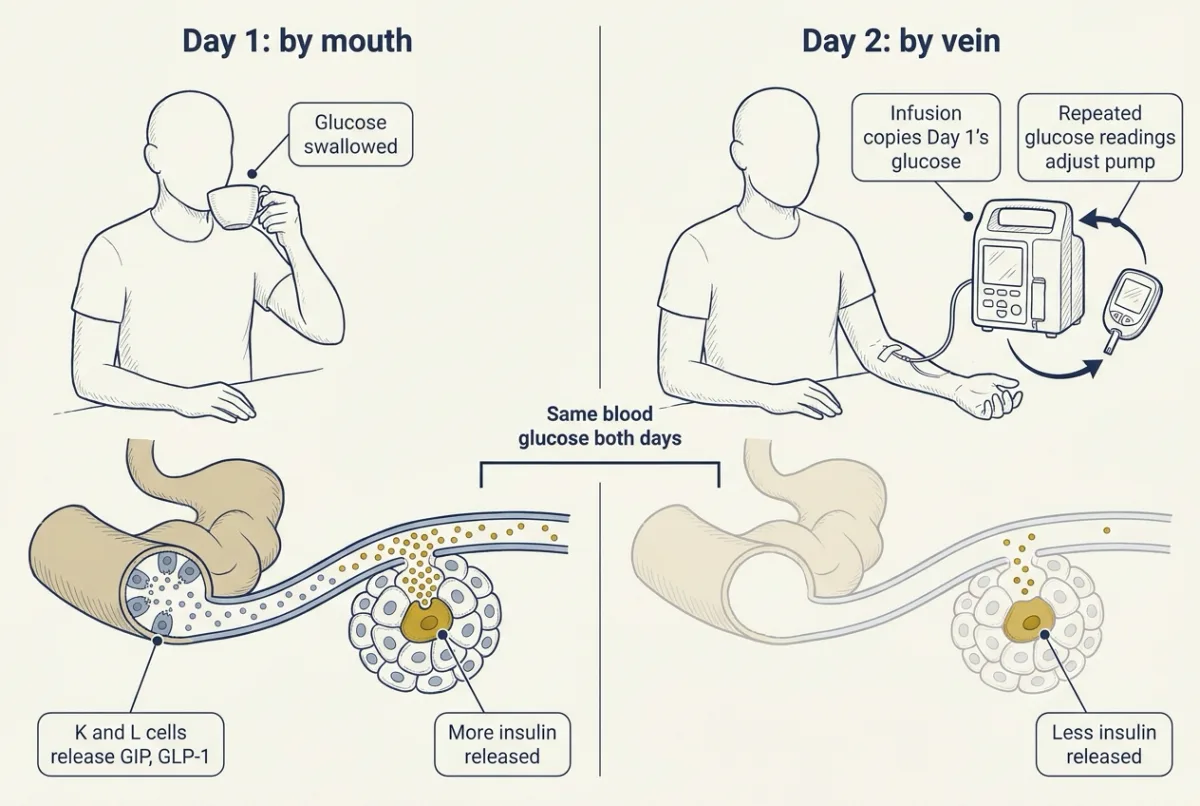
Oral and intravenous comparisons date to the 1960s. In 1986 Nauck, Stöckmann, Ebert and Creutzfeldt made the matched-glucose comparison in people with and without type 2 diabetes: incretin factors accounted for 72.8 ± 6.9% of the total insulin response in eight metabolically healthy controls and 36.0 ± 8.8%, roughly half that, in the 14-member type 2 diabetes cohort. These cohort estimates are not universal fractions; they show reduced oral-route amplification but do not locate the change in hormone supply or beta-cell responsiveness.
To compute the effect, use the area under the curve (AUC), which integrates concentration over time. In a made-up isoglycemic comparison, incremental insulin areas above baseline are 10,000 and 3,000 pmol per L x min after oral and intravenous glucose. Assuming equal insulin clearance:
Incretin effect = (oral AUC minus intravenous AUC) / oral AUC x 100%.
Subtract to get 7,000; divide by 10,000 to get 0.70; multiply by 100% to get 70%. That is near the 1986 control estimate, but insulin-based and C-peptide-based estimates can differ.
Two hormones carry the signal: GIP, glucose-dependent insulinotropic polypeptide, from intestinal K cells, and GLP-1, glucagon-like peptide 1, from L cells (gut hormones). Both receptors recruit Gs and cAMP, amplifying glucose-stimulated secretion rather than triggering it alone. In 18 healthy men, blocking each receptor (receptor blockade) during oral glucose testing showed that both contribute, GIP more than GLP-1, and that their effects roughly add; GLP-1-receptor blockade, alone or combined, also raised glucagon and sped gastric emptying, so GLP-1’s role reaches beyond insulin (Going deeper, “Splitting the incretin effect”).
Measuring it: secretion versus action
An oral glucose tolerance test (OGTT) follows glucose, and when measured the hormones, after the 75 g drink. The curve integrates absorption, secretion and insulin action. Reduce secretion and muscle and fat uptake fall while hepatic output rises, so glucose climbs higher; reduce tissue insulin action, holding insulin constant, and the same directions follow.
Predict. Two people have the same raised glucose curve after the drink. One secretes half the normal insulin; the other secretes normally but their tissues respond half as well. What tells them apart?
Check your prediction
Their insulin. In a simple model of the drink test, where insulin’s effect is action times insulin, halving secretion and halving action give identical glucose curves, but the second person’s insulin runs about twice the first’s: below normal in the first, normal or above in the second. In real people the beta cell also compensates for low action by secreting more, so glucose can stay normal for years until secretion fails.
Peripheral insulin also reflects removal by the liver. C-peptide, the connecting peptide cut from proinsulin, is released one-for-one with insulin and undergoes little hepatic extraction, so it tracks secretion more closely.
Type 1 diabetes usually involves profound secretion loss; type 2 combines inadequate secretion with frequently reduced insulin action. Neither label identifies one universal signaling lesion. With almost no insulin, as in untreated type 1 diabetes, the liver keeps releasing glucose and unchecked lipolysis feeds fast ketone-body production: the basis of diabetic ketoacidosis.
The clamp: the balance made into a measurement
To measure insulin action alone, a hyperinsulinemic-euglycemic clamp holds insulin at a raised plateau while a pump adds glucose, adjusted by feedback from repeated measurements, to keep plasma glucose near basal. Glucose is not changing, so glucose in equals glucose out:
At steady state: Rd = J + endogenous glucose production (EGP), with every term in mg per kg per min.
Rd is whole-body disposal; J is the pump rate, the external glucose appearance; endogenous glucose production (EGP) is glucose entering from internal sources, mostly the liver. The equation holds when urinary glucose loss is negligible. A tracer, distinguishably labeled glucose, can estimate EGP separately. Insulin cuts the liver’s output but may not stop it, so EGP has to be measured, not assumed.
Worked problem: account for every source
These made-up analyzed clamp data describe two healthy adults at matched steady insulin and glucose, with negligible urinary glucose loss. External glucose appearance, J, is 5.71 mg per kg per min in A and 2.86 mg per kg per min in B. Fluxes are divided by body mass so people of different sizes can be compared: a pump delivering 400 mg per min into a 70 kg adult is 400 / 70 = 5.71 mg per kg per min.
First assume EGP is zero. Then A’s Rd is 5.71 and B’s is 2.86 mg per kg per min. B/A = 2.86 / 5.71 = 0.501, approximately half. B shows lower insulin-stimulated disposal under these matched conditions; the result does not identify an intracellular defect.
Now a tracer detects A’s EGP at 0.50 mg per kg per min. Add the sources: Rd = 5.71 + 0.50 = 6.21 mg per kg per min, so reading J alone underestimates disposal by 0.50. At fixed Rd, continuing EGP reduces the external input required to hold glucose steady.
- External glucose J = Rd − EGP
- Pump rate = J × mass ÷ 200 mg per mL
- Disposal Rd = J + EGP (check)
The same pump rate in two people
- At 50 kg
- At 100 kg
In this sketch: steady state at matched insulin and glucose in a healthy adult, with negligible urinary glucose loss, as in the lesson’s made-up worked problem; the starting values Rd 6.21 and EGP 0.50 mg per kg per min are that problem’s person A. Made up for the sketch: the slider ranges (the top of the Rd range, 11, follows the 10–11 mg per kg per min maximal utilization that Rizza, Mandarino and Gerich found in healthy humans in 1981, a preparation-specific result), body masses of 50 to 100 kg, and the infusate fixed at 20 percent glucose, 200 mg per mL. The pump rate in mL per min is a unit conversion made up for the sketch; the lesson gives only mg per kg per min. Arrow widths are roughly proportional to flux; there is no time course and no insulin dose-response curve.
This is the lesson’s balance with the meal replaced by a pump: glucose holds steady only while what enters (J + EGP) equals what leaves (Rd). Insulin pushes both sides, raising Rd and lowering the liver’s EGP, but may not stop EGP, so the pump rate J equals disposal only if EGP is truly zero and urinary losses are negligible.
Design problem
Nauck’s comparison leaves hormone supply and responsiveness unresolved. Design experiments using plasma from volunteers with and without type 2 diabetes and isolated human donor islets to distinguish lower gut-hormone availability from lower beta-cell responsiveness. Specify controls and the outcomes that would support each mechanism.
Saved in this browser only.
One way to do it
Measure circulating GIP and GLP-1 during oral glucose experiments in volunteers with and without type 2 diabetes. For a controlled supply test, compare paired plasma samples with selective hormone depletion and sham depletion, verifying glucose and other measured constituents remain matched. Lower circulating concentrations alone would not prove lower secretion, because clearance also matters.
For responsiveness, expose paired donor-islet aliquots to identical glucose and matched GIP or GLP-1 concentrations, with hormone-free controls and randomized condition order. Measure insulin release and normalize to insulin content and viable beta-cell mass. Compare untreated aliquots with aliquots having experimentally reduced receptor signaling. Less amplification at equal hormone availability supports reduced responsiveness; if depleting the hormone from a sample removes amplification and add-back restores it, the hormone in that sample carries the effect; lower hormone concentrations in samples from people with type 2 diabetes would then point to a supply effect. Both can occur.
As a historical lead, Nauck and colleagues in 1993 compared infused GIP and GLP-1 under the same clamped glucose in nine people with mild type 2 diabetes and nine matched controls: the maximum effect of GIP was 54% lower in the patients, whereas GLP-1 kept much of its effect (71% of the control increment in C-peptide, not a significant difference). GLP-1, but not GIP, also lowered glucagon in both groups. Receptor blockade during healthy-volunteer oral testing can additionally test endogenous contributions. Islet isolation removes neural and vascular context; depletion may remove other factors. Prior glucose exposure can also change responsiveness: in a 2009 study of eight obese people with type 2 diabetes, four weeks of near-normalized glucose raised the later-phase insulin response to infused GIP and to infused GLP-1 several-fold (Højberg and colleagues, Diabetologia 52:199–207), so donor history and culture conditions also require control.
In one line: the beta cell reads glucose by burning it, insulin tips both sides of the balance toward storage, glucagon tips the liver back, and the gut makes the beta cell answer louder. Diabetes is that balance failing through secretion, action or both, and the glucose curve alone cannot tell you which.
Going deeper
The main line above does not depend on these details.
What the rule leaves out
Glucose itself also pushes both sides with insulin fixed, speeding uptake and slowing the liver’s output (glucose effectiveness). The rule leaves out exercise (contracting muscle moves glucose transporters to its surface without insulin), slow hormones such as cortisol and growth hormone, and long fasts.
The 1984 experiments
The 1984 rat experiment posed a fork: if extracellular glucose binding alone caused closure, metabolism would not be required. The potassium-selective channel closed only when glucose was metabolized, which supported a metabolic link to depolarization in this rat preparation and argued against binding alone. It did not identify ATP as the messenger (that was Cook and Hales’s separate excised-patch result) or establish the entire secretion sequence.
Earlier, Noma’s 1983 report found that intracellular ATP depressed potassium channels in cyanide-treated mammalian heart cells; neither beta-cell paper by itself establishes priority across tissues. Later work by Gloyn and colleagues linked activating variants of the channel component Kir6.2 to impaired insulin secretion (see the scientist notes on Frances Ashcroft).
Where the ATP comes from
ATP rising relative to ADP and closing the channel is the standard model. A 2022 review by Merrins, Corkey, Kibbey and Prentki (Cell Metabolism) argues that the version in which an early rise in mitochondrial ATP drives channel closure and calcium entry is incomplete, and proposes that ATP made by pyruvate kinase near the channel matters more. Treat the steps from channel closure onward as firm and the ATP source as open.
Two phases at the membrane
Ohara-Imaizumi and colleagues used total internal reflection fluorescence (TIRF) microscopy, which selectively images fluorescent structures close to the cell surface. In normal primary rat beta cells in their 2004 study, early fusion mostly involved granules already present at the membrane, which they called docked; second-phase fusion mostly involved newcomer granules. Later TIRF work found that newcomers fusing immediately on arrival also contribute to the first phase, so the split is not strict, and rat data do not establish that every human granule follows it.
From blood insulin to secretion
C-peptide’s one-for-one release with insulin and its low hepatic extraction are consistent with human secretion measurements and clearance research. Deconvolution estimates secretion from a concentration time course using a kinetic model of removal. C-peptide deconvolution estimates prehepatic insulin secretion; it is not a direct count of released granules. The portal-liver context is in absorption and the liver.
The liver’s dose response
Rizza, Mandarino and Gerich’s 1981 healthy-human study found half-maximal production suppression at 29 ± 2 microU per mL insulin, complete suppression near 60 microU per mL, and maximal utilization of 10–11 mg per kg per min. Half-maximal stimulation of glucose utilization needed about 55 microU per mL, roughly twice the concentration that half-suppressed production. These responses are preparation-specific; the organ-level picture draws on human and rodent experiments, and the tissue distinctions matter more than any single insulin value. When comparing clamps, compare the plateaus actually achieved, not the intended ones.
Glucagon outside the liver
A 2019 review found no support for direct glucagon-receptor signaling in human muscle. In Gravholt and colleagues’ 2001 experiment, microdialysis (a method that samples local interstitial substances) in seven healthy young men detected no increased abdominal subcutaneous lipolysis with physiological-range glucagon, under somatostatin and hormone replacement that controlled the endocrine background. Keep that negative result within its tested depot and conditions; it does not test every adipose depot, concentration or species.
Alpha cells in and out of the islet
Omar-Hmeadi and colleagues in 2020 compared dispersed human alpha cells with intact donor islets. Dispersed cells showed a V-shaped glucose–exocytosis curve; raised glucose inhibited exocytosis in intact nondiabetic islets. In type 2 diabetes donor islets, 10 mM glucose no longer inhibited exocytosis, although 7 mM still did; inhibition at raised glucose was also lost after blocking the inhibitory effects of paracrine insulin or somatostatin. Reduced surface somatostatin-receptor-2 expression suggested one resistance mechanism. This supports local inhibition without proving it is the only mechanism in vivo.
The two cell types also cooperate. Capozzi and colleagues’ 2019 experiments found that disrupting proglucagon-peptide signaling reduced stimulated insulin secretion in mouse and human islets, with lower beta-cell cAMP demonstrated in mice.
Splitting the incretin effect
Gasbjerg and colleagues tested separate contributions in 18 healthy men in 2019. Each man had oral glucose tests, in randomized double-blind order, with GIP-receptor blockade, GLP-1-receptor blockade, both, or saline. If one hormone accounted for nearly all amplification, blocking its receptor alone should approach the dual-blockade effect.
Their secretion index was the ratio of C-peptide to glucose. Combined blockade reduced it by 37 ± 16%; GIP-receptor blockade alone reduced it by 30 ± 17%, both mean ± SD relative to saline. GLP-1-receptor blockade alone reduced it by 8.6 ± 16%; the single effects (30 and 8.6) roughly add up to the combined effect (37), which is what the authors mean by additive, with the larger contribution from glucose-dependent insulinotropic polypeptide (GIP) in this preparation. The factorial crossover design tests each receptor with the other varied, removes between-person differences, and blinding limits expectation bias. A ratio index is not a secretion flux. Incomplete blockade and different glucose trajectories limit inference, and these shares cannot be assigned unchanged to women or mixed meals. Dividing 30 by 37 does not establish a universal GIP percentage.
Your notes
Select any text in the lesson to highlight it or add a note to it. Your highlights and notes are saved in this browser and collected in your notebook.
This browser is not letting the site save anything (a private window or strict privacy settings), so highlights and notes will be lost when you leave the page.
How we measure it
Cell-attached patch clamp
Seal a pipette against a membrane patch and record individual channel openings while the cell remains intact. In isolated rat beta cells, this links changes in glucose metabolism to channel activity without removing the cytoplasmic environment.
Total internal reflection fluorescence microscopy
TIRF microscopy selectively excites fluorescent granules near the cell surface. Time-lapse imaging distinguishes granules already visible near the membrane from newcomers that appear during recording. Early studies called the pre-existing granules docked; being visible does not by itself show molecular docking.
Isoglycemic oral–intravenous comparison
Reproduce an oral glucose experiment's plasma glucose trajectory intravenously on another day. Comparing insulin or modeled secretion responses estimates the extra response associated with the oral route at matched glucose.
Hyperinsulinemic-euglycemic clamp
Maintain an elevated insulin plateau and adjust glucose delivery by feedback to hold basal plasma glucose. At steady state, external glucose entry equals disposal only if endogenous production is suppressed and urinary losses are negligible; a glucose tracer can estimate residual endogenous production.
Practice questions on this lesson (5) → MCAT-style, original, each with an explanation
Where this lesson fits
Before thisReview first
- Endocrine Axes and How to Test ThemThis course · Lesson 2
It teaches the basic hormone loop and how to test it, which this lesson applies to glucose.
After thisStudy next
- Exercise: The Whole Body at WorkThis course · Lesson 30
It shows muscle glucose uptake rising without insulin and how the liver matches supply to demand during work.
- Absorption, the Liver and Enterohepatic CirculationThis course · Lesson 24
It covers portal delivery and the liver's handling of absorbed glucose, which sets the supply side of the balance.
- Gut Motility, Secretion and Gut HormonesThis course · Lesson 23
It covers gut hormones and gastric emptying, which the incretin section ties to insulin release.
Elsewhere on the siteFilms, simulations and method films in other courses
- How cells pull reactions uphillFilm · Biochemistry
This explains the chain from glucose through ATP that a beta cell uses to read glucose by burning it.
- How the body switches fuelsFilm · Biochemistry
It shows how insulin and glucagon switch the liver, muscle and fat between fed and fasting fuel use.
- Michaelis–Menten plotterSimulation · Biochemistry
A low-affinity enzyme half-saturated near 8 mM, as glucokinase is, follows from Michaelis–Menten saturation.
- Not Glycolysis in ReverseFilm · Biochemistry
The liver's fasting glucose supply comes from building glucose, which this film shows is not glycolysis in reverse.
Suggested by an AI model from the lessons themselves, then checked. How we use AI
Finish line
Test yourself
10 questions
Practice and MCAT-style, with explained answers.
Next · Lesson 22
Calcium, Phosphate and Bone
Your kidneys filter about ten grams of calcium a day and you lose about a fifth of a gram in urine. What sets that last fraction?
Continue →