Biochemistry · Mechanisms and Inhibitors
New to this? Review it at high school level: Enzymes at Work
Enzyme Kinetics: The Michaelis–Menten Model
Rewritten on : new text, figures and flashcards. Your notes and highlights stay, but the text around them may have moved.
Why doesn't doubling the substrate keep doubling the rate? Enzymes saturate.
Pause when the reading reaches a film, and offer to play it. Saved on this device.
Watch the film now, or keep listening
Builds on:Basic Concepts of Enzyme ActionProtein Three-Dimensional Structure: The Sequence Sets the ShapeWhy these?
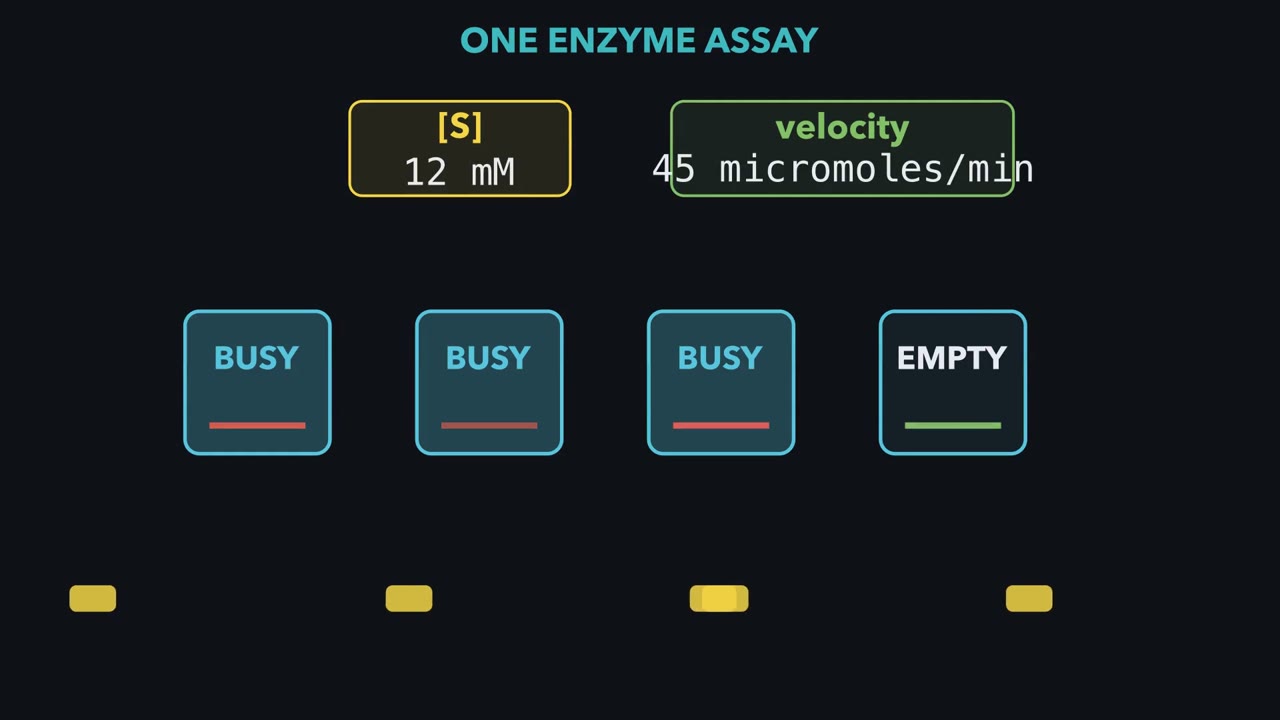 ▶ Watch Why doubling substrate stops doubling speed · 3:24
Read the transcript of “Why doubling substrate stops doubling speed”
Film transcript: Why doubling substrate stops doubling speed
Why can doubling an enzyme's substrate produce far less than double the product? Watch this enzyme make 45 micromoles per minute at 12 mM substrate. What happens at 24 In its simplest form, picture each enzyme as a toll booth with no waiting lane. A substrate car enters only an empty booth. A busy booth converts that car to product, then opens again. With little substrate, most booths stand empty. Nearly every extra car finds one, so adding substrate almost proportionally increases product flow. The limiting factor is arrivals, not the booths' working speed. Add more substrate, and empty booths become scarce.
Cars finding busy booths drive on and try again later. Product still flows, but each added car buys less extra speed. Here is the guiding idea. Velocity equals kcat, one busy enzyme's turnover pace, times the amount of busy enzyme. Substrate changes the busy amount, but it cannot make each busy enzyme work faster. Now transform the toll plaza into a graph. Substrate concentration runs across the bottom; initial velocity climbs upward. The moving car counter becomes points on the Michaelis-Menten curve, computed from the equation. Velocity equals Vmax times substrate concentration, divided by Km plus substrate concentration. The fraction is the share of enzyme that is busy.
As that share approaches one, velocity approaches Vmax. Km marks the substrate concentration where that busy fraction is one half. Therefore, velocity is half of Vmax there. Km is a half-speed point, not automatically a measure of binding affinity. Vmax is the speed approached when nearly every enzyme is busy. It equals kcat times total enzyme concentration. More substrate cannot raise that ceiling, but adding enzyme can. Return to our enzyme: Vmax is 60 micromoles per minute, and Km is 4 mM. At 12 mM, three quarters are busy, giving 45. At 24 about six sevenths are busy, giving roughly 51. Doubling substrate raised velocity only about 14 percent, because just one quarter of the enzyme was empty initially.
Far below Km, doubling substrate nearly doubles velocity. Near saturation, it barely helps. So ask how much enzyme is still empty before predicting a substrate effect. The curve bends because the busy fraction approaches one, not because catalysis stops. More substrate adds speed only by filling empty enzymes.
From the film
- In the simplest model, velocity equals kcat times the amount of busy enzyme.
- More substrate adds speed only by filling empty enzymes.
- Km is the substrate concentration at half Vmax, not automatically binding affinity.
- Vmax equals kcat times total enzyme concentration in the simplest model.
The film above follows an enzyme from 12 to 24 mM substrate and shows why velocity rises far less than twofold. Here we derive that curve, then extend it to assays, kcat/Km, reciprocal plots and inhibitors.
At any instant each enzyme is empty or busy (holding one substrate), and only busy ones make product, each at its fixed turnover number, kcat: substrate molecules one busy enzyme converts per second.
For inhibitors, the key extension is which pool they remove: free enzyme, busy enzyme or both.
Measuring the reaction: the assay and V₀
Thermodynamics tells you the destination: whether a reaction can happen. Kinetics tells you the journey: how fast. An enzyme first has to grab its substrate and hold it, forming a temporary enzyme–substrate (ES) complex, before converting it to product:
E + S ⇌ ES → E + P
Velocity is a slope: product formed per unit time. If the product (or substrate) absorbs light, a spectrophotometer reads the change continuously. Plot product against time and the line starts straight, then bends as substrate is depleted, product accumulates and interferes, and the enzyme loses activity. The one discipline that matters most: take the slope in the first moments, the initial velocity, V₀.
Repeat at several substrate concentrations and plot each V₀ against [S]. The points rise steeply, then level off: the record this lesson explains. Fitting that curve gives Km and Vmax, and from them kcat and kcat/Km.
Predict. Partway up that curve, where it has started to bend, you double the substrate. Does V₀ double?
Check your prediction
No. In the opening example, 12 to 24 mM raises V₀ by only about 14%. The next section works it out.
Building the curve: how much of the enzyme is busy
The velocity you measured is v = kcat × [enzyme–substrate (ES)], so the shape of the curve comes down to one question: how many enzymes are busy? An enzyme becomes busy in one way and stops being busy in two:
- In: substrate collides with an empty enzyme and sticks, at k₁[E][S]. More substrate means more collisions.
- Out, no product: the substrate falls back off, at k₋₁[ES].
- Out, with product: the enzyme converts it and lets the product go, at k₂[ES], and is empty again. In this simple scheme k₂ is kcat.
The film above shows the consequence: as empty enzyme becomes scarce and nearly every enzyme is busy (saturated), added substrate produces diminishing returns. Mechanistically, substrate speeds only the way in; it does nothing to either way out.
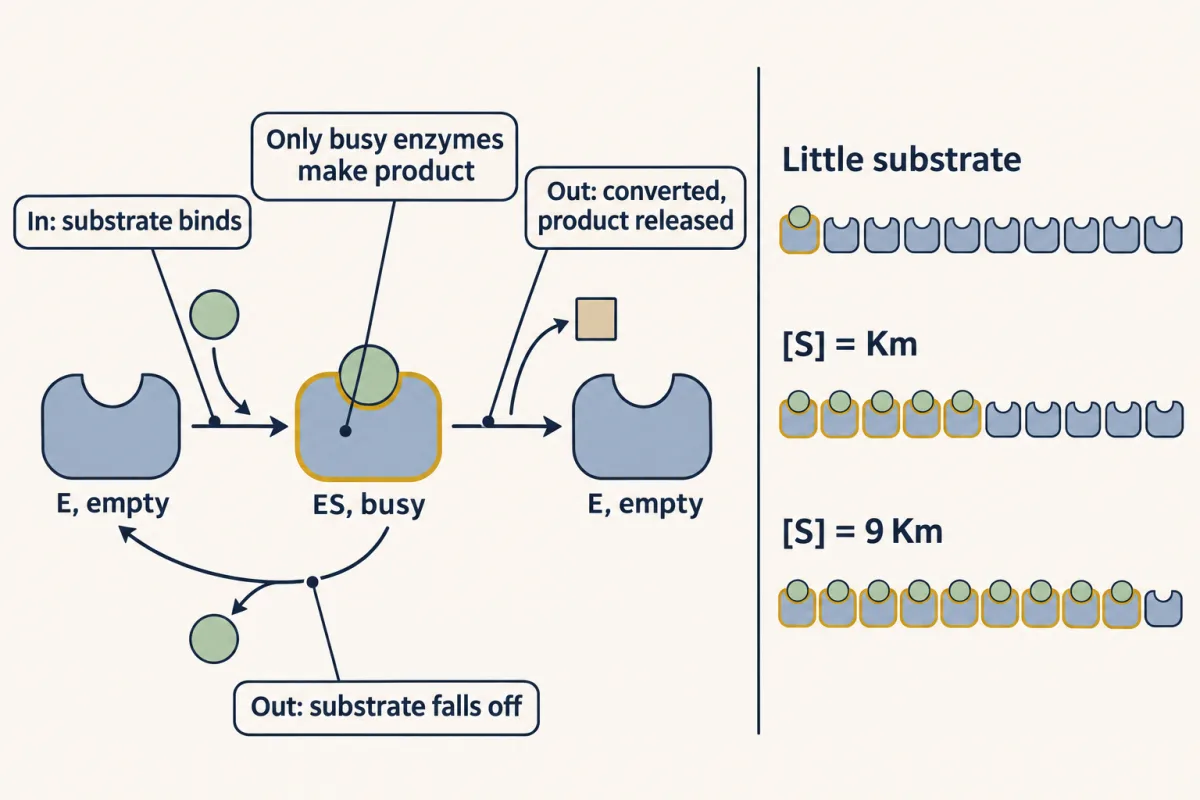
Soon after mixing, usually within milliseconds, enzymes become busy as fast as they stop being busy, and the number of busy enzymes holds steady. This steady state is the model’s central assumption. Measuring an initial velocity keeps the others true: [S] is still what you added, and there is not yet enough product to run the reaction backward or inhibit the enzyme. Five lines give the equation:
- Steady state, in = out: k₁[E][S] = (k₋₁ + k₂)[ES]. Both ways out depend only on [ES], so their rate constants add.
- Collect the rate constants into one number: [E][S] / [ES] = (k₋₁ + k₂) / k₁. Call it Km.
- Every enzyme is empty or busy: [E] = [E]ₜ − [ES], where [E]ₜ is the total enzyme.
- Substitute: ([E]ₜ − [ES])[S] = Km[ES]. Move the [ES] terms together: [E]ₜ[S] = [ES](Km + [S]). So the busy fraction is [ES] / [E]ₜ = [S] / (Km + [S]).
- Multiply both sides by kcat[E]ₜ. The left side becomes v; kcat[E]ₜ, the speed with every enzyme busy, is Vmax. So v = Vmax[S] / (Km + [S]).
That is the Michaelis–Menten equation (Michaelis and Menten, 1913, who assumed rapid equilibrium between E, S and ES; the steady-state derivation above is Briggs and Haldane’s, 1925, and gives the same form), a hyperbola rising toward Vmax but never reaching it. It has the shape of single-site binding in protein binding, Y = L/(Kd + L), with Km in place of Kd. How the two constants differ comes next.
Its scope: one substrate, far more substrate than enzyme (so free [S] is about the [S] you added), measured at initial velocity. With extra steps in the mechanism, such as a covalent intermediate, “busy” means every form holding substrate or an intermediate, and the busy fraction is still [S]/(Km + [S]). Cooperative and multi-substrate enzymes and tight-binding inhibitors need other models (Going deeper, “Where the model stops”).
In words v equals Vmax times [S], over Km plus [S]. The fraction [S] over Km plus [S] is the share of the enzyme holding substrate.
- v“v (velocity)”
- the initial velocity, V₀: product formed per unit time in the first momentse.g. µmol/min
- Vmax“V max”
- the velocity with every enzyme busy, kcat × [E]ₜ. The curve approaches it but never quite reaches it.same units as v
- [S]“S in square brackets”
- the substrate concentration. Square brackets mean “concentration of”.e.g. mM
- Km“K m, the Michaelis constant”
- (k₋₁ + k₂)/k₁ in the simplest scheme: the substrate concentration at which half the enzyme is busy and v is half of Vmaxsame units as [S]
Sanity check Far below Km, almost every enzyme is empty and v ≈ (Vmax/Km) × [S], a straight line from zero. Far above Km, almost every enzyme is busy and v sits just under Vmax. At [S] = Km the fraction is ½: half busy, half speed.
Try one number
The opening enzyme has Vmax = 60 µmol/min and Km = 4 mM. At [S] = 12 mM the busy fraction is 12 / (4 + 12) = 0.75, so v = 0.75 × 60 = 45 µmol/min.
Double the substrate to 24 mM: busy fraction 24/28 ≈ 0.86, v ≈ 51 µmol/min. Twice the substrate bought about 14% more speed, because only a quarter of the enzyme was empty to begin with. That is saturation.
Need a refresher? reading an equation · rates and “per” · units and prefixes
Try the plotter at the top of this section: slide Km and Vmax and watch the half-max point. (The film marks Km as the half-speed point: it is the [S] at half of Vmax, the midpoint of the velocity range, not the middle of the [S] axis.)
Predict. What substrate concentration puts 90% of the enzyme to work?
Check your prediction
Nine times Km: set [S]/(Km + [S]) = 0.9 and solve. Nine times the half-busy substrate, and the speed does not even double. In general, a fraction f needs [S] = (f / (1 − f)) × Km, so 80% needs 4 Km.
The film’s no-waiting-lane toll plaza shows why the approach to Vmax is gradual: real substrate that finds busy enzyme bounces off and diffuses away. A booth with a queue would instead rise linearly to capacity and stop at a sharp corner.
Km is the half-busy point, not the affinity
Split Km into two parts:
Km = (k₋₁ + k₂) / k₁ = k₋₁/k₁ + k₂/k₁ = Kd + k₂/k₁
Kd = k₋₁/k₁ is the dissociation constant from protein binding: the half-full point if substrate only ever fell back off. The second part is turnover, a second way to empty a site, so a fast enzyme needs more substrate to keep half its sites full.
Predict. An enzyme’s Kd is 10 µM, and it turns substrate over nine times faster than substrate falls off. Is its Km bigger or smaller than Kd, and by how much?
Check your prediction
Ten times bigger: with k₂ = 9 k₋₁, Km = 10 + 90 = 100 µM. At 100 µM substrate, binding equilibrium alone would fill 91% of the sites; turnover keeps it at 50%.
Km equals Kd only when turnover is much slower than falling off (k₂ ≪ k₋₁), so Km is not binding affinity: a small Km means the enzyme reaches half speed on very little substrate, whatever the reason. (With extra steps, Km can even be below Kd: Going deeper.) Under fixed conditions (pH, temperature, ionic strength), Km is a constant for a given enzyme–substrate pair; for a two-substrate enzyme it also depends on the other substrate.
Speed and efficiency: kcat and kcat/Km
Vmax depends on how much enzyme is in the tube: double the enzyme, double Vmax. Divide it out for a property of the molecule: kcat = Vmax / [E]ₜ, in s⁻¹ (strictly, per active site). Carbonic anhydrase is one of the fastest known: each molecule converts about 600,000 CO₂ molecules to bicarbonate every second.
kcat is only top speed. When substrate is scarce, almost every enzyme is empty, the busy fraction is about [S]/Km, and
v ≈ (kcat/Km) × [E]ₜ × [S]
So kcat/Km is the rate constant for an encounter that ends in product, in M⁻¹s⁻¹. It cannot exceed how often enzyme and substrate collide in water, the diffusion limit, typically about 10⁸–10⁹ M⁻¹s⁻¹; enzymes that come close, where nearly every encounter is productive, are called “kinetically perfect”. This ratio is often called “catalytic efficiency”; more precisely it is the specificity constant, which sets an enzyme’s preference among competing substrates. It is safest for comparing substrates of one enzyme: ranking different enzymes by it can mislead, because it describes only the low-substrate regime.
In E. coli, most measured substrate levels exceed the Km of the enzyme that uses them. Above Km means more than half busy, not flat out: at 3 Km an enzyme runs at three-quarters of Vmax and still tracks changes in substrate. Regulation, covered in other lessons, also sets its pace.
Reading the curve a second way: Lineweaver–Burk
Because Vmax is never reached, reading it off the hyperbola by eye is error-prone, and before computers could fit curves biochemists wanted a straight line they could read with a ruler. Taking the reciprocal of both sides of the Michaelis–Menten equation gives one:
In words One over v equals Km over Vmax, times one over [S], plus one over Vmax.
- 1/v“one over v”
- the reciprocal of the velocity: the y-axis of the plote.g. min/µmol
- Km/Vmax“K m over V max”
- the slope of the linemM·min per µmol
- 1/[S]“one over S”
- the reciprocal of the substrate concentration: the x-axis of the plote.g. per mM
- 1/Vmax“one over V max”
- the y-intercept, where the line crosses the y-axis (1/[S] = 0)min per µmol
Sanity check Line it up with y = mx + b: y is 1/v, x is 1/[S], the slope m is Km/Vmax, and b is 1/Vmax. A faster enzyme (bigger Vmax) gives a lower intercept; a bigger Km gives a steeper line.
Try one number
Take round values to keep the arithmetic easy: Vmax = 100 µmol/min and Km = 2 mM.
y-intercept: 1/Vmax = 1/100 = 0.01 min/µmol. Slope: Km/Vmax = 2/100 = 0.02. x-intercept: −1/Km = −1/2 = −0.5 per mM.
Check one point: at [S] = 2 mM, 1/[S] = 0.5, so 1/v = 0.02 × 0.5 + 0.01 = 0.02, and v = 1/0.02 = 50 µmol/min. That matches the curve: half of Vmax at [S] = Km.
Where it comes from optional
Optional: where the line comes from, in three steps.
1. Flip both sides of v = Vmax · [S] / (Km + [S]): 1/v = (Km + [S]) / (Vmax · [S]).
2. Split the top into its two parts: 1/v = Km / (Vmax · [S]) + [S] / (Vmax · [S]).
3. In the second part the [S] cancels, leaving 1/Vmax. The first part is (Km/Vmax) × (1/[S]). So 1/v = (Km/Vmax) · (1/[S]) + 1/Vmax.
The x-intercept: set 1/v = 0. Then (Km/Vmax) × (1/[S]) = −1/Vmax; multiply both sides by Vmax/Km and 1/[S] = −1/Km.
Need a refresher? rates and “per”
This double-reciprocal or Lineweaver–Burk plot has y-intercept 1/Vmax, x-intercept −1/Km and slope Km/Vmax. (Watch the reciprocals: the intercept is 1/Vmax, not Vmax — a reliable source of exam mistakes.) The mini-plot draws this line live as you slide Km and Vmax.
One caution: taking reciprocals magnifies the error in the low-[S] points. So today Km and Vmax are estimated by fitting the curve directly (non-linear regression), and the double-reciprocal plot is used to see patterns, such as the type of inhibitor.
When something gets in the way: inhibitors
v vs [S] — the saturation curve
Lineweaver–Burk — 1/v vs 1/[S]
- Apparent Km
- 2.0
- Apparent Vmax
- 100
No inhibitor: the baseline curve. Add one and watch which intercept moves.
The double-reciprocal plot turns each inhibitor into a straight-line fingerprint: where the lines cross tells you the mechanism.
Back to the rule: whether an inhibitor ties up free enzyme (E), busy enzyme (ES), or both sets its pattern. The apparent Km and Vmax are the values you would measure with the inhibitor present; the enzyme’s own Km has not changed. Ki is the dissociation constant of the complex the inhibitor forms (EI for a competitive inhibitor, ESI for an uncompetitive one). For worked numbers, take an inhibitor dose that makes its factor, 1 + [I]/Ki, equal to 3 (that is, [I] = 2 Ki).
Competitive: ties up free enzyme. The inhibitor and substrate cannot bind at the same time, usually because both need the active site. It takes more substrate to make half the enzyme busy, so the apparent Km rises (here, threefold). But flood the system with substrate and almost no free enzyme is left for the inhibitor, so Vmax is unchanged and the Lineweaver–Burk lines share a y-intercept.
Predict. Can you rescue a competitively inhibited reaction by adding more substrate?
Check your prediction
Yes. With the factor at 3, the apparent Km is 3 Km, so at [S] = Km, v = Vmax × Km/(3 Km + Km) = ¼ Vmax instead of ½ Vmax: halved. The same arithmetic gives about 15% lost at 10 Km and only about 2% at 100 Km.
Uncompetitive: ties up busy enzyme. The inhibitor binds only the ES complex, forming the enzyme–substrate–inhibitor complex ESI and locking the enzyme mid-reaction.
Predict. Does an uncompetitive inhibitor matter more or less as [S] rises?
Check your prediction
More, because more substrate makes more ES for it to grab. With the factor at 3, divide both Km and Vmax by 3: v = Vmax[S]/(Km + 3[S]). At [S] = Km that is ¼ Vmax instead of ½: half lost. The same arithmetic gives about 15% lost at 0.1 Km and about two-thirds at high substrate.
Why do Vmax and Km both fall? Pulling ES into ESI draws more E + S into ES to replace it (Le Chatelier’s principle). With the factor at 3, half the enzyme holds substrate, as ES or ESI, at [S] = Km/3: a lower apparent Km. But two-thirds of that substrate-holding enzyme is stuck as ESI, so v is lower at every [S]. Both fall by the same factor, leaving the slope, Km/Vmax, unchanged: parallel lines.
Noncompetitive: ties up both equally. The inhibitor binds a site away from the active site, equally well with or without substrate. Taking the same share out of E and ES is like having less enzyme: Vmax falls, Km unchanged, so the lines share the x-intercept (−1/Km). An irreversible inactivator that has finished reacting gives the same plot, because it simply leaves less enzyme. Pure noncompetitive is the special case of mixed inhibition; if the inhibitor binds E and ES with different strengths, Vmax still falls but the apparent Km can rise or fall.
| Type | Ties up | Apparent Vmax | Apparent Km | Lineweaver–Burk | Share of v lost as [S] rises |
|---|---|---|---|---|---|
| Competitive | E | unchanged | rises | shared y-intercept | shrinks |
| Uncompetitive | ES | falls | falls, same factor | parallel lines | grows |
| Pure noncompetitive | E and ES equally | falls | unchanged | shared x-intercept | stays the same |
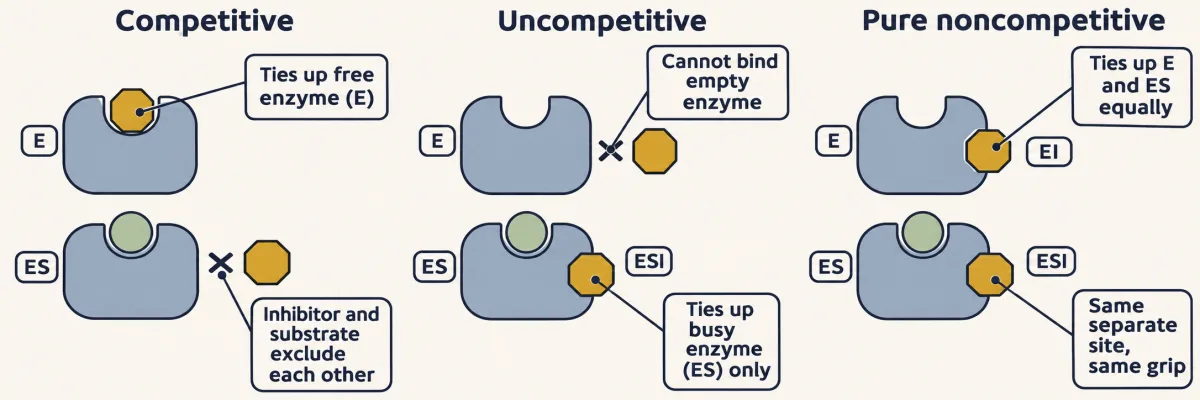
Click Competitive, then slide Inhibitor amount [I]/Ki up: the curve shifts right — the apparent Km grows — while Vmax holds steady. Then check the other two against the table.
Because the active site is shaped to grip the fleeting transition state more tightly than the substrate, stable mimics of that state, transition-state analogs, make some of the most potent inhibitors known. They usually occupy the active site, and many bind so tightly that they need the tight-binding treatment (Going deeper, “Where the model stops”).
Going deeper
Where the model stops
The derivation treats free [S] as the [S] you added. With enzyme concentration comparable to Km, much of the substrate sits on the enzyme, and the busy fraction at an added [S] = Km falls below one half (about 0.38 when [E]ₜ = Km); tight-binding inhibitors raise the same problem. Cooperative enzymes, usually allosteric multi-subunit ones, give sigmoidal v–[S] curves (shifts between low- and high-activity states; the T⇌R model is one description), so we report K₀.₅ rather than a mechanistic Km.
When Km is below Kd
Km = Kd + k₂/k₁, which makes Km at least Kd, holds only for the minimal scheme. With a slow step after enzyme–substrate (ES), such as an acyl-enzyme intermediate, enzyme piles up in that busy form, so Km can be smaller than Kd. It is still the [S] at half of Vmax.
From lock and key to the transition state
That tighter grip on the transition state is where catalysis comes from: the binding energy released pays down ΔG‡ (Pauling’s insight). The same binding energy also underlies specificity: kcat/Km for each substrate reflects how tightly the enzyme binds that substrate’s transition state, so a substrate whose transition state fits the site poorly is turned over slowly even if it binds. The scientists on the rail trace the picture: Fischer’s rigid “lock and key” (complementary to the substrate, a view the transition-state idea later corrected), Koshland’s “induced fit”, and Phillips modeling how lysozyme bends its substrate out of shape.
Your notes
Select any text in the lesson to highlight it or add a note to it. Your highlights and notes are saved in this browser and collected in your notebook.
This browser is not letting the site save anything (a private window or strict privacy settings), so highlights and notes will be lost when you leave the page.
How we measure it
The enzyme assay
Velocity is a slope: product formed per unit time. If the product absorbs light, you watch a spectrophotometer's reading climb and read the rate straight off the line — how many classic assays work.
Measuring initial velocity (V₀)
Measure the slope in the first instants, before substrate is depleted or product builds up and starts to inhibit the enzyme or run the reaction backward. V₀ is the clean, reproducible number the steady-state parameters in this lesson are built from.
Extracting Km and Vmax
Measure V₀ at many substrate concentrations and fit the hyperbola (today, by non-linear regression). The Lineweaver–Burk double-reciprocal linearizes the same data: y-intercept = 1/Vmax, x-intercept = −1/Km, slope = Km/Vmax.
Practice questions on this lesson (7) → MCAT-style, original, each with an explanation
Where this lesson fits
Before thisReview first
- Basic Concepts of Enzyme ActionThis course · Lesson 7
You need the idea that enzymes only speed up possible reactions and bind the transition state, which this lesson builds on.
- Protein Three-Dimensional Structure: The Sequence Sets the ShapeThis course · Lesson 5
The active site that grips substrate is a folded pocket, so knowing how sequence sets shape helps.
After thisStudy next
- Protein Binding and Allostery: How Hemoglobin Loads and Delivers OxygenThis course · Lesson 9
Cooperative enzymes break the single-site hyperbola here, and this lesson takes binding curves to sigmoidal ones.
- Metabolism: Basic Concepts and DesignThis course · Lesson 15
Metabolic enzymes run at substrate levels set against their Km, so pathway control uses this saturation idea.
- Glycolysis: The Investment-and-Payoff PathwayThis course · Lesson 16
Reading how each glycolytic enzyme's Km and Vmax shape flux uses the rate equation built here.
Elsewhere on the siteFilms, simulations and method films in other courses
- Dose–response explorerSimulation · Cell Signaling
Binding curves and occupancy there follow the same hyperbola as the busy-enzyme fraction in this lesson.
Suggested by an AI model from the lessons themselves, then checked. How we use AI
Finish line
Test yourself
8 questions
Practice and MCAT-style, with explained answers.
Next · Lesson 9
Protein Binding and Allostery: How Hemoglobin Loads and Delivers Oxygen
Your blood has to grab oxygen in the lungs and let go of about two-thirds of it in hard-working muscle. A tighter grip than hemoglobin's would make it worse. What does hemoglobin do instead?
Continue →