Physiology · Unit 2: Muscle
Skeletal Muscle: Length, Load and Speed
Rewritten on : new text, figures and flashcards. Your notes and highlights stay, but the text around them may have moved.
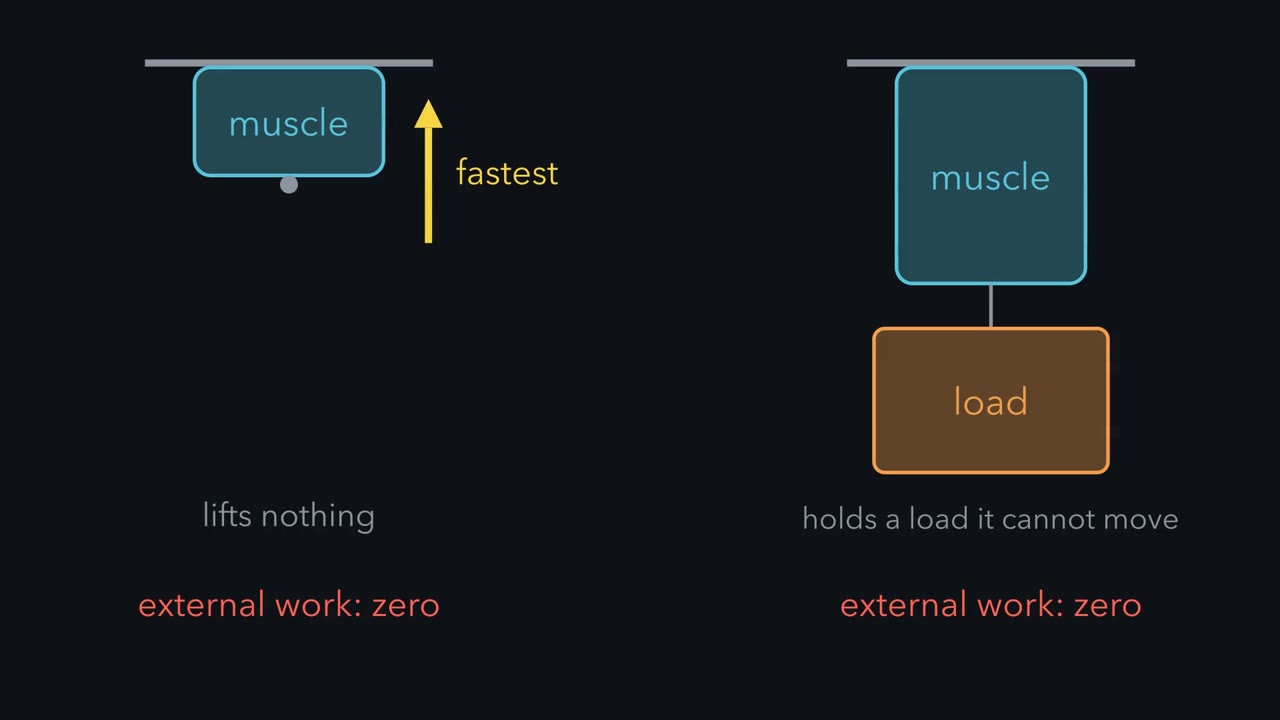
A muscle lifting nothing and a muscle holding a load it cannot move both do zero external work. Where is the power?
Pause when the reading reaches a film, and offer to play it. Saved on this device.
Watch the film now, or keep listening
Builds on:Muscle, Bone and MovementRespiration and ATPMolecular Motors and CargoWhy these?
 ▶ Watch Power Peaks at a Middle Load · 2:41
Read the transcript of “Power Peaks at a Middle Load”
Film transcript: Power Peaks at a Middle Load
A muscle lifts nothing. It shortens as fast as it can, and it does no external work. Another muscle holds a load it cannot move. It also does no external work. At both extremes, the external work is zero. So where does a muscle deliver its power? In 1938, A. V. Hill asked what sets how fast an activated muscle shortens. Hill used isolated frog sartorius muscles at about 0 degrees Celsius. He tetanized each muscle. Then he let it shorten against a series of loads on a lever. A thermopile recorded the heat. He read the speed from the record of shortening, not from the total distance shortened. Heavier loads gave slower shortening. Speed fell with load along a curve called a rectangular hyperbola, not along a straight line. A viscous brake would give a straight line.
So Hill's result ruled out a passive viscous-elastic muscle. Here is the curve for a made-up model muscle, not measured human values. Its isometric force is 100 newtons. With no load, it shortens at 0.40 metres per second. At 100 newtons, it does not shorten. Power is force times speed, in watts. With no load, the speed is greatest, but the load is zero, so the power is zero. When the load equals the force the muscle can hold, the speed is zero, so the power is zero again. This is external power, not ATP use. An isometric muscle does no external work, yet it keeps splitting ATP. In between, power peaks. In this model, the constant is one quarter of the isometric force.
Then the peak sits near 0.31 of the isometric force. That is a load of 30.9 newtons. The speed there is about 0.12 metres per second, and the peak power is about 3.8 watts. The exact fraction depends on the curvature. Now stretch the same model fibre. Assume force falls along a straight line, from full force at 2.2 micrometres of sarcomere length to zero at 3.65 micrometres. At 3.00 micrometres, the isometric force is 44.83 newtons. At fixed speed and curvature, peak power falls by the same factor, 0.448. The speed at peak power stays at 0.309 of top speed. Hill's rule gives no molecular mechanism, and its constants are frog values at about 0 degrees Celsius.
External power is zero at both extremes and peaks at a middle load.
An activated muscle shortens fastest when it lifts nothing and not at all when the load equals the force it can hold, so at both extremes it does no external work.
External work is force times the distance the load moves. Lifting nothing, there is no force. Holding a load it cannot move, there is no distance. Yet muscles lift things all day, so power must peak somewhere in between. The first look at muscle followed a contraction from T tubule to troponin. This lesson puts numbers on length, load, speed, fuel and fatigue.
The one idea to carry through this lesson. Length sets the ceiling, load sets the speed. At each sarcomere length, filament overlap fixes the most force a fully activated muscle can hold, F0. Below that ceiling the muscle trades force for speed: the lighter the load, the faster it shortens, up to a top speed, vmax, because fast sliding leaves fewer myosin heads holding on. So power is zero at both ends and peaks at a middle load: for the usual curvature (a/F0 near 0.25, defined below), about a third of F0, moving at about a third of vmax.
Most of what follows changes one of four things: the ceiling F0 (length, fatigue), how much of the ceiling the muscle reaches (activation: twitch or tetanus), the top speed vmax and how much the curve sags (fibre type, fatigue), or how long the ATP supply lets the muscle keep going. The rule covers a fully activated muscle shortening steadily at one temperature. It does not cover a muscle being stretched while active (Going deeper, “Stretch first, hold more”), and it is about external power, not ATP use.
Length sets the ceiling
Hold a muscle at one length, stimulate it, and the force it develops is its isometric force. That force depends on sarcomere length, the distance from one Z line to the next.
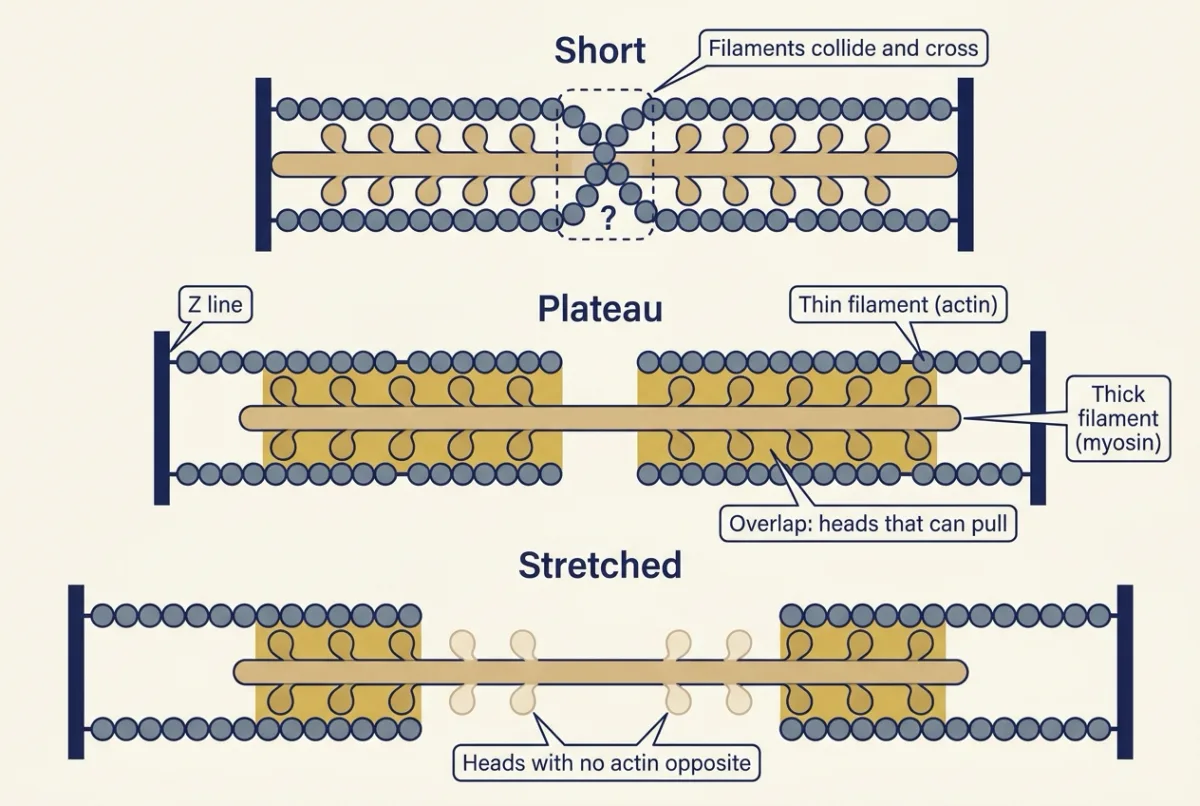
Plot active force against sarcomere length. In frog fibres the curve has a flat top, the plateau, at about 2.05 to 2.2 µm. To the right, on the descending limb, force falls roughly in a straight line, extrapolating to zero near 3.65 µm. To the left, at short lengths, force also falls, as filaments collide.
The measurement was made in 1966 by Gordon, Andrew Huxley and Julian, an experiment told in molecular motors. They used a feedback motor to hold the sarcomeres in a short middle segment of a single frog fibre at a fixed length, because sarcomeres at the ends of a fibre stretch unevenly.
On the descending limb, the reason is overlap. On the plateau, thin filaments reach every myosin head. Stretch the sarcomere and fewer heads face actin, so force falls in line with the lost overlap. Picture rowers (heads) whose oars must reach the water (thin filament): spread the rowers along a boat longer than the water they can reach and fewer oars touch it; crowd them where the water is full of other oars and the oars clash.
Beyond the plateau, even resting muscle resists with passive tension from titin and connective tissue. Active tension is total tension minus passive tension at the same length. Heart muscle normally works below its optimal length, where stretch raises force, part of the behaviour read from pressure-volume loops.
Predict. Assume the descending limb is a straight line from full force at 2.20 µm to zero at 3.65 µm. What fraction of plateau force can a fibre hold at 3.00 µm?
Check your prediction
The fibre sits 3.65 − 3.00 = 0.65 µm short of zero on a limb 1.45 µm long: 0.65 / 1.45 = 0.448, a little under half. A muscle with 100 N on the plateau has an F0 of 44.83 N at 3.00 µm.
Load sets the speed
Isometric: length held (as above). Isotonic: constant load while length changes. Concentric: the active muscle shortens. Eccentric: the active muscle is pulled longer because the load exceeds the force it is producing, as the thigh muscles are when you walk downhill. While it is being stretched, an active muscle resists with more than its isometric force at the same activation.
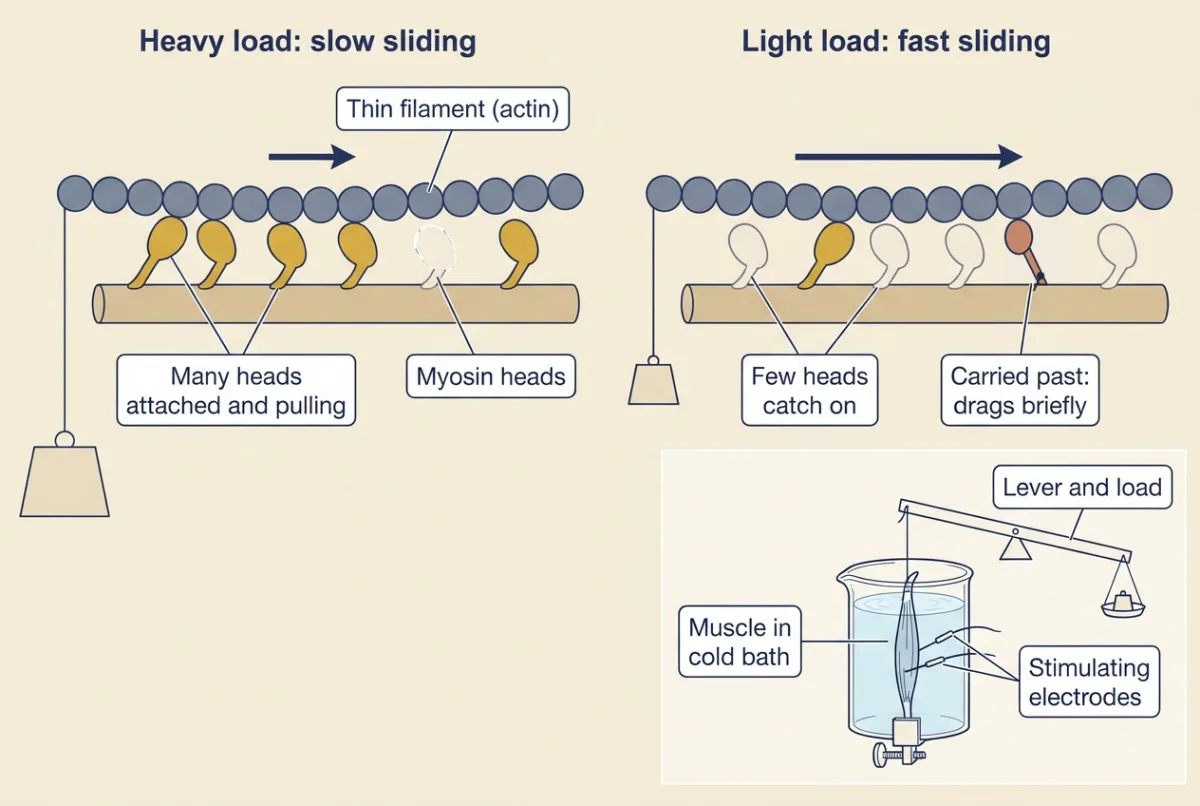
Start with the record. In 1938 A. V. Hill (profiled in protein binding and allostery) fully activated isolated frog sartorius muscles at about 0 °C with a rapid train of stimuli that fuses twitches into one steady contraction (a tetanus, not the disease; explained below), then let each one lift a load on a lever. On the trace of length against time, the muscle jerks briefly at release, then falls along a steady slope: the shortening speed. A heavier load gives a shallower slope. Read the speed early, just after the jerk, before the muscle has shortened enough to change its ceiling F0 much. Plot each speed against its load and you have the force-velocity curve.
You already know its two ends. With no load the muscle shortens at its top speed, vmax. With a load equal to F0 it cannot shorten at all.
Predict. Join the two ends. Is the curve a straight line, so that half of F0 gives half of vmax, or does it sag?
Check your prediction
It sags: speed falls steeply with the first bit of load, then more gently until it reaches zero at F0, and Hill’s points lie on a rectangular hyperbola. In the model muscle below, half of F0 gives only one-sixth of vmax. A straight line is what you would expect if muscle were a stretched spring slowed by a viscous brake; Hill’s curve, with earlier energy measurements by W. O. Fenn, was evidence against that picture.
Why heavier loads mean slower shortening. Force comes from myosin heads that attach to actin, pull and let go. When the filaments slide fast, each binding site passes a head quickly, so fewer heads catch on. Heads that do catch are carried past the point where they pull, and drag briefly before they let go. Fewer heads pull and some resist, so a fast-shortening muscle carries only a light load, and a heavy load slows sliding until enough heads attach to bear it. The muscle shortens at the speed at which just enough heads are attached to carry the load. A. F. Huxley’s 1957 cross-bridge model, built on this picture, later reproduced the curve Hill measured.
Hill’s equation for the curve; its shape matters more than the formula:
In words Shortening speed equals b times the spare force, F0 minus the load, divided by the load plus a.
- F“F”
- the load the muscle liftsN
- v“v”
- the shortening speed against that loadm/s
- F0“F zero”
- the isometric force at this length, with the muscle fully activated: the ceilingN
- a“a”
- a constant in force units; a/F0 sets how sharply the curve sags (smaller a/F0, more sag)N
- b“b”
- a constant in speed units, equal to vmax × a/F0m/s
Sanity check Put F = F0: the top is zero, so v = 0. Put F = 0: v = b F0 / a, which is vmax. Every load in between gives a speed on the sagging curve.
Try one number
A model muscle: F0 = 100 N, vmax = 0.40 m/s, a/F0 = 0.25. Made-up round numbers, not human constants; only a/F0 is close to Hill’s usual value for frog sartorius.
So a = 25 N and b = 0.40 × 0.25 = 0.10 m/s.
Against 50 N: v = 0.10 × (100 − 50) / (50 + 25) = 0.10 × 50 / 75 = 0.067 m/s.
Need a refresher? rates and “per” · units and prefixes
Hill’s equation is a fit to data, not a mechanism. His constants are frog values at 0 °C, and real fibres depart from a single hyperbola at the lightest and heaviest loads.
Power peaks at a middle load
Power is force times speed, P = F × v, in watts (1 W = 1 N × 1 m/s), so it is zero at both ends.
Predict. Where in between is power greatest? Most people guess half of F0.
Check your prediction
Lower than half. For the model muscle, power peaks near a load of 31 N, about a third of F0, where the muscle moves at about a third of its top speed:
| Load (N) | Speed (m/s) | Power (W) |
|---|---|---|
| 0 | 0.40 | 0 |
| 10 | 0.26 | 2.6 |
| 20 | 0.18 | 3.6 |
| 30.9 | 0.12 | 3.8 (the peak) |
| 50 | 0.067 | 3.3 |
| 75 | 0.025 | 1.9 |
| 100 | 0 | 0 |
Half of F0 would be right for a straight line, but on the sagging curve speed has already fallen far by then, so the best load comes earlier.
In words The best load, as a fraction of the ceiling, equals the best speed as a fraction of top speed, and both depend only on the curvature.
- Fbest“F best”
- the load that gives the most powerN
- vbest“v best”
- the shortening speed at that loadm/s
- q“q”
- the curvature, a / F0no units
Sanity check For q = 0.25 both fractions are 0.309, about a third, and peak power is 0.309² × F0 × vmax, about a tenth of F0 × vmax. A more curved muscle (smaller q) peaks at a lighter load, so the exact fraction is a model result, not a universal constant.
Try one number
Model muscle: 0.309 × 100 N = 30.9 N; 0.309 × 0.40 m/s = 0.1236 m/s; power = 30.9 × 0.1236 = 3.82 W.
Where it comes from optional
Step 1, write f = F / F0. Hill’s equation gives v / vmax = q (1 − f) / (f + q), so power, as a fraction of F0 × vmax, is f × q (1 − f) / (f + q).
Step 2, set its derivative with respect to f to zero: f² + 2qf − q = 0, so f = √(q² + q) − q. For q = 0.25 that is 0.559 − 0.25 = 0.309.
Step 3, put that f back into v / vmax and it simplifies to the same number, f.
Need a refresher? powers and roots · rates and “per”
Now stretch the muscle. In this model, stretching changes only F0. That is a simplification, not a law: in frog fibres, unloaded speed stays nearly constant only over the middle of the length range, about 1.65 to 2.7 µm (Edman, 1979). Take the same model muscle to the 3.00 µm of the first prediction, and assume that vmax and a/F0 stay the same. The 3.00 µm used here lies beyond that range, so treat the result as an exercise in the model, not a prediction for a frog fibre.
- F0 = 100 × 0.448 = 44.83 N.
- The best load is still 0.309 of F0: 13.85 N, moving at the same 0.1236 m/s.
- Peak power = 13.85 × 0.1236 = 1.71 W, which is 0.448 of the 3.82 W on the plateau.
The ceiling fell, peak power fell by the same factor, and the best speed did not move. This is external power: an isometric muscle does no external work, yet it keeps splitting ATP.
Model muscle with frog length landmarks; not human data.
- Active isometric force F₀ at this length
- 100.00 N
- Constants a and b
- —
- Shortening speed at this load
- —
- External power at this load
- —
- Best load
- —
- Best speed
- —
- Peak power at the best load
- —
- Peak power vs the fresh plateau muscle (3.82 W)
- —
—
Assumptions, made up for this sketch (not measured): a model fibre bundle that holds 100 N on the plateau when fully activated and fresh, 2.05 to 2.20 µm; a straight descending limb from full force at 2.20 µm to zero at 3.65 µm (the frog length landmarks); the fall in force at lengths shorter than 2.05 µm (interference, not modelled); a/F₀ and vmax are the same at every length; fatigue is modelled only as a smaller fraction of the ceiling reached, plus whatever a/F₀ and vmax you set; the "fresh plateau muscle" reference is 100 N, a/F₀ 0.25, vmax 0.40 m per s (3.82 W peak); quasi-steady shortening at one length with constant activation and temperature. The values are illustrative, not human constants; a/F₀ (0.25) is the usual frog sartorius value Hill gave in 1938; vmax (0.40 m per s) and the slider ranges are model values. Rule used: F₀ = 100 N × fraction reached × min(1, (3.65 − L) / 1.45), a = (a/F₀) F₀, b = vmax (a/F₀), v = b (F₀ − F) / (F + a), P = F × v, best load = F₀ (√(q² + q) − q) with q = a/F₀, best speed = vmax (√(q² + q) − q). The straight-line guess is v = vmax (1 − F/F₀).
Length sets the ceiling, load sets the speed: the sarcomere length sets the isometric force F₀ the muscle can hold; against any load below F₀ Hill’s hyperbola sets the speed; power F × v is zero at zero load and at F₀ and peaks at a load in between, whose fraction of F₀ depends on the curvature.
Activation: how much of the ceiling you get
F0 assumes full activation, and one impulse does not get there. A twitch is the mechanical response to a single action potential. It falls short of F0 partly because one release may not fill every troponin site and partly because activation is brief. Force at the ends of the fibre builds only as the cross-bridges stretch the elastic parts in series with them (tendon and the heads themselves), and the calcium from a single release is largely pumped back, and activation has declined, before they have done so.
If a second action potential arrives before relaxation is complete, its calcium adds to what the first left behind: cytosolic calcium rises further and stays high longer, more troponin stays occupied, and the fibre stays active long enough for force to climb higher: summation. At moderate rates the force record shows ripples, an unfused tetanus. At higher rates it becomes smooth, a fused tetanus, and force approaches the ceiling. How the nervous system recruits motor units and sets their firing rates belongs to motor units and reflexes.
Fibre types set the top speed
Human fibres fall into three main types: type I (slow oxidative), type IIA (fast oxidative-glycolytic) and type IIX (fast glycolytic). Why human “IIb” fibres are really IIx is told in muscle and movement.
Speed follows the rate of the myosin’s ATPase and cross-bridge cycle. Type I fibres twitch more slowly, so their twitches fuse at lower firing rates. They are red from myoglobin (oxygen transport) and dense capillaries, rich in mitochondria, and resistant to fatigue. IIX fibres rely mostly on glycolysis and fatigue quickly. Force per cross-sectional area differs much less between types than speed does. So fibre type mainly moves vmax, not the ceiling.
Predict. A type IIX and a type I fibre have the same F0 and the same curvature, but suppose the IIX fibre’s vmax is four times as high. Which gives more peak power, and by how much?
Check your prediction
The IIX fibre, by four times. At fixed curvature peak power scales with F0 × vmax: the best load is the same fraction of F0 for both, and the IIX fibre moves it four times faster.
Three ATP supplies, running at once
Resting ATP would last only seconds at a high rate of use, yet it barely falls in most exercise. The first buffer is phosphocreatine (PCr), present at several times the ATP concentration in resting human muscle (metabolism: basic concepts):
PCr + ADP + H+ → creatine + ATP (creatine kinase)
The reaction consumes a proton, which matters below. Glycolysis, from muscle glycogen or blood glucose, makes ATP without using oxygen (glycolysis). Oxidative phosphorylation needs a continuing oxygen supply and burns carbohydrate and fat (oxidative phosphorylation). All three run together, with shares that shift with intensity and duration, so fixed “10-second” or “2-minute” windows misdescribe them.
The extra oxygen you take up after exercise is not simply a repayment for lactate, as the 1920s oxygen debt idea of Hill and colleagues held. In rats exercised to exhaustion, Brooks and Gaesser (1980) found lactate removed within 15 minutes, while oxygen uptake stayed above rest for 120 minutes. The descriptive term now is excess post-exercise oxygen consumption (EPOC), which has several sources: resynthesis of phosphocreatine and refilling of oxygen stores early in recovery, and raised temperature and hormones over a longer time (Gaesser and Brooks, 1984). Lactate itself is an oxidizable fuel; the whole-body story belongs to exercise physiology.
What fails in fatigue
Fatigue is a fall in force or power during repeated activity that recovers with rest. In the terms of this lesson, fatigue usually lowers F0, often lowers vmax as well, and in most studies makes the force-velocity curve sag more. Which of these happens depends on the cause: acid alone at 32 °C left vmax unchanged (below). Power depends on all three, so it can fall further than isometric force. As an illustration in the model muscle, a 20 percent fall in F0 cuts peak power by 20 percent; add a 20 percent fall in vmax and it falls 36 percent (0.8 × 0.8 = 0.64); let a/F0 drop from 0.25 to 0.15 as well and the peak shrinks from 0.309² to 0.265² of F0 × vmax, a fall of about 53 percent in all.
The popular story blames lactic acid, but the evidence points away from the lactate ion. In mammalian muscle, the traditional account of lactate and protons impairing the contractile proteins is probably of limited importance near body temperature, though acid and phosphate each lowered the force of purified myosin in a laser trap (see below), which does not show how much either contributes in working mammalian muscle at body temperature; the shares are still debated. Leading alternatives are inorganic phosphate (Pi), which acts on cross-bridges and on calcium release, failure of calcium release from the sarcoplasmic reticulum, and ionic changes that affect the action potential (Allen, Lamb and Westerblad, 2008).
Temperature matters. Westerblad, Bruton and Lännergren (1997) acidified intact single mouse fibres by about 0.5 pH unit with carbon dioxide. Tetanic force fell 28 percent at 12 °C but only 10 percent at 32 °C, with no significant change in maximal shortening velocity at 32 °C. Cold preparations overstate the effect of acidosis; the authors concluded that direct inhibition of force by acidification is not a major factor in fatigue at physiological temperatures, although the loss at 32 °C was not zero.
At the motor itself. Do protons and phosphate act directly on myosin, and at the same step? Both act on the motor itself, and the evidence points to different steps. Woodward and Debold (2018) let a small group of purified chicken myosin heads pull on one actin filament in a laser trap, with no membrane, sarcoplasmic reticulum or lactate present. Lowering pH from 7.4 to 6.5 cut the group’s average peak force by about 20 percent. At pH 6.5, adding 15 mM phosphate largely abolished the high-force events, and events became brief, suggesting that myosin let go of actin sooner. The experiment does not show how much each contributes in working human muscle (Going deeper, “Protons and the laser-trap conditions”). In living rats, twitch force tracked phosphate more consistently than protons, an association rather than a test of cause (Lewis and colleagues, 2025, by phosphorus magnetic resonance spectroscopy).
A disease as a test. In McArdle disease (glycogen storage disease type V), inherited loss of muscle glycogen phosphorylase (gene PYGM) stops muscle glycogen from feeding glycolysis.
Predict. During a brief intense contraction, lactate in an affected muscle barely rises. Does force last longer than normal?
Check your prediction
No. Intracellular pH does not fall, and because creatine kinase consumes protons it may even rise slightly; lactate in muscle and venous blood barely rises. Phosphorus spectroscopy in patients reports an abnormally low phosphocreatine to phosphate ratio at the end of exercise, with no acidosis. Yet force fails early, and painful contractures can occur. Fatigue here develops without acidosis or a rise in lactate, so lactate accumulation cannot be its necessary cause. After several minutes of moderate exercise, more work is often tolerated (the “second wind”), consistent with rising delivery of blood glucose and fatty acids to oxidative metabolism.
The rule still frames it: fatigue lowers the ceiling and usually the top speed, so power suffers most.
Two whole-body jobs
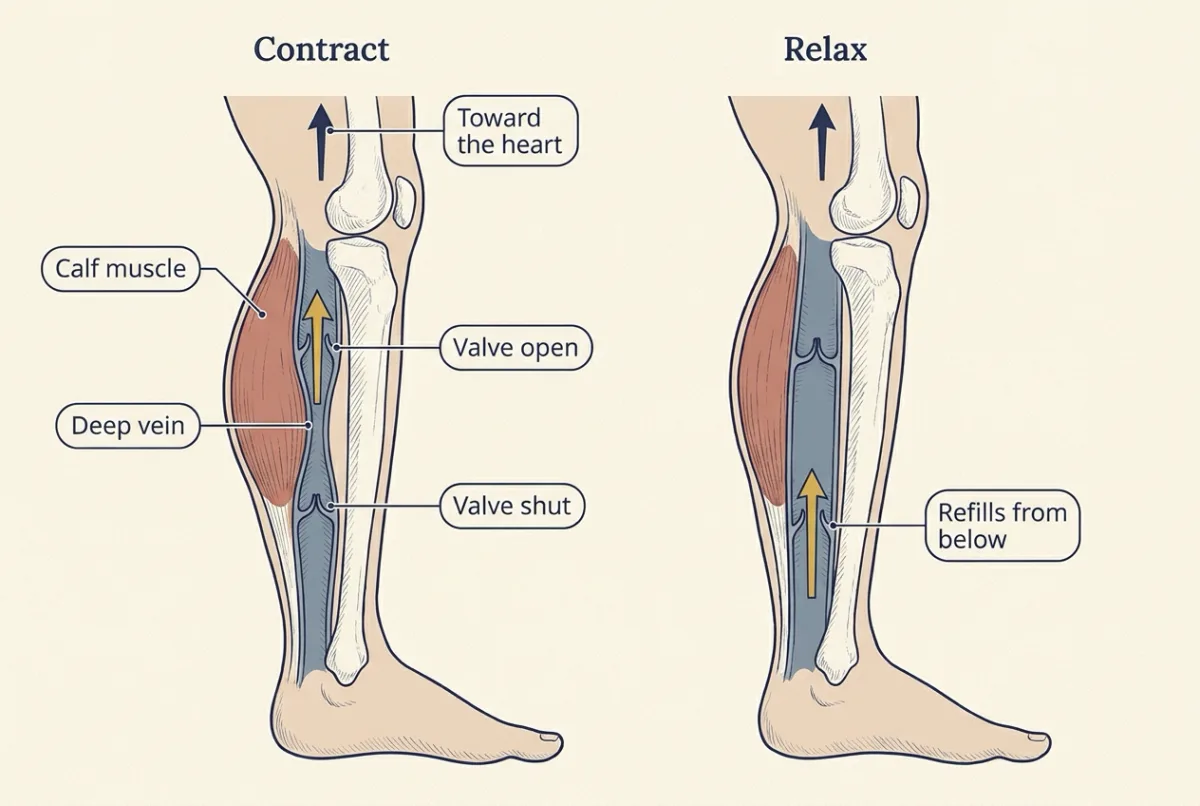
Contracting calf muscles squeeze the deep veins between them, and one-way valves let blood move only toward the heart; on relaxation the veins refill from below. This muscle pump aids venous return from the legs (cardiac output and venous return).
Muscle is also the main adjustable heat source. Only a minority of the energy turned over appears as external work (in cycling, at most about a quarter); the rest is heat. Shivering is involuntary, rhythmic contraction that does almost no external work, so nearly all its energy becomes heat (skin and human heat).
Design problem
You have isolated mouse soleus (a slower muscle, with roughly 40 percent type I and about half type IIA fibres) and extensor digitorum longus (EDL, mostly fast type II fibres) muscles in oxygenated solution at a fixed temperature. Design an experiment to compare their force-velocity and power curves, and predict the result.
Saved in this browser only.
One way to do it
At the length giving the largest twitch (Lo), record a reference tetanus for F0. Tetanize and release onto loads from about 5 to 90 percent of F0 (afterloaded isotonic contractions), measuring speed from the early steady part of shortening, after the brief transients at release. Isovelocity ramps work the other way round: impose each speed and measure the force.
Normalize force to physiological cross-sectional area (mass divided by density and by optimal fibre length, not whole-muscle Lo) and speed to fibre lengths per second. Fit Hill’s equation for F0, a/F0 and vmax, and compute power as F x v at each load.
Controls: same temperature and stimulation; random load order; a repeated reference tetanus, discarding runs where it falls; a check for an anoxic core.
Prediction: similar force per area but higher vmax in EDL, so its power curve peaks higher. Do not predict a direction for a/F0 without data. Limits: whole muscles mix fibre types, one temperature, mouse not human; confirm fibre types by myosin heavy-chain staining or gels.
Going deeper
The viscous-brake theory
In the 1920s W. O. Fenn reported that a frog muscle allowed to shorten and do work releases more energy than one held isometric. A stretched spring in a viscous fluid, its energy fixed at stimulation, could not explain that, and a viscous brake would also make speed fall linearly with load. Fenn and Marsh (1935) had reported a curved force-velocity relation before Hill, whose curve replaced the passive viscous-elastic muscle with a quantitative, load-dependent rule for speed and power.
Hill’s experiment and its constants
In his 1938 paper (Proceedings of the Royal Society B) Hill also recorded heat with a thermopile, and read speed from the record of shortening, not from the total distance shortened. Shortening released extra heat in proportion to the distance shortened, the heat of shortening, with a coefficient he also called a. Hill himself found in 1964 that this heat coefficient rises with load, so it is not the same quantity as the constant a in the speed equation. Because real fibres depart from the hyperbola at the extremes of load, a fitted vmax and a directly measured unloaded speed can differ. The curvature constant also varies with species, fibre type and temperature: with a/F0 near 0.1, the best load falls to about 0.23 of F0.
Short lengths
Left of the plateau the curve is not a mirror image of the descending limb. On the frog curve, force fell more steeply below about 1.67 µm. That loss is usually read as interference, with thin filaments crossing into the opposite half-sarcomere and thick filaments meeting the Z lines, not as too little overlap.
Stretch first, hold more
Force also depends on history: after an active stretch, a fibre settles above the isometric force at the same final length, residual force enhancement, which a static overlap diagram misses. Titin carries part of it. In permeabilized bundles of engineered mouse psoas fibres at partial calcium activation and 25 °C, cutting half of the titin with a protease lowered the enhancement from 30.7 to 17.4 percent of the reference force (Hessel and colleagues, PNAS 2024; the anecdote “Stretch it first and it holds more” gives the details).
The same muscle against 20 N
Any load on the stretched curve can be worked the same way. At 3.00 µm the model muscle has F0 = 44.83 N, so a = 0.25 × 44.83 = 11.21 N, and b = 0.40 × 0.25 = 0.100 m/s (b does not depend on F0). Against 20 N: v = 0.100 × (44.83 − 20) / (20 + 11.21) = 0.100 × 24.83 / 31.21 = 0.0796 m/s, and P = 20 × 0.0796 = 1.59 W. Check: (F + a)(v + b) = 31.21 × 0.1796 = 5.61, and (F0 + a) b = 56.04 × 0.100 = 5.60, equal within rounding (both are 5.603 with unrounded values). At the best load, 13.85 N, speed = 0.100 × 30.98 / 25.06 = 0.1236 m/s, the same as on the plateau.
Oxygen debt and lactate as fuel
The oxygen debt idea held that about a fifth of the lactate made during exercise was oxidized to fuel rebuilding the rest into glycogen. Lactate is instead a fuel: in six active men cycling at 55 percent of peak oxygen uptake, infused lactate raised lactate oxidation and lowered glucose oxidation (Miller and colleagues, 2002).
Protons and the laser-trap conditions
Intense glycolysis is accompanied by lactate ions and protons, but where the protons come from is debated. Woodward and Debold (Frontiers in Physiology, 2018) used fast skeletal myosin and actin from chicken pectoralis, a trap stiffness of about 0.02 pN per nm and 100 µM MgATP. The high-force events that phosphate removed were those above 2 pN. If both ions acted at the same step, they would be expected to change the pattern of force events in similar ways; the patterns differed. The limits: chicken proteins, low ATP and a fixed buffer, and lactate was simply absent.
Your notes
Select any text in the lesson to highlight it or add a note to it. Your highlights and notes are saved in this browser and collected in your notebook.
This browser is not letting the site save anything (a private window or strict privacy settings), so highlights and notes will be lost when you leave the page.
How we measure it
Afterloaded isotonic release (force-velocity measurement)
Stimulate an isolated muscle or fibre at a fixed length, then let it shorten against a chosen load on a lever or servo motor and read speed from the early, steady part of the length record, after any brief transient at release. Repeating over a series of loads, at one temperature and activation, gives a force-velocity curve that can be fitted with Hill's equation.
Laser (optical) trap
A focused laser beam holds a small bead attached to an actin filament; when myosin heads pull, the bead moves, and the calibrated trap stiffness turns that displacement into force. It measures single binding events, so the effect of a changed solution on the motor can be seen without the rest of the cell.
Phosphorus magnetic resonance spectroscopy
A coil over a muscle records the magnetic resonance signals of phosphorus-containing molecules, giving phosphocreatine, ATP and inorganic phosphate in living tissue. The shift of the phosphate peak relative to phosphocreatine estimates intracellular pH, so metabolites and force can be followed together during contraction.
Practice questions on this lesson (3) → MCAT-style, original, each with an explanation
Where this lesson fits
Before thisReview first
- Muscle, Bone and MovementOrganismal Biology · Starting college
It teaches sarcomeres, sliding filaments and fibre types, which this lesson uses to explain length, force and speed.
- Respiration and ATPBiology · High school
It shows how cells make ATP by respiration, which you need for the three ATP supplies here.
- Molecular Motors and CargoCell Biology · College: the core
It explains how myosin heads step along actin and let go, the cross-bridge picture behind the force-velocity curve.
After thisStudy next
- Smooth Muscle and the Myogenic ResponseThis course · Lesson 4
It asks how a muscle with different filament and activation arrangements holds force, extending length, load and activation ideas.
- Cardiac Output and Venous ReturnThis course · Lesson 7
It uses the muscle pump in the legs to explain how blood returns to the heart.
- Exercise: The Whole Body at WorkThis course · Lesson 30
It applies muscle power, ATP supplies, fibre types and fatigue to the whole body at work.
Elsewhere on the siteFilms, simulations and method films in other courses
- Spectrophotometry and enzyme kineticsMethod film
Hill's force-velocity constants were fitted from measured rates, and this method shows how rates become fitted curves.
Suggested by an AI model from the lessons themselves, then checked. How we use AI
Finish line
Test yourself
8 questions
Practice and MCAT-style, with explained answers.
Next · Lesson 4
Smooth Muscle and the Myogenic Response
Raise the pressure inside a small artery and it narrows against the stretch instead of simply widening. What is the muscle sensing?
Continue →