Physiology · Unit 4: Breathing
Ventilation, Perfusion and Gas Exchange
Rewritten on : new text, figures and flashcards. Your notes and highlights stay, but the text around them may have moved.
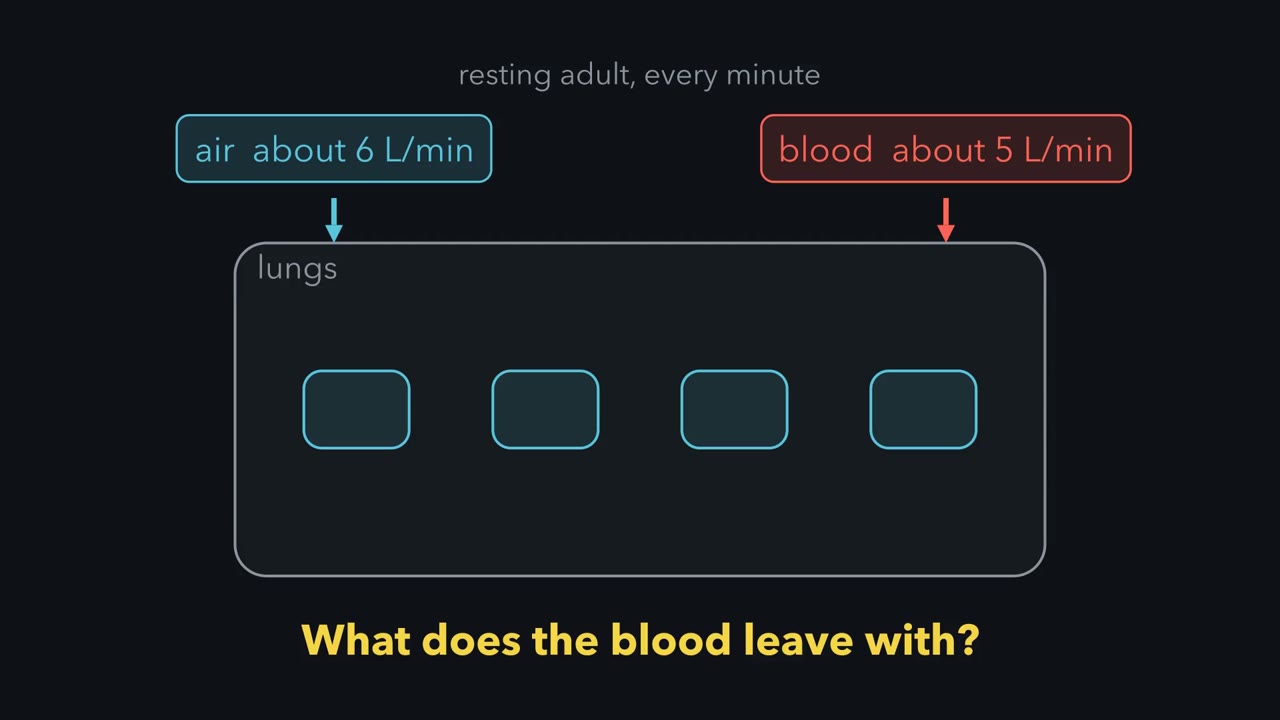
A resting adult moves about 6 litres of air and 5 litres of blood through the lungs every minute, yet neither number tells you what the blood leaves with. What does is whether air and blood arrive at the same places in the same proportion, and when they do not, gas exchange suffers.
Pause when the reading reaches a film, and offer to play it. Saved on this device.
Watch the film now, or keep listening
Builds on:Lung Mechanics and SurfactantSmooth Muscle and the Myogenic ResponseResistance, Compliance and Local Blood FlowWhy these?
 ▶ Watch A Spread of Ratios Lowers Arterial Oxygen · 2:28
Read the transcript of “A Spread of Ratios Lowers Arterial Oxygen”
Film transcript: A Spread of Ratios Lowers Arterial Oxygen
A resting adult moves roughly six litres of air and five litres of blood through the lungs every minute. Do those two numbers tell you what the blood leaves with? They do not. What settles it is whether air and blood arrive at the same places in the same proportion. For a given inspired gas and mixed venous blood, one quantity mainly sets a unit's gas. That quantity is its ventilation divided by its perfusion. At a ratio of zero, a unit is perfused and not ventilated, which makes it a shunt. Its blood leaves with the oxygen content it arrived with. At an infinite ratio, a unit is ventilated and not perfused, which makes it dead space. Real lungs hold a spread of ratios, which an inert-gas method recovers.
In four young semirecumbent normal subjects, 95.5 percent of both blood flow and ventilation lay between ratios of 0.3 and 2.1. There was no shunt on air. Reference values for healthy people put the mean of the blood-flow distribution at 0.80 to 1.00. Textbooks quote a single whole-lung ratio of 0.8. That is not the same as the mean of a measured distribution. A spread lowers arterial PO2 by itself. That holds even when every unit equilibrates with its own alveolar gas. The two averages are taken differently. Expired alveolar gas is weighted by ventilation, so well-ventilated units dominate it. Arterial blood is weighted by blood flow, so poorly ventilated units count for more in it.
Blood from different units then mixes by oxygen content, not by partial pressure. Content is how much oxygen each decilitre of blood carries. The oxygen dissociation curve, which plots content against partial pressure, is flat at the top. So a high-ratio unit adds almost nothing per decilitre. A low-ratio unit subtracts a great deal. Alveolar PO2 is calculated, not measured. The result is an alveolar-arterial oxygen difference, even when every unit equilibrates with its own alveolar gas. It is a difference, not a diffusion gradient. Each unit's ratio mainly sets its gas, for a given inspired gas and mixed venous blood. A spread of ratios alone can widen the alveolar-arterial difference.
A resting adult moves roughly 6 litres of air and 5 litres of blood through the lungs every minute, and neither number tells you what the blood leaves with. What settles that is whether air and blood arrive at the same places in the same proportion. Gas exchange and breathing gave partial pressure, Fick’s law and minute against alveolar ventilation; lung mechanics and surfactant gave the pressures that move the air. Here you put numbers on the matching.
The one idea to carry through this lesson. Blood mixes oxygen, not pressure, and hemoglobin’s curve is flat at the top. In full: blood leaving the lung is a flow-weighted mix of the oxygen content from every unit, and each unit’s content is set by its own ratio of ventilation to perfusion. Raising a unit’s ratio above about 1 adds almost no content (its PO2 cannot climb past the inspired 150 mmHg, and hemoglobin is already about 98% saturated), while lowering a ratio below about 0.5 removes a lot. So any spread of ratios lowers arterial PO2 below what the same total air and blood would give if they were evenly matched, and widens the alveolar-arterial difference with no diffusion problem anywhere.
The direction of the rule holds at steady state, on air or modestly enriched oxygen, with each unit equilibrating with its own gas (the worked numbers below are first-instant values). It does not cover hypoventilation, too little air for the whole lung (a normal alveolar-arterial difference with a high PCO2), or diffusion limitation, blood leaving before it equilibrates (in healthy people mainly in heavy exercise; in disease, a thickened barrier). And it is a rule about oxygen; carbon dioxide behaves differently.
About the film at the top of the page: its two reasons a spread lowers arterial oxygen are that expired gas and blood are weighted differently and that blood mixes by content. This lesson leads with content mixing; the weighting point and the film’s inert-gas numbers are in Going deeper.
One ratio sets each unit’s gas
Think of the lung as many small units, each with its own air supply (ventilation) and blood supply (perfusion). For a given inspired gas and mixed venous blood, one quantity mainly sets a unit’s gas composition: its ventilation divided by its perfusion, the ventilation-perfusion ratio.
Mixed venous blood is the blood that arrives: venous blood from the whole body after mixing, sampled in the pulmonary artery (cardiac output and venous return). At rest its PO2 is typically about 40 mmHg and its PCO2 about 46 mmHg. Humidified inspired air has a PO2 of about 150 mmHg and almost no carbon dioxide. Every unit’s gas lies between those two.
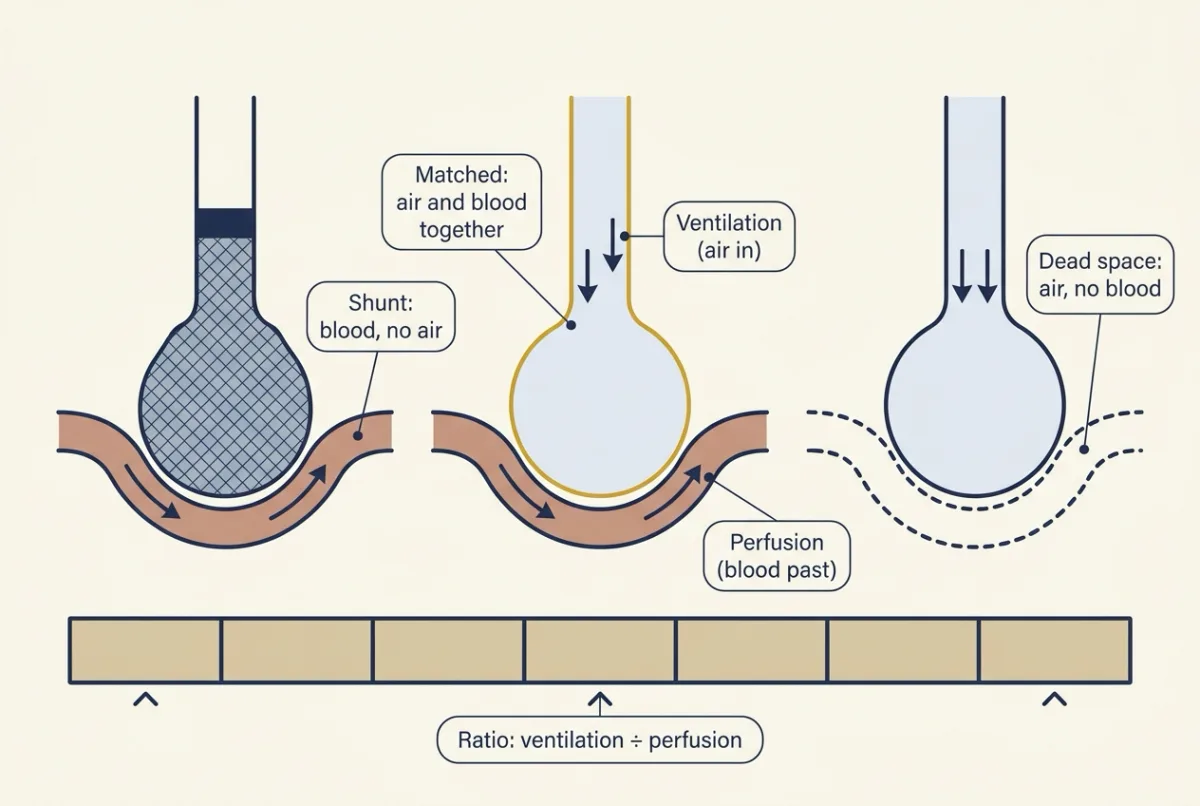
The two ends have names. At a ratio of zero the unit is a shunt: perfused and not ventilated. At an infinite ratio it is dead space: ventilated and not perfused.
Predict. What PO2 and PCO2 does blood leaving a shunt unit carry? What gas sits in a dead-space unit?
Check your prediction
Shunt blood never meets fresh air, so it leaves as mixed venous blood, PO2 about 40 and PCO2 about 46 mmHg, with the oxygen content it arrived with. The dead-space unit holds inspired gas: PO2 about 150 mmHg, PCO2 near zero.
| Ratio | 0 (shunt) | 0.1 | 0.3 | 0.84 | 1.6 | 10 | infinite (dead space) |
|---|---|---|---|---|---|---|---|
| PO2 (mmHg) | 40 | 45 | 59 | 101 | 123 | 145 | 150 |
| PCO2 (mmHg) | 46 | 45 | 44 | 40 | 36 | 17 | 0 |
| O2 content (mL per dL) | 15.2 | 16.4 | 18.3 | 20.0 | 20.2 | 20.4 | no blood |
Illustrative values from a simple one-unit model with the mixed venous values above and hemoglobin 15 g per dL (Going deeper, “The model behind the numbers”). 0.84 is the evenly matched ratio of a resting lung, 4.2 L of air over 5 L of blood per min; a dead-space unit has no content because no blood flows through it.
Read the PO2 row both ways from the matched 0.84. Downward it falls fast, and below about 0.1 a unit’s PO2 is close to mixed venous (45 against 40 at 0.1). Upward it climbs with diminishing returns and never passes the inspired 150. PCO2 runs the other way.
Real lungs hold a spread of ratios, which Wagner, Saltzman and West’s inert-gas method recovers (six infused gases of differing solubility, measured in blood and breath). In healthy young people nearly all blood flow and ventilation lie in a narrow band, with little or no shunt on air; the mean of the blood-flow distribution is 0.80 to 1.00 and shunt is below 1 percent of cardiac output. Ventilation-perfusion mismatch is the commonest cause of low arterial oxygen, and the next two sections show why.
Partial pressure is not content
Look at the last row of the table. Dalton’s law gives each gas its share of the total pressure; Henry’s law says how much dissolves at that pressure. About 0.003 mL of oxygen dissolves per dL of blood per mmHg, so 100 mmHg dissolves only 0.3 mL per dL, which is why nearly all of it rides on hemoglobin (oxygen transport, with protein binding and allostery for the sigmoid curve). Carbon dioxide is roughly twenty times more soluble, and moves its load on a few mmHg.
So a unit’s oxygen content, the mL of oxygen each dL of blood carries, comes off the dissociation curve, which has two regions. On the flat top, ratios from 0.84 up to 10 raise PO2 by some 44 mmHg but content only from 20.0 to 20.4 mL per dL: hemoglobin is already about 98% saturated. On the steep part, ratios from 0.84 down to 0.1 drop content to 16.4 mL per dL; below about 60 mmHg every mmHg costs content.
Two units: why a spread costs oxygen
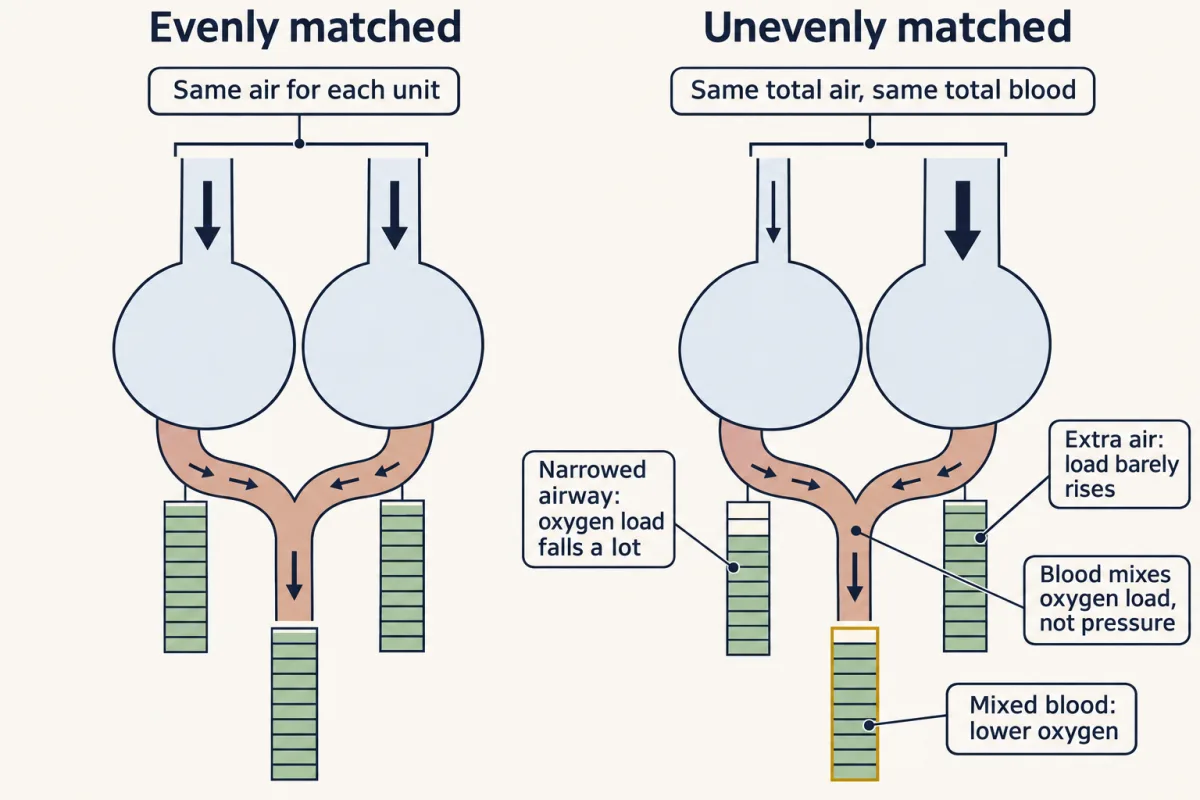
Here is the whole idea in one small lung. It has two units, each getting half the blood, 2.5 L per min, and between them 4.2 L per min of alveolar air, a normal resting amount. Every unit fully equilibrates with its own alveolar gas.
Evenly matched. Give each unit 2.1 L per min of air. Both have a ratio of 2.1 / 2.5, about 0.84, both reach a PO2 of about 100 mmHg, and both send on blood carrying about 20.0 mL O2 per dL. The mix is 20.0 mL per dL and arterial PO2 is about 100 mmHg.
Unevenly matched. Now narrow one unit’s airway so it gets only 0.25 L per min (ratio 0.25 / 2.5 = 0.1), and send the rest, 3.95 L per min, to the other (ratio 3.95 / 2.5, about 1.58). Totals are unchanged; only the split has changed.
| Unit A (airway narrowed) | Unit B (open) | |
|---|---|---|
| Ratio | about 0.1 | about 1.58 |
| PO2 | about 45 mmHg | about 122 mmHg |
| PCO2 | about 45 mmHg | about 36 mmHg |
| Saturation | about 81% | about 99% |
| O2 content | about 16.4 mL per dL | about 20.2 mL per dL |
| Change from matched | −3.6 mL per dL | +0.2 mL per dL |
Predict. The two streams of blood join in equal amounts. What is the PO2 of the mixed arterial blood?
Check your prediction
About 59 mmHg, not the 84 mmHg you get by averaging 45 and 122.
Blood does not mix partial pressures; it mixes oxygen. Average the contents: (16.4 + 20.2) / 2 = 18.3 mL per dL. Then read that content back off the dissociation curve. 18.3 mL per dL is about 90% saturation, and 90% saturation sits at a PO2 of about 59 mmHg.
Three things happened.
- Unit B could not make up for unit A. Nearly twice its share of air raised its PO2 by more than 20 mmHg but added only 0.2 mL per dL: the flat top.
- Unit A lost a great deal. Its PO2 fell onto the steep part of the curve, and its blood left carrying 3.6 mL per dL less.
- The mix landed below the flat top too. At 18.3 mL per dL the mixed blood sits where the curve is already steepening, so a modest shortfall in content reads as a large fall in PO2.
Arterial PCO2 hardly moves at first: about 40.5 mmHg, the average of unit A’s 45 and unit B’s 36. Carbon dioxide’s curve is nearly straight, so mixing contents is close to mixing partial pressures, and the extra carbon dioxide unit B blows off offsets most of what unit A keeps. The small shortfall in carbon dioxide output is made up when the controller raises total ventilation.
This is also why a person with mismatch can breathe harder and bring arterial PCO2 down while arterial PO2 improves much less. The extra air mostly reaches the open units, which can shed more carbon dioxide but load little more oxygen.
Because arterial PCO2 stays near 40, the alveolar gas equation (next section), taking R as 0.8, still puts the ideal alveolar PO2 near 99 mmHg, and, at that first instant, arterial PO2 is about 99 − 59 = 40 mmHg short. That gap, the alveolar-arterial oxygen difference, appeared with no diffusion limit and no shunt: a spread of ratios is enough.
These first-instant numbers hold mixed venous blood at 40 and 46 mmHg, when the lung takes up about a third less oxygen. As mixed venous PO2 falls until uptake recovers, arterial PO2 ends lower still, so the gap is if anything larger (Going deeper, “The model behind the numbers”). A healthy lung holds a narrow version of this spread, so its difference is small; widen the spread, as when airways narrow in some regions and not others, and the same arithmetic produces a large one.
Measuring the gap: alveolar PO2 and the A-a difference
In a person no sample of alveolar gas serves as the mean, so alveolar PO2 is calculated, not measured. Watch the letter case from here on: capital A (PAO2, PACO2) is alveolar, small a (PaO2, PaCO2) is arterial.
The calculation does not create the gap; mismatch (or shunt, or diffusion limitation) does. It shows the gap by giving the alveolar PO2 a perfectly matched lung would have at the measured arterial PCO2, the “ideal” comparison that goes back to Riley and Cournand’s 1949 analysis. Two steps get there. Inspired gas is humidified to 47 mmHg of water vapour at 37 C, so that pressure comes off barometric pressure first. Then the body removes oxygen and adds carbon dioxide in a ratio R, the respiratory quotient: carbon dioxide produced per oxygen consumed, about 0.8 at steady state on a mixed diet. The alveolar gas equation puts the two steps together.
In words Alveolar oxygen pressure equals the oxygen fraction of the humidified inspired gas, minus the arterial carbon dioxide pressure divided by the respiratory quotient.
- PAO2“P capital A O 2”
- mean alveolar partial pressure of oxygenmmHg
- FiO2“F i O 2”
- fraction of inspired oxygen, 0.21 in airno unit
- PB“P B”
- barometric pressure, 760 mmHg at sea levelmmHg
- PH2O“P H 2 O”
- water vapour pressure, 47 mmHg at 37 CmmHg
- PaCO2“P small a C O 2”
- arterial partial pressure of carbon dioxide, standing in for alveolarmmHg
- R“R”
- respiratory quotient, carbon dioxide produced per oxygen consumed, about 0.8no unit
Sanity check The first term is the oxygen you breathe in; the second is what the carbon dioxide displaces. Hold everything else fixed: a higher PaCO2 lowers PAO2, and a higher FiO2 raises it.
Try one number
At sea level on air, with PB 760 mmHg and arterial PCO2 40 mmHg:
Humidified inspired oxygen: 0.21 × (760 − 47) = 0.21 × 713 = 149.7 mmHg.
Carbon dioxide term: 40 / 0.8 = 50 mmHg.
PAO2 = 149.7 − 50 = 99.7, about 100 mmHg.
Need a refresher? subscripts and Greek letters · rates and “per”
Each term carries an assumption: a steady state, a value for R assumed rather than measured, an inspired oxygen fraction near that of air, and arterial PCO2 standing in for alveolar PCO2.
The alveolar-arterial oxygen difference is PAO2 minus PaO2. It is under about 10 mmHg in a young adult, and it rises with age and with inspired oxygen fraction. It is a difference, not a diffusion gradient: no pressure of that size pushes oxygen across the barrier.
- Arterial PCO₂, 0.863 × VCO₂ ÷ VA
- 0.863 × 195 ÷ 4.2 = 40 mmHg
- Inspired PO₂ once humidified, FiO₂ × (PB − 47)
- 0.21 × 713 = 149.7 mmHg
- Alveolar PO₂, inspired − PaCO₂ ÷ R
- 149.7 − 50.0 = 99.7 mmHg
- A-a difference, PAO₂ − PaO₂
- 99.7 − 92 = 7.7 mmHg
- PaO₂ that would keep the difference at the worked problem’s 7.7 mmHg
- 92.0 mmHg
A high PaCO₂ with a normal A-a difference points to hypoventilation; a near-normal PaCO₂ with a wide difference points to a spread of ratios, shunt or diffusion limitation, which this calculator cannot tell apart.
In this sketch: steady state, near room air, at sea level; no shunt, no diffusion limitation and no oxygen dissociation curve are modelled, and the sketch does not compute the ventilation-perfusion spread; the two-unit preset only enters the lesson’s arterial PO₂ for it. Arterial PCO₂ stands in for alveolar PCO₂, as the lesson’s equation assumes, and is rounded to a whole mmHg as the worked problem does. Held fixed and illustrative: carbon dioxide output VCO₂ 195 mL per min (the worked problem’s made-up value for a healthy young adult at rest, supine), barometric pressure 760 mmHg, water vapour pressure 47 mmHg at 37 °C. R is assumed rather than measured, and is set here by hand independently of VCO₂. The slider ranges, including FiO₂ from 0.21 to 0.30, R from 0.70 to 1.00 and PaO₂ from 40 to 150 mmHg, are made up for the sketch. VA is set by hand; the sketch does not model the controller that, the lesson says, defends arterial PCO₂. PaO₂ is typed in, not calculated. The simplified equation omits a small correction that grows with PaCO₂ and with FiO₂, so treat values as good to a few mmHg.
Alveolar PO₂ is calculated from what is breathed in, FiO₂ × (PB − 47), less the carbon dioxide term PaCO₂ ÷ R, and PaCO₂ falls as alveolar ventilation rises; the A-a difference is that calculated value minus the arterial PO₂ from a blood sample.
Dead space: the high end, measured
The infinite end of the ratio line has its own measurement. Dead space is ventilation wasted on gas that never meets flowing blood; Christian Bohr (1855 to 1911) described it in 1891 as the part of the tidal volume that does not undergo gas exchange.
His argument is mass balance. All the carbon dioxide in an expired breath came from units that exchanged, and dead-space gas contributes none, so mixed expired partial pressure is a dilution of the alveolar one. How much it is diluted tells you what fraction of the breath was dead space:
In words The dead-space fraction equals the alveolar carbon dioxide pressure minus the mixed expired pressure, as a share of the alveolar pressure.
- VD“V D”
- dead-space volume: the part of the breath that does not exchange gasmL
- VT“V T”
- tidal volume, the whole breathmL
- PACO2“P capital A C O 2”
- mean alveolar partial pressure of carbon dioxide. Capital A means alveolar.mmHg
- PECO2“P E C O 2”
- partial pressure of carbon dioxide in the mixed expired breathmmHg
Sanity check With no dead space the expired gas is pure alveolar gas, PECO2 equals PACO2, and the fraction is zero. If the whole breath were dead space, PECO2 would be zero (air carries almost none) and the fraction would be 1.
Try one number
Count first, with round values to keep the arithmetic easy (not the worked problem’s numbers). Alveolar gas holds carbon dioxide at 40 mmHg. If one quarter of a breath is dead space carrying none, the mixed breath holds three-quarters of 40 = 30 mmHg.
Now run the equation backwards from those pressures: (40 − 30) / 40 = 10 / 40 = 0.25. One quarter, as built in.
Need a refresher? rates and “per”
No sample gives PACO2, so in 1938 Enghoff proposed replacing it with arterial PCO2, which a blood sample does give:
VD/VT = (PaCO2 - PECO2) / PaCO2
That substitution assumes arterial PCO2 equals mean alveolar PCO2. It fails when blood reaches the left side of the circulation without being ventilated, because that blood raises PaCO2 above PACO2 and inflates the computed fraction. What you get is physiologic dead space, which includes alveolar units ventilated far more than they are perfused. Fowler’s single-breath nitrogen method, which reads where expired nitrogen concentration changes as airway gas washes out, measures something closer to the anatomic dead space of the conducting airways; the two are not interchangeable. In healthy people the physiologic fraction is 0.20 to 0.40 of the tidal volume by the inert-gas method.
Units that lose capillaries while still ventilated move toward dead space, and the fraction rises. But a raised fraction usually means a wider spread of ratios, not large regions of alveoli with no blood flow: that was the main mechanism across the conditions one 2015 review surveyed. Nor does wasted ventilation usually raise arterial PCO2: the controller raises total ventilation to defend it (control of breathing), so the cost appears as more work of breathing.
Hypoxic lungs constrict their own arteries
In systemic beds, low oxygen dilates arterioles and brings more blood (resistance, compliance and local flow). The pulmonary circulation does the opposite, so flow leaves a poorly ventilated region rather than pooling in it. That pushes a low-ratio unit’s ratio back up.
Von Euler and Liljestrand’s 1946 preparation was an anaesthetized cat with the chest opened, ventilated by pump with gas mixtures of chosen composition, with pulmonary arterial pressure recorded. If the lung vessels behaved like systemic ones, hypoxia should have lowered that pressure; if the response ran through nerves, cutting them should have abolished it. Ventilation with 10.5 percent oxygen strongly raised the pressure and pure oxygen lowered it slightly, and the rise survived cutting the vagi and removing the stellate ganglia. They concluded it was due in part to a direct constrictive action of hypoxia on the vessels. Keep that hedge: a pressure is not a resistance unless flow and outflow pressure are known, and whole-lung hypoxia cannot test regional matching.
In outline, hypoxia inhibits an outward potassium current in pulmonary artery smooth muscle, depolarizing the cell and opening voltage-gated calcium channels, one route among several that include mitochondrial reactive oxygen species and calcium sensitization (smooth muscle). The sensor upstream of that step is still described in reviews as hypothesized, with mitochondria the leading candidate. The response does little in healthy lungs at rest on air at sea level, and matters when ventilation becomes regionally uneven or at altitude. Release of the same hypoxic constriction is one contributor to the fall in pulmonary vascular resistance as the lungs aerate at birth (pregnancy, birth and lactation).
Predict. A lung has some poorly ventilated units, and a drug blunts hypoxic constriction. What happens to arterial PO2?
Check your prediction
It falls further. Flow returns to the poorly ventilated units, so a larger share of the blood leaves with low content, and the mix drops.
Top and bottom of the upright lung
In the upright human lung both ventilation and perfusion per unit volume are greater at the base than at the apex, and perfusion changes more steeply, so the ratio is higher at the apex.
West, Dollery and Naimark’s zones come from an isolated-lung preparation in which arterial, venous and alveolar pressures could each be set. They state a condition for flow rather than mark anatomic bands:
| Zone | Pressures | Blood flow |
|---|---|---|
| 1 | alveolar > arterial > venous | none |
| 2 | arterial > alveolar > venous | follows arterial minus alveolar pressure |
| 3 | arterial > venous > alveolar | continuous, following arterial minus venous pressure |
Because they are pressure relations, posture, blood volume and ventilation move them. How much of the remaining unevenness is gravity is unsettled; the dog microsphere data are in Going deeper.
Sorting low arterial oxygen with three numbers
A 2015 review lists six mechanisms that lower arterial PO2: a low inspired oxygen partial pressure, hypoventilation, ventilation-perfusion inequality, diffusion limitation, shunt, and a low mixed venous oxygen content. Inequality and shunt are the most frequent, and three numbers separate most of the six: arterial PCO2, the alveolar-arterial difference, and the response to a higher inspired oxygen fraction.
| Mechanism | Arterial PCO2 | A-a difference | Arterial PO2 on more oxygen |
|---|---|---|---|
| Low inspired PO2 | normal or low | normal | rises |
| Hypoventilation | high | normal | rises |
| Ventilation-perfusion mismatch | often near normal | wide | rises well (less at very low ratios) |
| Diffusion limitation | usually near normal | wide | rises |
| Shunt | usually near normal | wide | rises little; stays far below the no-shunt value |
The sixth, a low mixed venous content, acts through the others: shunted and very low-ratio blood leaves carrying close to venous content, so a lower venous content deepens their effect. Mismatch and diffusion limitation look alike on all three numbers, so separating them needs further measurements.
Worked problem: from breath to blood. Made-up but typical values for a healthy young adult at rest, supine, breathing air at sea level. Tidal volume 500 mL, rate 12 per min, PaCO2 40 mmHg, mixed expired PECO2 28 mmHg, PaO2 92 mmHg, FiO2 0.21, PB 760 mmHg, PH2O 47 mmHg, R 0.8. Assume a steady state and no shunt.
- Minute ventilation. 500 mL × 12 per min = 6,000 mL per min.
- Dead-space fraction. (40 − 28) / 40 = 0.30, inside the healthy 0.20 to 0.40, so dead space is 0.30 × 500 = 150 mL.
- Alveolar ventilation. (500 − 150) × 12 = 4,200 mL per min, or 4.2 L per min.
- Carbon dioxide output. The alveolar ventilation relation PaCO2 = 0.863 × VCO2 / VA (0.863 converts between the units the two volumes are measured in; Going deeper) rearranges to VCO2 = PaCO2 × VA / 0.863 = 40 × 4.2 / 0.863 = 195 mL per min.
- Alveolar PO2. 0.21 × (760 − 47) − 40 / 0.8 = 149.7 − 50.0 = 99.7 mmHg.
- A-a difference. 99.7 − 92 = 7.7 mmHg, under the roughly 10 mmHg expected in a young adult.
Predict. Now halve alveolar ventilation, with the same carbon dioxide output and nothing else about the lung changed. What happens to PaCO2, to calculated alveolar PO2, and to the A-a difference?
Check your prediction
- Halve alveolar ventilation to 2.1 L per min at unchanged carbon dioxide output: PaCO2 = 0.863 × 195 / 2.1 = 80 mmHg (doubled) and PAO2 = 149.7 − 100 = 49.7 mmHg. Matching has not changed, so assume the difference stays near 8 mmHg: PaO2 is about 42 mmHg. Low PO2, high PCO2, normal difference: hypoventilation, since mismatch, shunt and diffusion limitation all widen the difference. At FiO2 0.30, PAO2 = 0.30 × 713 − 100 = 113.9 mmHg, and with the same assumed difference PaO2 rises to a little over 100 mmHg (about 106) while PaCO2 stays at 80 mmHg. These use the simplified equation; the full form adds a few mmHg (Going deeper).
- A contrast. PaO2 55 mmHg with PaCO2 40 mmHg gives a difference of 99.7 − 55 = 44.7 mmHg. Hypoventilation alone cannot produce that.
- Shunt on air. Take the illustrative contents from oxygen transport: hemoglobin 15 g per dL, end-capillary content on air 20.00 mL O2 per dL, mixed venous 15.20. If one fifth of the flow bypasses ventilated units, arterial content is 0.80 × 20.00 + 0.20 × 15.20 = 19.04 mL per dL, which corresponds to a PaO2 of about 70 mmHg.
- Shunt on pure oxygen. Once nitrogen has washed out, the full equation reduces to inspired PO2 minus PaCO2, so PAO2 = 760 − 47 − 40 = 673 mmHg (the simplified form above would give 663 mmHg). End-capillary content is 1.34 × 15 × 1.00 + 0.003 × 673 = 22.12 mL per dL.
Predict. Alveolar PO2 has risen nearly sevenfold, from 99.7 to 673 mmHg. One fifth of the blood still bypasses. Roughly what arterial PO2 do you expect?
Check your prediction
Only about 220 mmHg, against 673 with no shunt.
Holding mixed venous content at 15.20 (it would rise a little), arterial content becomes 0.80 × 22.12 + 0.20 × 15.20 = 20.74 mL per dL: a gain of 1.70 mL per dL, about 9 percent. Read back off the dissociation curve, 20.74 mL per dL is a PaO2 of about 220 mmHg (213 if the blood is taken as fully saturated, 227 on the standard curve). The shunted blood never saw the oxygen, and it dilutes whatever the rest achieves.
- Shunt fraction from contents. Recover the fraction from the contents alone, as the arterial shortfall over the largest possible shortfall (end-capillary minus arterial, over end-capillary minus mixed venous): (22.12 − 20.74) / (22.12 − 15.20) = 1.38 / 6.92 = 0.20.
The percentage gain in content is small mostly because hemoglobin is nearly saturated either way, so compare arterial PO2 against what no shunt would predict. A low-ratio unit is still ventilated, so filling it with oxygen usually saturates its blood, though at very low ratios the correction is incomplete and high oxygen can collapse the unit by absorption atelectasis (the oxygen is absorbed and the unit empties).
Diffusion limitation is the mechanism these numbers do not reach. A red cell spends about 0.75 s in a pulmonary capillary at rest and roughly 0.25 s suffices for equilibration, so oxygen transfer in healthy lungs at rest is limited by blood flow rather than by the barrier, though oxygen can become diffusion limited when transit is shortened; carbon monoxide, whose partial pressure in blood stays near zero, is the diffusion-limited case. What arterial PCO2 does to pH belongs to acid-base balance.
Design problem
A whole-animal pressure record like the 1946 cat experiment leaves the two gaps named above (pressure versus resistance, whole lung versus regions) and a third: the sensor is untouched. Design a short series that closes each gap.
Saved in this browser only.
One way to do it
Use an isolated lung, ventilated by pump and perfused at constant flow with a set outflow pressure. Then resistance = (inflow pressure - outflow pressure) / flow, so a pressure rise can only be a resistance rise, and nerves and hormones left with the rest of the animal.
Alternate normoxic and hypoxic ventilation. Expect a rise within seconds and an early peak within minutes, with a later sustained phase if hypoxia continues, reversing on reoxygenation, with time controls against drift and potassium chloride as a contraction control.
For redistribution, ventilate one lobe with the hypoxic mixture and the rest with air at constant total flow, and measure each region’s share with flow probes or radiolabeled microspheres. Matching predicts flow shifting away from the hypoxic lobe, raising its ratio.
For the sensor, repeat on lungs from animals lacking a candidate protein, as in the Cox4i2 knockout (Going deeper).
Limits: one species; buffer instead of blood and no extrinsic nerves; constant-flow perfusion is itself unphysiological; and an acute response says nothing about weeks of hypoxia.
Going deeper
The main line above does not depend on these details.
Measured spreads of ratios
In four young semirecumbent normal subjects studied by the inert-gas method, 95.5 percent of both blood flow and ventilation lay between ratios of 0.3 and 2.1, with no shunt on air. The textbook whole-lung ratio of about 0.8 is total alveolar ventilation over total blood flow, a single quotient rather than the mean of a measured distribution, which is why the reference mean of 0.80 to 1.00 can differ from it.
The model behind the numbers
The ratio table and the two-unit lung come from one simple model: a standard oxygen dissociation curve, hemoglobin 15 g per dL carrying 1.34 mL O2 per g, 0.003 mL per dL per mmHg dissolved, a near-straight carbon dioxide curve, mixed venous PO2 40 and PCO2 46 mmHg held fixed (the textbook “first instant” comparison), a steady-state mass balance in each unit, and inspired and expired volumes treated as equal. Every value is illustrative.
Holding mixed venous blood fixed has a cost. At that instant the two-unit lung takes up about 156 mL of oxygen per min, against 239 when matched, and gives off about 177 mL of carbon dioxide, an exchange ratio near 1.14 rather than 0.8. The ideal value of 99 mmHg uses the assumed R of 0.8, as a clinical calculation would; with the model’s own ratio the full equation gives about 113 mmHg and an A-a difference near 54. Let mixed venous blood settle until uptake recovers, at the same ventilation, and mixed venous PO2 falls to about 30 mmHg, arterial PO2 to about 46 and arterial PCO2 rises to about 44.5.
Why the curve’s shape matters
Run the same two-unit lung with a straight-line oxygen curve drawn from the mixed venous point (40 mmHg, 15.2 mL per dL) to the matched end-capillary point (about 101 mmHg, 20.0 mL per dL), and redo each unit’s mass balance. The units reach about 54 and 117 mmHg, and arterial PO2 falls to about 85 mmHg, an A-a difference of about 14 mmHg, against 59 and 40 with the real curve. So a spread costs oxygen even without the flat top, because a unit’s PO2 rises toward 150 mmHg with diminishing returns as its ratio climbs but falls steeply toward 40 as its ratio drops. That accounts for roughly a third of the cost; content mixing on the curve’s flat top supplies the rest.
The film’s weighting point concerns a different “alveolar” value. Expired alveolar gas is weighted by ventilation, so well-ventilated units like B dominate it; arterial blood is weighted by blood flow, so poorly ventilated units like A count for more in it than in expired gas. In this lung mixed expired alveolar gas reads about 118 mmHg, even higher than the ideal value of about 99 that the A-a difference uses. That makes expired gas look better than the blood, but the fall in arterial PO2 itself comes from the two effects in the paragraph above.
Units and the full alveolar gas equation
In PaCO2 = 0.863 × VCO2 / VA, VCO2 is in mL per min at standard temperature and pressure, dry, and VA is in L per min at body temperature and pressure, saturated; 0.863 carries that conversion.
The worked problem uses the simplified alveolar gas equation. The full form subtracts PaCO2 × [FiO2 + (1 − FiO2)/R], which at R 0.8 adds FiO2 × PaCO2 × (1 − R)/R: about 4 mmHg on air at a PaCO2 of 80 mmHg (2 mmHg at 40), and about 6 mmHg at FiO2 0.30 with PaCO2 80 mmHg.
The Cox4i2 knockout and the sensor
In 2017 Sommer, Weissmann and colleagues reported that isolated ventilated, buffer-perfused lungs from mice lacking the cytochrome c oxidase subunit isoform Cox4i2 showed no acute constriction to hypoxia while constricting normally to potassium chloride, and that chronic hypoxic pulmonary hypertension was not affected, with vascular remodeling only slightly affected. One species, one isoform, buffer rather than blood: it places the defect, in sensing or its signaling, upstream of contraction in mouse lungs, and the sensor remains an open question in humans. Potassium chloride depolarizes the cell directly, so it shows the contractile machinery works but does not test the potassium-channel step; and an acute control says nothing about the chronic response.
Gravity and flow: the dog microsphere data
West’s zones are pressure relations, and gravity sets them only in part. In anaesthetized supine and prone dogs under zone 3 conditions, with flow in 1.9 cubic centimetre pieces measured by radiolabeled microspheres, vertical height explained only about 6 and 2 percent of the variability, and Glenny and colleagues concluded in 1991 that neither height nor radial position was the principal determinant there. That leaves upright humans, and zones 1 and 2, open.
Your notes
Select any text in the lesson to highlight it or add a note to it. Your highlights and notes are saved in this browser and collected in your notebook.
This browser is not letting the site save anything (a private window or strict privacy settings), so highlights and notes will be lost when you leave the page.
How we measure it
Multiple inert gas elimination technique (MIGET)
Six inert gases of differing blood solubility are infused in a vein, then measured in arterial blood and mixed expired gas. Because a gas's retention depends on the ventilation-perfusion ratio of the units it passes through, the set of six constrains a near-continuous distribution of blood flow and ventilation over those ratios, including the shunt and dead-space ends.
Mixed expired gas collection with arterial blood gases
Expired gas is collected over minutes so its mean carbon dioxide partial pressure can be measured, alongside arterial PCO2 and PO2 from a blood sample. The pair gives the Bohr dead-space fraction in Enghoff's arterial form and the alveolar-arterial oxygen difference once alveolar PO2 is calculated.
Isolated ventilated, buffer-perfused lung
A lung is removed with its airway and vessels, ventilated by a pump and perfused with buffer at a set flow and a set outflow pressure. Perfusion pressure then reports vascular resistance, and extrinsic nerves are disconnected and blood cells and circulating hormones are absent, so a response to hypoxic ventilation must arise in the lung itself.
Radiolabeled microspheres for regional perfusion
Spheres too large to pass capillaries are injected into the venous side and lodge in proportion to local blood flow. The lung is then cut into small pieces and counted, giving a map of flow per gram that can be compared with a piece's height, posture and position in the branching tree.
Practice questions on this lesson (5) → MCAT-style, original, each with an explanation
Where this lesson fits
Before thisReview first
- Lung Mechanics and SurfactantThis course · Lesson 12
It gives the pressures that move air, which this lesson assumes when it splits ventilation among lung units.
- Smooth Muscle and the Myogenic ResponseThis course · Lesson 4
Hypoxic constriction of pulmonary arteries is built on smooth muscle contraction and its calcium and potassium-channel steps.
- Resistance, Compliance and Local Blood FlowThis course · Lesson 8
Hypoxia dilates systemic vessels, and you need that contrast and the resistance idea to see why lung vessels constrict.
After thisStudy next
- Control of Breathing, Altitude and DivingThis course · Lesson 14
It uses arterial PCO2 and alveolar oxygen to show how breathing is driven, and how altitude changes it.
- Exercise: The Whole Body at WorkThis course · Lesson 30
It asks which link in oxygen delivery limits uptake, using the matching and diffusion ideas from here.
- Pregnancy, Birth and LactationThis course · Lesson 29
The fall in lung vascular resistance at birth uses release of hypoxic constriction as the lungs fill with air.
Elsewhere on the siteFilms, simulations and method films in other courses
- The Last Gas the Blood TouchesFilm · Organismal Biology
It shows oxygen and carbon dioxide crossing exchange surfaces by partial pressure difference, the step this lesson builds on.
- Area, thickness and rateSimulation · Organismal Biology
It lets you vary area, thickness and rate to see how exchange depends on the partial pressure difference.
- Why Blood Needs an S-Shaped CarrierFilm · Organismal Biology
It shows how dissolved oxygen differs from hemoglobin-bound oxygen, the partial pressure versus content point used here.
Suggested by an AI model from the lessons themselves, then checked. How we use AI
Finish line
Test yourself
11 questions
Practice and MCAT-style, with explained answers.
Next · Lesson 14
Control of Breathing, Altitude and Diving
Hold your breath and the urge that finally defeats you comes mostly from rising carbon dioxide rather than from falling oxygen. Why is the controller built that way?
Continue →