Cell Biology · Unit 1: Seeing and testing cells
New to this? Review it at high school level: The Cell Theory and Its Evidence
Cells Control Their Size: A Measured Eukaryotic Cell
Rewritten on : new text, flashcards and film. Your notes and highlights stay, but the text around them may have moved.
A cell has no ruler, so how does it know its size, and what does being big cost it?
Pause when the reading reaches a film, and offer to play it. Saved on this device.
Watch the film now, or keep listening
Builds on:Size, Scale and SurfaceThe Cell Cycle and MitosisOrganelles as a SystemWhy these?
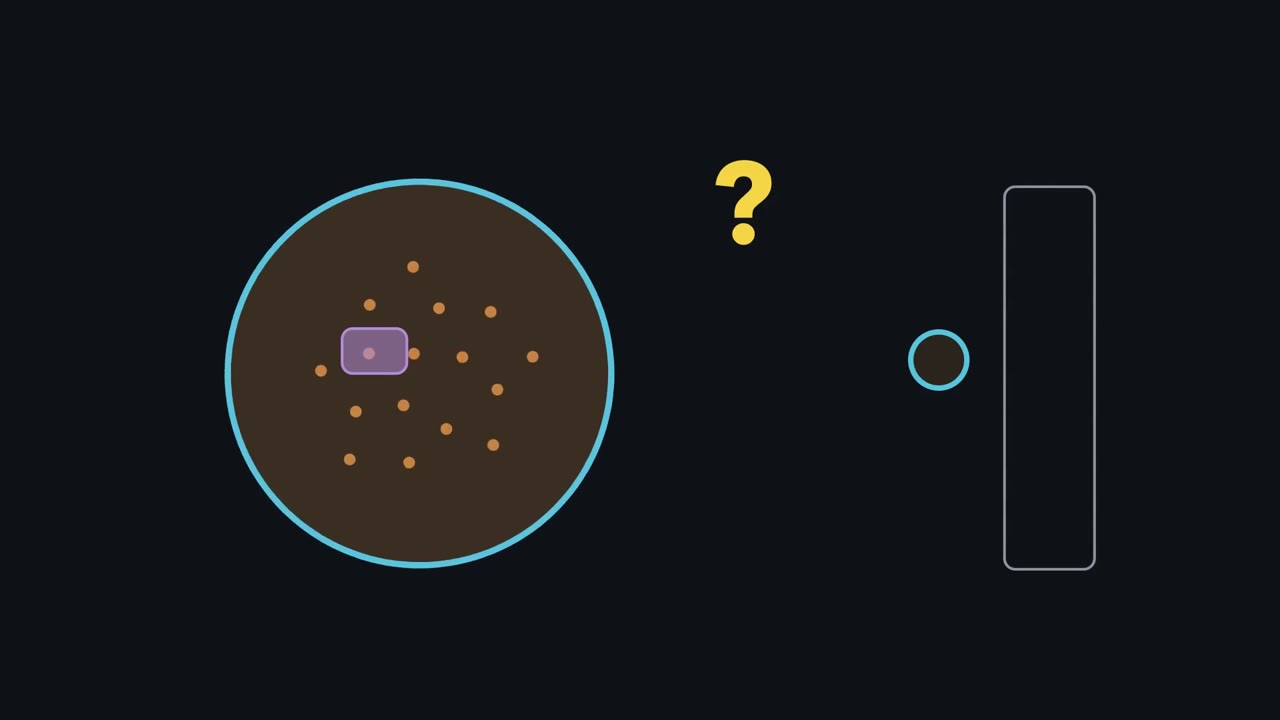 ▶ Watch Amount over Volume · 3:33
Read the transcript of “Amount over Volume”
Film transcript: Amount over Volume
A yeast cell has no ruler. So how does it know when it is big enough to divide, and why would being too big hurt? One thing a cell can sense is a concentration: the amount of something, divided by the room it has. The gauge on the right reads it. Watch ten red dots. The number stays the same, the room grows, and the concentration falls. A leading model, still debated, says budding yeast uses this as a ruler. Each newborn daughter, whatever its size, gets about the same dose of a brake protein called Whi5. It holds back Start, the point where the cell commits to dividing. As the cell grows, the brake spreads through more room and the gauge sinks.
At the green line the brake gives way, and the cell commits. Now two newborns, one small and one large, each with the same red dose. Which must grow more before it commits? Pause and decide. The small one. Its dots start crowded, so its gauge starts higher, and it must grow more to dilute them. That works only because both got the same dose. In this simple model, both commit at the same size. Real cells are noisier, and close only part of the gap.
That is the one idea: amount over volume. As a cell grows, it dilutes anything whose amount does not keep pace. For most other contents, dilution is a danger. RNA and protein, the orange dots, do the cell's work. So most growing cells make them roughly in step with their volume. Their gauge stays flat. Their total amount grows with the cell, but their concentration does not, so it cannot be the ruler. Two things can fall behind. First, the genome, the cell's DNA, drawn as the purple block. Yeast held so they grow without dividing kept one copy while they swelled many times over. Their synthesis fell behind, so their cytoplasm, the material outside the nucleus, was diluted: the orange dots thinned out.
RNA is copied from the DNA. At such sizes, one genome copy appears to become a limit. The second is the surface. Everything the cell takes in crosses its membrane, the blue rim. But it uses what it takes in throughout its volume. Take a sphere, the simplest shape, and double its radius. The rim's area rises four times, the volume eight. So each bit of the inside has half as much membrane feeding it.
So one gauge does four jobs. A diluted brake may tell yeast its size. RNA and protein keep pace, so their concentrations stay steady. A single genome can fall behind, and so can a sphere's surface: two costs of being big.
From the film
- In a leading but debated model, budding-yeast daughters get about the same dose of the brake Whi5, so a small one must grow more to dilute it before Start, closing only part of the size gap.
- Most growing cells make RNA and protein roughly in step with their volume, so their concentrations stay about steady, and a steady concentration cannot tell a cell its size.
- Yeast held so they grow without dividing fell behind in synthesis and their cytoplasm was diluted; at such sizes one genome copy appears to become a limit.
- For a sphere, doubling the radius halves the membrane available to each unit of volume.
In 1977 Leland Hartwell and Michael Unger followed budding yeast as it divided unequally, into a large mother cell and a small daughter. The daughter waited longer before starting its next cycle, as if it first had to reach a size.
The first film above followed one ratio, amount over volume; it leaves out the evidence behind each step, and where a cell’s volume goes. The sections below give the evidence for the Whi5 ruler, for contents keeping pace, and for the two costs, the genome and the surface; the second film then follows the compartments that share the volume, how root cells add vacuolar volume, and a short reference to animal, plant and fungal parts.
The one idea to carry through this lesson. Many of a cell’s processes depend on concentrations: amount divided by volume. Growth raises the volume, so anything whose amount does not keep pace is diluted. In the leading model, budding yeast reads its size from one such dilution, of a brake called Whi5. Most other contents a growing cell must make in step with its volume. Two things can fall behind and set costs of being big: a single genome, which appears to serve only so much cytoplasm, and the surface, which grows more slowly than the volume when a cell keeps its shape.
A note on units: cell volumes are given in femtolitres (fL) or cubic micrometres (µm³), and the two are the same, 1 fL = 1 µm³.
Reading size: the brake that growth dilutes
The first film’s ruler needs a few terms, then its evidence. The budding-yeast cycle runs through G1 (growth before the DNA is copied), S (DNA synthesis), G2 and M (mitosis). Start, the first film’s green line, is the point in G1 where the cell commits to a full cycle of copying its DNA and dividing (the mammalian version, the restriction point, is in cell-cycle control). Whi5 is a protein that holds back the transcription factor (a gene-switching protein) that turns on the genes for Start; as Whi5’s concentration falls, the brake weakens. A rule under which cells divide at about the same size, whatever size they were born, is a sizer.
The first film’s red dots stand for a measurement. In 2015 Kurt Schmoller, Jan Skotheim and colleagues tagged Whi5 with a fluorescent protein and measured it in single living cells. Whi5 was made mostly in S, G2 and M, in an amount that hardly depended on the cell’s size. A small daughter therefore began G1 with about as many Whi5 molecules as a larger cell, at a higher concentration. That premise does all the work: if the dose at birth grew in proportion to birth size, every cell would start at the same concentration, and dilution would tell it nothing about its size.
Predict. A strain carries two copies of the WHI5 gene instead of one, so each newborn cell gets about twice the usual dose. Do these cells pass Start at their normal size, a smaller size, or a larger one? And what would deleting WHI5 do?
Check your prediction
Larger. In the idealized model, if the Whi5 dose stays fixed during G1 and Start occurs at the same Whi5 concentration, doubling the dose doubles the volume at that threshold. Experimentally, adding WHI5 copies made cells larger, though not by a guaranteed twofold amount. Cells lacking Whi5 pass Start small.
The first film used the simplest case, a hard line that every cell crosses at the same size; here is the fuller picture. The budding-yeast sizer is weak and noisy: cells pass Start over a range of sizes, though the chance rises as they grow, so a cell born small makes up only part of its shortfall in one G1. And how much of size control Whi5 dilution explains is still argued (Going deeper).
Fission yeast, a rod that grows at its ends, reads size another way, before mitosis. It divides only once it reaches a set size, so a cell born small grows more first, a cell born large grows less, and sizes at division come out similar. Its mutants that divide too early or too late are the size mutants in the design problem below.
Keeping pace: RNA and protein
The ruler works because Whi5 does not keep pace; nearly everything else has to. The rate of a reaction depends on the concentration of the molecules that carry it out, so a growing cell has to make more RNA and protein to keep their concentrations steady. In most cells it does: total RNA and protein rise roughly in step with volume, because larger cells transcribe and translate faster. The first film’s flat orange gauge showed concentration only: the total amount still grows with the cell, but the concentration carries no size signal.
What can fall behind: the genome
The first film’s first cost, the genome, ended on a question. Its swelling cells come from a 2019 study by Gabriel Neurohr, Angelika Amon and colleagues: held in G1, budding-yeast cells grew from about 65 fL to about 600 fL in six hours, and their cytoplasm was diluted.
Predict. After six hours these cells are both much bigger and much longer arrested. How could you tell whether the dilution comes from their size or from the time spent arrested?
Check your prediction
Hold some cells for the same time but let them grow less. The team did this by limiting glucose during the arrest, so these cells spent as long arrested but stayed smaller. If dilution comes from time, they should be diluted too; if from size, they should be spared. The comparison pointed to size: it was the enlarged cells that failed to scale up synthesis.
Why the genome? RNA is copied from DNA, so a cell with one genome copy has a fixed set of templates. At very large sizes the nuclear DNA itself appears to become limiting for transcription; if so, one genome can serve only so much cytoplasm. Cells that copy their genome without dividing, or carry extra genome sets, tend to be larger, which fits that idea. In enlarged human fibroblasts (connective-tissue cells) the same study could not measure protein and RNA directly, but found a sign of reduced crowding that fits dilution. Recent work suggests that excess size itself helps drive senescence, the permanent exit from division. A cell can be too big for its own synthesis machinery, not only for its membrane.
What falls behind: the surface
The first film’s second cost, now with numbers. For its sphere going from 5 to 10 µm in radius, A = 314.2 → 1256.6 µm² and V = 523.6 → 4188.8 µm³, so A/V = 3/r falls from 0.6 to 0.3 µm⁻¹. The surface still grows, only more slowly than the volume while the shape stays the same. A rate on each side, uptake J per unit of surface and use q per unit of volume, shows where that bites.
In words The largest radius is three times the uptake per unit of surface, divided by the use per unit of volume.
- rmax“r max”
- the radius at which supply just meets demandµm
- J“J”
- the most nutrient the membrane can take up, per unit area per secondmolecules µm⁻² s⁻¹
- q“q”
- the nutrient each unit of volume uses per second, evenly through the cellmolecules µm⁻³ s⁻¹
Sanity check Units: J/q leaves µm, a length, as a radius must be. The 3 comes from A/V = 3/r for a sphere.
Try one number
Invent two rates; they are made-up inputs, not measurements. Let J = 20 molecules µm⁻² s⁻¹ and q = 6 molecules µm⁻³ s⁻¹, with the whole surface taking up nutrient and nothing else limiting the cell. Then rmax = 3 × 20 / 6 = 10 µm.
The ratio of capacity to demand is (J/q) × (3/r) = 10/r. At 5 µm it is 2 (supply 6,283 molecules per second against demand of 3,142), and at 10 µm it is exactly 1. Change J, q or the shape and the answer changes.
Where it comes from optional
Supply meets demand when J × A ≥ q × V, with A = 4πr² and V = 4πr³/3. Divide both sides by J × V: A/V ≥ q/J. For a sphere A/V = 3/r, so 3/r ≥ q/J, which gives r ≤ 3J/q.
Need a refresher? rates and “per” · units and prefixes
Predict. Keep J = 20, but let the cell’s demand double to q = 12. Where is the new rmax, and what does a 10 µm cell now face? Then check with the sliders below.
Check your prediction
rmax halves, to 3 × 20 / 12 = 5 µm. A 10 µm cell now takes in only half of what it uses: the capacity-to-demand ratio is 5/r, which is 0.5 at 10 µm. Doubling demand moves rmax exactly as halving uptake would.
- rmax = 3J/q
- A/V = 3/r
- Area A = 4πr²
- Volume V = 4πr³/3
- Supply J × A
- Demand q × V
- Capacity to demand = (J/q) × (3/r)
In this sketch, a smooth sphere whose whole surface takes up nutrient and nothing else limits it, supply meets demand up to rmax = 3J/q. That is a scaling penalty, not a universal maximum. The rates are invented, not measurements; shape, vacuoles and biosynthetic scaling are left out.
So the sphere gives a cost that grows with size (the simulation calls it a scaling penalty), not a fixed largest size. The first film’s sphere was also the simplest shape. A flat or long thin cell keeps much more surface per volume than a sphere, and diffusion time grows with the square of distance, which also favours cells where no point is far from the surface. “Eukaryotic cells are 10 to 100 µm across” is a guide, not a bound: a 65 fL yeast cell has a sphere-equivalent diameter of about 5 µm. Geometry sets a cost on being big; the coupling of growth to division chooses the size.
So far the cell has been one bag of contents, but its volume is split among compartments, and the share each one takes can be measured.
The second film picks up here: what share of a cell each compartment takes, and how a plant cell grows by adding vacuole.
Read the transcript of “Where the Volume Goes”
Film transcript: Where the Volume Goes
A cell looks like one bag. But where does all its volume go? Chapter one followed amount over volume as a yeast cell grew. Now ask what share each compartment takes, and whether that share holds during growth. A membrane-bound compartment is a region enclosed by a membrane. The nucleus, which holds most of the DNA, is one.
Divide its volume by the cell's, and you get its share. Here is one carefully measured cell line: hamster V79, growing in a dish. The nucleus fills about 27% % of the cell. Mitochondria, another compartment, fill about 5%. Now a fission yeast, a rod that grows at its ends. Its nucleus is about 8%. percent. In this yeast, the nucleus grows with the cell, so its share holds as the cell grows. Two careful measurements, two very different answers. So which number is the nuclear share of a cell: 27%, % or 8%? Pause and decide.
Both, each for its own cell. There is no universal nuclear fraction. A share means something only with its cell type attached, so carry the cell type with every number. One question stays open. Does the nucleus follow the DNA inside it, or the cell around it? The design problem below lets you test it.
Plant cells change their shares as they grow. Take the outer layer of a root in Arabidopsis, a small lab plant. In young cells, the vacuole fills about 30 to 40%. percent. As the cells lengthen, vacuolar occupancy rises to about 80 to 90%. percent. Across the comparison, cell volume is about 14-fold greater. But space outside the vacuole is only about two- to threefold greater. Most of the added cell volume is vacuolar. The smaller rise outside it requires relatively little new RNA and protein. This can ease a biosynthetic cost of being big.
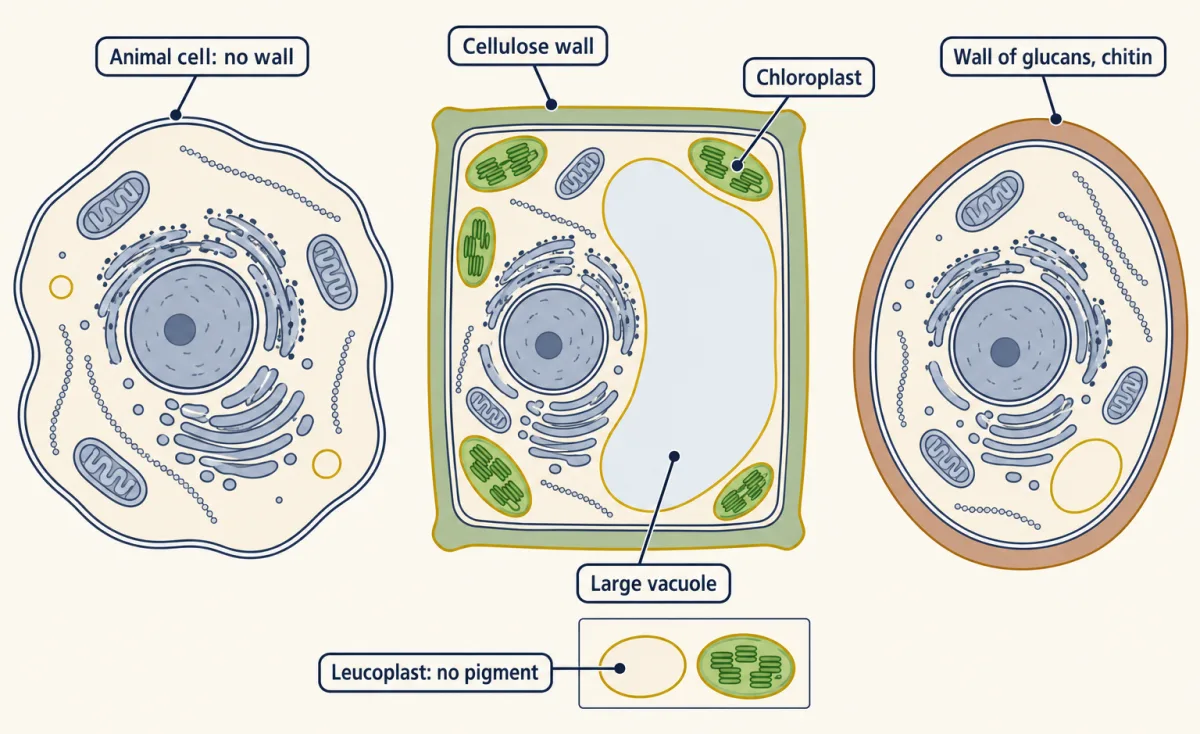
Which cells have which parts? Animal, plant and fungal cells share a plasma membrane, nucleus, mitochondria, ER, Golgi, and cytoskeleton. For these core parts, focus on three differences: walls, plastids, and vacuoles. A root cell deep in soil usually has plastids, but no chloroplasts. Fission yeast keeps its nuclear share as it grows.
Shares are cell-specific; elongating Arabidopsis root cells add mostly vacuolar volume.
From the film
- A membrane-bound compartment's share is its volume divided by the cell's, and it belongs to one cell type: the nucleus is about 27% of a cultured hamster V79 cell but about 8% of a fission-yeast cell.
- There is no universal nuclear fraction, so every measured share should carry its cell type.
- In fission yeast the nucleus grows with the cell, so its share holds as the cell gets bigger.
- As Arabidopsis root cells lengthen, vacuolar occupancy rises from about 30 to 40% of the cell to 80 to 90%, so most added cell volume is vacuolar, with comparatively little added cytosol.
- For the core parts compared here, animal, plant and fungal cells differ in walls, plastids and vacuoles; a root cell deep in soil usually has other plastids but no chloroplasts.
Where the volume goes: compartments and their shares
The first film’s purple block was DNA alone; the second film adds the nuclear envelope around it. The second film left one question open: does the nucleus follow its DNA or its cell? Many other organelles also scale in size or number with the cell, in ways that depend on the organelle and cell type, but the nucleus is where this was tested most cleanly.
Design problem
Does DNA content or cell size set the size of the nucleus? You work with fission yeast and have size mutants that divide at very different sizes, a way to raise DNA content without division (switching off Cdc13, the cyclin the cell needs to enter mitosis, so the genome is copied again and again), a fluorescent nuclear-envelope marker, and images that outline each cell. Design the experiment and say what each model predicts before you look.
Saved in this browser only.
One way to do it
First, measure nuclear and cell volume in each cell, across the widest size range you can get from the mutants. If cell size sets nuclear size, the nuclear-to-cell ratio stays constant as cells get bigger. If DNA alone sets it, nuclear volume stays roughly fixed in cells with the same DNA content, so the ratio falls as cells grow.
Second, change DNA content without changing the rule for cell size. Switch off Cdc13 so the genome is copied several times, and compare cells with 2C and with much higher DNA content (C is the DNA of one haploid genome). The DNA model predicts a relatively larger nucleus in the high-DNA cells; the cell-size model predicts the same ratio.
Controls: measure wild-type cells in the same conditions, use the same marker and thresholds for every strain, and measure enough cells per strain to see the spread.
Neumann and Nurse did this in 2007. The ratio stayed roughly constant, near 0.08, across a 35-fold range of average cell sizes, and a 16-fold difference in DNA content (2C against 32C) left relative nuclear size unchanged. In cells with several nuclei, a nucleus surrounded by more cytoplasm grew faster. The answer in fission yeast is cell size, probably through something in the cytoplasm.
Here are the two measured shares behind the second film, each with its cell type and method.
- Chinese hamster V79-S171 cells, log phase, in culture: mean volume 710 µm³, nucleus 190 µm³, total mitochondria 37.5 µm³, about 90 mitochondria per cell (an estimate from electron-microscope sections that depends on how a mitochondrion is counted; see Going deeper). In 1972 D. W. Ross and H. C. Mel took whole-cell volume from electronic cell sizing and apportioned it among nucleus, cytoplasm and mitochondria by electron microscopy.
- Wild-type fission yeast, growing: nuclear-to-cell volume ratio 0.080 ± 0.013, measured by Frank Neumann and Paul Nurse with a fluorescent nuclear-envelope marker.
Reading a volume table. From the V79 means:
nuclear fraction = 190 / 710 = 0.27; mitochondrial fraction = 37.5 / 710 = 0.053
So in fission yeast the nuclear share holds as the cell grows, while the hamster and yeast measurements show that shares differ between cell types. Carry the cell type with each number.
Treated as a sphere of the same volume, a V79 cell has r³ = 3 × 710 / (4π) = 169.5 µm³, so r = 5.5 µm and the diameter is about 11.1 µm. That is a calculation, not a measured diameter; cells spread on a dish are flatter. How these volumes are measured comes in microscopy and quantitative images.
Plants add volume mostly as vacuole, not cytoplasm
The second film showed the synthesis side in Arabidopsis root epidermis (the root’s outer cell layer). Vacuolar occupancy rose from about 30 to 40% in young cells to 80 to 90% after elongation. Across that comparison, cell volume was about 14-fold greater, but the space between vacuole and cell boundary was only about two- to threefold greater. The surface side is yours to work out.
Predict. Treat the growing cell as a sphere whose volume rises 14-fold. What happens to membrane area per unit of volume? And per unit of cytoplasm, if the cytoplasm grows only two- to threefold?
Check your prediction
A sphere’s area grows as its volume to the power two-thirds, so a 14-fold rise in volume gives 142/3 ≈ 5.8-fold more area. Per unit of volume, membrane therefore falls to 5.8 / 14 ≈ 0.4 of its starting value: the surface cost is still there. Per unit of cytoplasm it rises about two- to threefold (5.8 divided by 2 to 3). A real root cell elongates rather than swelling as a sphere, which keeps even more surface. For the cytoplasm, the vacuole turns the surface cost around.
The vacuole cannot do this alone. The cell wall has to loosen so the cell can stretch, and vacuole expansion and wall loosening must be coordinated. Which one leads, and exactly what the vacuole contributes, is still being worked out.
Same parts, different shares
This last section is a reference tool, not a new step: the shares above only mean something if you know which parts each kind of cell has.
A eukaryotic cell keeps most of its DNA inside a membrane-bounded nucleus; mitochondria, and plastids in plants, carry small genomes of their own. Its interior is divided into compartments, regions enclosed by a membrane. The space inside an organelle is its lumen; the fluid outside the organelles but inside the plasma membrane is the cytosol.
Animal, plant and fungal cells share a plasma membrane, a nucleus and a cytoskeleton, the network of protein filaments that shapes the cell and moves things within it. All three have an endoplasmic reticulum (ER) and Golgi apparatus, which sort and transport proteins headed for secretion, and mitochondria, which carry out oxidative phosphorylation. The bilayer that bounds all of these is covered in membrane structure and function, and the broad picture of the cell in the introduction to biochemistry and cell biology.
The differences are where students slip:
| Part | Animal cell | Plant cell | Fungal cell (yeast) |
|---|---|---|---|
| Wall | none | cellulose fibres in a matrix of hemicelluloses and pectin | β-glucans, chitin and mannoproteins (S. cerevisiae) |
| Plastids | none | chloroplasts in photosynthetic cells; in nonphotosynthetic tissues, leucoplasts without pigment or, in many fruits and flowers, pigmented chromoplasts | none |
| Vacuole | small or absent | often large, can fill most of the cell | acidic, with degradative and storage roles |
Chloroplasts carry out the light reactions, but only in cells that photosynthesize. A root cell deep in soil usually lacks chloroplasts, though it still contains other plastids. Their number is a measured share too: wild-type Arabidopsis leaf mesophyll (Wassilewskija) holds a mean of 83 chloroplasts per cell, a figure for one tissue of one plant. Yeasts are unicellular fungi, and budding yeast has the same core organelles as your cells, which is why it is so useful.
Going deeper
Sizers, adders and timers
A sizer can correct a size error within one cycle. An adder adds about the same volume each cycle whatever the birth size, so a size error shrinks only over several generations. A timer keeps cycle time constant; on its own it cannot correct size in cells that grow exponentially, though it can hold the sizes a sizer has set. Budding yeast shows a weak sizer in G1 and a timer for the rest of the cycle, so its whole cycle behaves roughly like an adder; fission yeast behaves as a sizer overall. Many cultured mammalian cell lines behave close to adders; one proposal, not settled, is that cancer mutations disrupt their G1/S control. Whi5 works much like the mammalian brake Rb, and plants use dilution too: in Arabidopsis the inhibitor KRP4 is diluted with growth.
Debates over what is measured
Whi5 dilution is the leading model, not a closed case: later measurements disagree about how far Whi5 concentration falls during G1 and how much of size control it explains (for example, Litsios and colleagues in 2019 and Barber, Amir and Murray in 2020, with follow-ups from the Schmoller and Skotheim groups). Fission yeast reads several inputs at once. One is the activator Cdc25, whose concentration rises as the cell grows, the mirror image of Whi5. Whether it measures its length, surface area or volume is debated; a sensor at the cell cortex built around the protein Cdr2 has been proposed to read surface area.
Growth rate feeds in too. In bacteria and yeasts, cells that grow faster, in richer media, are larger; a similar trend is reported in mammalian cells, but it is weaker and depends on how growth is changed.
The enlarged-yeast experiment
The arrest used a temperature-sensitive cdc28-13 allele. In primary human fibroblasts (IMR90) enlarged by senescence induction, the evidence was faster diffusion of tracer nanoparticles, the indirect sign of reduced crowding mentioned above.
Counting organelles
The count of about 90 mitochondria per V79 cell depends on the counting rule, since mammalian mitochondria can also join into branched networks. In budding yeast, image analysis shows that mitochondria can form one interconnected network or many separate tubules, so the count depends on the rule: counting each connected structure as one object makes a single network one mitochondrion. This lesson gives no census of organelle numbers across animals, plants and fungi.
Model organisms and the limits of transfer
This lesson’s numbers come from two yeasts, a hamster line and Arabidopsis; each model answers some questions and not others.
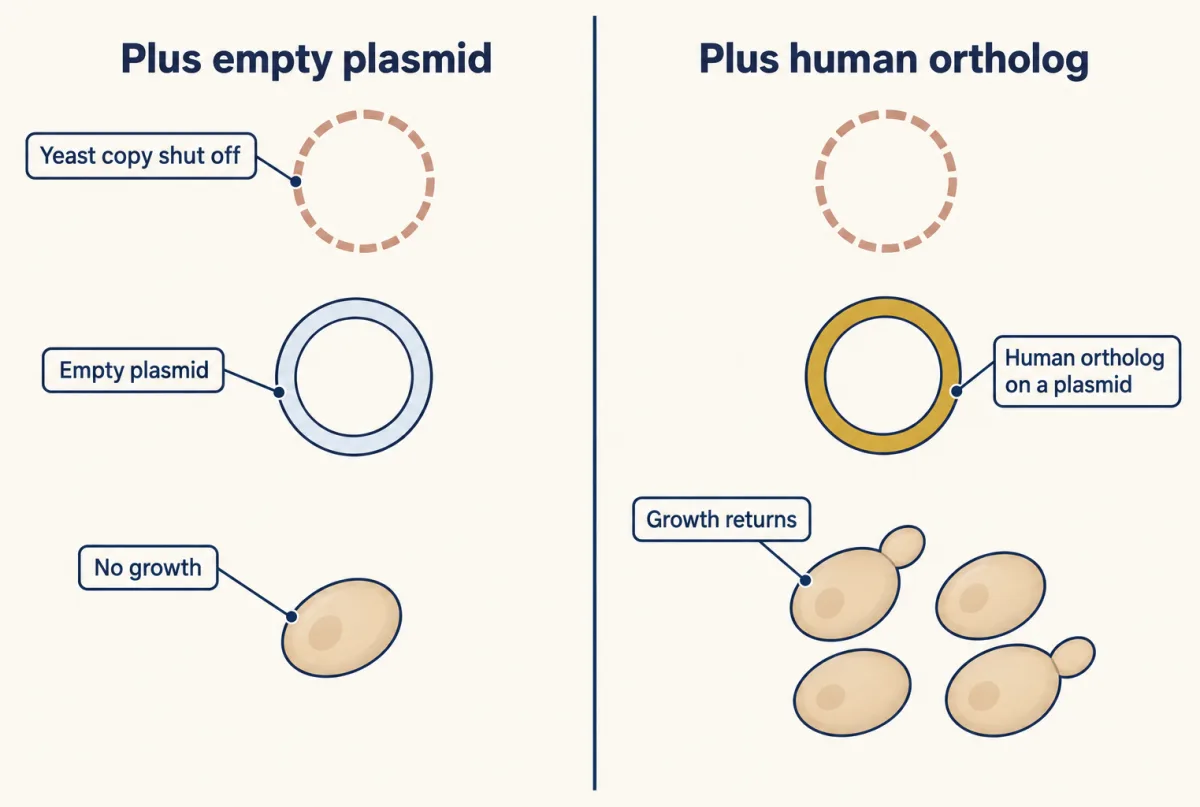
Budding yeast (Saccharomyces cerevisiae) is fast and easy to manipulate genetically (CRISPR and functional genomics). In 2015 Aashiq Kachroo, Edward Marcotte and colleagues tested human orthologs (the matching human genes) in place of 414 essential yeast genes, and 176 (43%) restored growth in their own assays; adding earlier published cases brought the rate to 47%. That shows a conserved function in those genes. It does not show that the rest are unconserved, since failure can have several causes, and growth rescue says nothing about tissue roles.
Fission yeast (Schizosaccharomyces pombe) grows at its ends, which makes size easy to measure.
Cultured mammalian lines give precise numbers, like the V79 volumes, but a line is not an animal, and a line’s name is not a guarantee. Uri Ben-David and colleagues characterized 27 strains of the breast cancer line MCF7 in 2018 and found rapid genetic diversification: at least 75% of the compounds that strongly inhibited some strains were completely inactive in others. Report the strain and conditions.
Flies (Drosophila): a 2000 survey by Fortini and colleagues found apparent fly counterparts for 178 of 287 human disease genes, and a larger 2001 search by Reiter and colleagues matched 714 of 929 (77%). Conservation is gene by gene: no fly counterpart of α-synuclein was found, yet flies made to express human α-synuclein are used to model Parkinson’s disease.
Worms (C. elegans) are transparent and mostly self-fertilizing, so cells can be watched in a living animal and a mutation breeds true without a mate. Sydney Brenner’s 1974 paper linked about 300 EMS-induced mutants to about 100 genes, from visible defect to mapped gene. Human effects need more evidence.
Plants (Arabidopsis): the arc6 mutant, with one to three chloroplasts per mesophyll cell against 83 in wild type, and the root vacuole measurements show control of chloroplast number and vacuole size that animal cells do not offer. Leaf and root data are not interchangeable.
Your notes
Select any text in the lesson to highlight it or add a note to it. Your highlights and notes are saved in this browser and collected in your notebook.
This browser is not letting the site save anything (a private window or strict privacy settings), so highlights and notes will be lost when you leave the page.
How we measure it
Electron-microscope stereology
Thin sections of fixed cells are photographed in the electron microscope, and the area each compartment covers in many random sections is measured. Area fractions in sections estimate volume fractions in the whole cell, the kind of measurement used to apportion the volume of V79 hamster cells among nucleus and mitochondria.
Fluorescent envelope marker with Nomarski optics
A fluorescent protein fused to a nuclear-envelope protein outlines the nucleus, while Nomarski (differential interference contrast) imaging outlines the unstained cell. Measuring both in the same cell gives the nuclear-to-cell volume ratio, as in fission yeast with Cut11-GFP.
Electronic cell sizing (Coulter counter)
Cells in salt solution pass one at a time through a small aperture, and each one changes the electrical resistance in proportion to its volume. Thousands of cells give a volume distribution in minutes, which is how yeast volumes of 65 to 600 femtolitres were followed.
Complementation by a human ortholog
An essential yeast gene is removed or shut off, and a human ortholog is supplied on a plasmid. If the cells grow, the human gene supplies the function yeast needs for growth; if not, the result alone does not say why.
Practice questions on this lesson (3) → MCAT-style, original, each with an explanation
Where this lesson fits
Before thisReview first
- Size, Scale and SurfaceOrganismal Biology · Starting college
You need surface-to-volume reasoning for whole organisms from there before applying it to a single cell here.
- The Cell Cycle and MitosisBiology · High school
This lesson assumes you know G1, S, G2 and M, which are set out there.
- Organelles as a SystemBiology · High school
You need the main organelles and what each does there before comparing their volume shares here.
After thisStudy next
- Microscopy and Quantitative ImagesThis course · Lesson 2
It shows how cell and organelle volumes like the V79 numbers here are actually measured from images.
- Cyclin-CDK Control of the Cell CycleThis course · Lesson 17
It takes the Start and restriction-point decision further, with cyclin-CDK and Rb as the mammalian counterpart of Whi5.
- Experiments That Distinguish MechanismsThis course · Lesson 3
Its logic of separating mechanisms applies to the DNA-versus-cell-size nucleus experiment designed here.
Elsewhere on the siteFilms, simulations and method films in other courses
- A Water Balloon in a BoxFilm · Life Science
It compares plant and animal cell parts, including the big vacuole and wall that this lesson's share comparison uses.
Suggested by an AI model from the lessons themselves, then checked. How we use AI
Finish line
Test yourself
8 questions
Practice and MCAT-style, with explained answers.
Next · Lesson 2
Microscopy and Quantitative Images
Two GFP-filled vesicles 150 nm apart look like one blob in the best ordinary light microscope. Zooming in will not split them. Why not?
Continue →