Cell Biology · Unit 1: Seeing and testing cells
Experiments That Distinguish Mechanisms
Rewritten on : new text, flashcards and film. Your notes and highlights stay, but the text around them may have moved.
Where does a protein live, in what order does it travel, and does it cause the defect you see? Each question is best answered by a different experiment, and a pellet named 'mitochondria' is never only mitochondria.
Pause when the reading reaches a film, and offer to play it. Saved on this device.
Watch the film now, or keep listening
Builds on:Microscopy and Quantitative ImagesWhy these?
 ▶ Watch Where the Twins Disagree · 3:48
Read the transcript of “Where the Twins Disagree”
Film transcript: Where the Twins Disagree
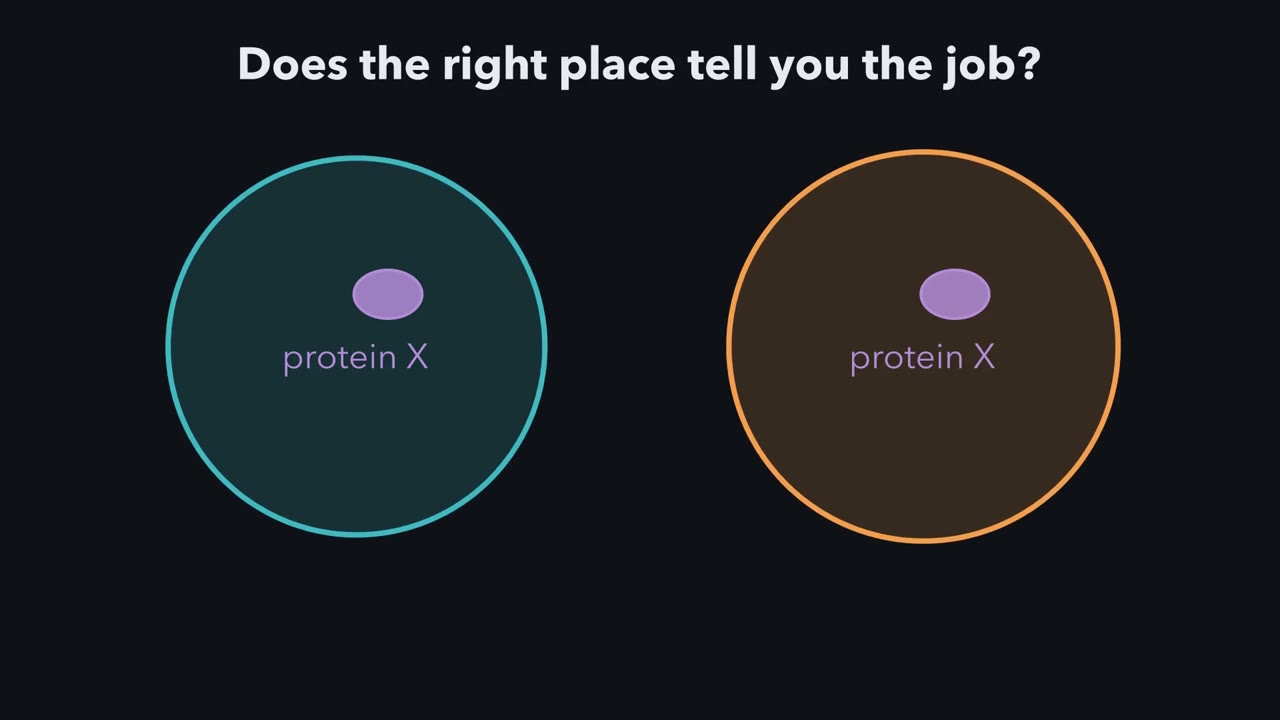
This protein sits in the right place, at the right time. Does that tell you what it does? Here are two possible answers, each true in its own cell. Call the cells twins: identical, except each has a different model built in. Every experiment runs on both at once. Here is the rule: a result can choose only where the twins disagree. First question: where does the protein live?
Model one, in the teal twin: in lysosomes. Model two, in the orange twin: in mitochondria. Break both cells open and spin the pieces, at rising speeds, into five tubes. Test one. Is the protein enriched in tube L, more concentrated than in the starting mix? In the teal twin, yes. In the orange twin, also yes: tube L holds plenty of mitochondria. This test cannot choose. Test two reads all five tubes. Each bar is the protein's share in one tube. Two faint tracks show where the lysosome marker and the mitochondrial marker went. If the protein is lysosomal, which track should it trace?
Here the twins disagree. In the lesson's made-up data, the protein follows the lysosome track across all five tubes. A whole profile is stronger evidence than one peak, though still not proof. Tube L leans toward lysosomes, but leaning is not purity. So what is tube L mostly made of? Hold that question. Second question: in what order does a protein visit the compartments? Tag one batch and watch. In the teal twin, carriers ferry it between fixed Golgi compartments. In the orange twin, each Golgi compartment itself matures. In both twins, the gold label lights the E R, then the Golgi, then the granules. The order alone cannot choose. Other tests can.
Third question: does the protein cause what you see? A drug stops these cancer cells growing. It was built to block one kinase, an enzyme that adds phosphate to proteins. The curve shows growth falling as the dose rises. Now take the kinase out of both twins. The cells still grow. Give the drug again. In this two-model cartoon, a drug acting only through that kinase shifts the curve right, to higher doses. One acting only through another target leaves it put. Mixed effects fall between. The measured curve barely moves.
Cells without that kinase are stopped by about the same dose. So in these assays, the drug acts mainly through other targets. Now silence the protein's message, its m R N A, with R N A interference, and the job fails. But other messages may be silenced too. So put the protein back, in a form the interference cannot touch. How can it be the same protein, yet escape? So: where does it live, in what order does it travel, does it cause the defect? Before any result, ask what each model predicts. Agreeing twins cannot choose.
From the film
- A result can choose between two models only where the twins disagree.
- In the lesson's made-up table, enrichment in tube L cannot choose, because both models predict it; matching a marker across all five tubes is stronger evidence, though not proof.
- Tagging one batch of protein (a pulse-chase) gives the order, ER then Golgi then granules; carriers and maturing Golgi compartments predict the same order, so the order alone cannot choose.
- In these cancer-cell assays, removing MELK barely moved the drug's growth curve, so its effect there mostly runs through other targets.
- RNAi can silence other messages too, so rescue with an RNAi-resistant copy is strong evidence the intended protein caused the effect.
In 1955 a group in Louvain proposed a new organelle, the lysosome, from numbers in a table of centrifuge fractions, before anyone could say what it looked like.
They broke rat liver, spun it into five fractions, and measured enzymes in every one. Acid phosphatase did not quite travel with the mitochondria: it peaked in a lighter fraction. The first film showed the logic; the text adds the arithmetic, the controls and the cases it skips.
The first film’s rule, with one addition. The predictions must also differ by more than the result’s own noise. So before you read a result, write down what each model predicts. If the predictions are the same, the result cannot choose between the models, however clean the data.
Each method below is best at one kind of question and is easily pushed to answer one it cannot. The rule says whether a test can decide, not that your two models are the only ones; the strongest designs make them predict opposite results.
Where: breaking the cell carefully
First the tissue is broken gently in a sucrose solution, so that the plasma membrane tears but organelles stay mostly whole; this suspension is the homogenate. Then comes differential centrifugation: spin at low force and the largest, densest particles (nuclei, unbroken cells) form a pellet, a packed sediment at the bottom of the tube. Spin the liquid above at higher force and smaller particles pellet, and so on. In de Duve’s rat-liver scheme this gives five fractions: N (nuclear), M (heavy mitochondrial), L (light mitochondrial), P (microsomal: microsomes are small sealed fragments of membrane) and S (soluble, mostly the cytosol). The names come from the spin, not the contents: the “light mitochondrial” fraction is where de Duve found lysosomes, so a fraction’s name is itself a model. (Sizes: a measured eukaryotic cell; centrifugation: purification.)
Differential spins separate by size and density together, and particle populations overlap, so every pellet is a mixture. Density-gradient centrifugation refines a fraction: in a tube whose sucrose concentration rises toward the bottom, each particle settles, given long enough, where the solution matches its own buoyant density, whatever its size.
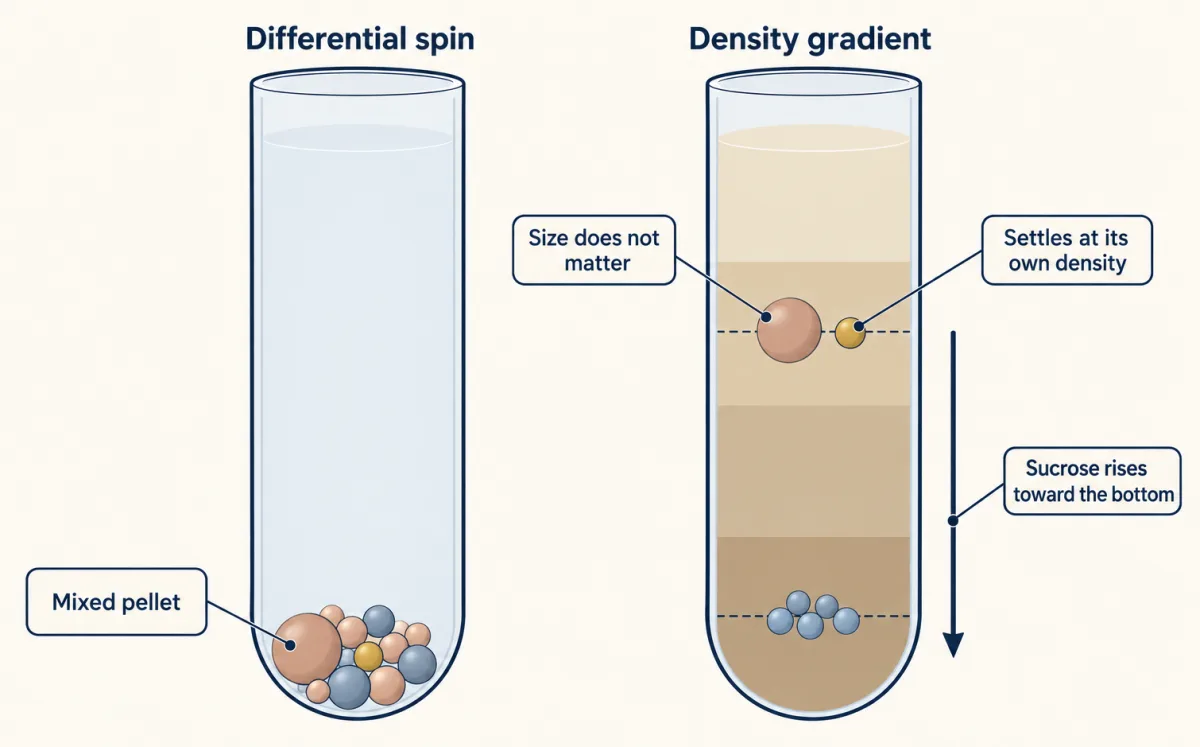
To tell which particles went where, you measure a marker enzyme, one assumed to belong to a single compartment. In rat liver the standard markers are cytochrome oxidase for mitochondria, acid phosphatase for lysosomes, and glucose-6-phosphatase for the endoplasmic reticulum (ER), where most secreted and many membrane proteins are made.
Reading a fractionation table
Three quantities do most of the work. The first compares a fraction’s share of an enzyme with its share of the protein: hold 45% of the enzyme in 5% of the protein, and the enzyme is nine times more concentrated there than in the homogenate.
relative specific activity = (% of total enzyme activity in the fraction) / (% of total protein in the fraction)
Both numbers are percentages, so the ratio has no units; it is not the specific activity of biochemistry (units per mg). A value above 1 means the fraction is enriched. Recovery in a fraction is the percent of the homogenate’s activity found there; summed over all fractions, it checks that none was lost or gained. Latency is activity that cannot be measured until a membrane is opened, usually with detergent, because the substrate cannot reach an enzyme sealed inside a compartment.
Worked problem: lysosome or mitochondrion?
Here is a made-up rat-liver data set; the first film’s tracks were computed from it. Each row gives the percent of the homogenate’s total found in each fraction, and every row adds to 100. Model 1: the unknown enzyme X is lysosomal. Model 2: X is mitochondrial.
| N | M | L | P | S | |
|---|---|---|---|---|---|
| Protein | 15 | 20 | 5 | 20 | 40 |
| Cytochrome oxidase | 10 | 70 | 15 | 5 | 0 |
| Acid phosphatase | 8 | 25 | 45 | 12 | 10 |
| Glucose-6-phosphatase | 10 | 10 | 10 | 65 | 5 |
| Unknown enzyme X | 9 | 24 | 44 | 13 | 10 |
Step 1: relative specific activity. Divide each activity by the protein in the same column.
- Cytochrome oxidase: M is 70/20 = 3.5 and L is 15/5 = 3.0. It peaks in M but is enriched in L as well.
- Acid phosphatase: L is 45/5 = 9.0 and M is 25/20 = 1.25. It peaks in L.
- Glucose-6-phosphatase: P is 65/20 = 3.25. It peaks in P.
- Enzyme X: L is 44/5 = 8.8 and M is 24/20 = 1.2. Its whole profile, fraction by fraction, is close to acid phosphatase’s and far from cytochrome oxidase’s.
Step 2: enrichment, recovery and purity. Fraction L holds 45% of the acid phosphatase in 5% of the protein: a 9-fold enrichment with 45% recovery. More than half is elsewhere, so a pure lysosome preparation would be a low-yield one. But L also holds 15% of the cytochrome oxidase, a 3-fold enrichment for mitochondria.
Predict. Is L at least mostly lysosomes, 9-fold against 3-fold? What else would you need to know?
Check your prediction
Enrichment alone cannot say: you also need each organelle’s share of the homogenate’s protein, which the table does not give. Suppose lysosomes hold 2% of it and mitochondria 18% (invented values that the table allows), and that each marker is confined to its organelle, fully measured and equally active per mg of that organelle’s protein. Then L is about 9 × 2% = 18% lysosomal protein and 3 × 18% = 54% mitochondrial protein: on these assumptions the fraction most enriched in lysosomes is mostly mitochondria. Enrichment says which way a fraction leans, not what it is made of.
Lesson’s supposed example: share of X’s activity that can be measured in L
RSA = relative specific activity. Where each enzyme peaks (highest RSA)
Rule to keep: relative specific activity = % of the enzyme’s activity in the fraction ÷ % of the protein in the fraction. A fraction rich in one marker can still carry another, so read several markers together. The numbers are the lesson’s made-up teaching data.
Step 3: latency. Latency answers a different question: inside or outside? Suppose that in intact L particles only 10% of X’s activity can be measured, and detergent raises it to 100%. X is 90% latent, so it sits behind a membrane, inside a particle, rather than stuck to the outside. It cannot say which particle: a mitochondrial matrix enzyme can also look latent when its substrate cannot cross intact membranes.
Conclusion. X is provisionally lysosomal. A whole-profile match is stronger evidence than a shared peak, but two organelles can happen to sediment together, so to confirm it you would want a second lysosomal marker that tracks X on a density gradient, and imaging in intact cells (microscopy).
When: pulse and chase
A fractionation table is a snapshot; to learn the order of compartments, label one batch of protein and follow it. This is a pulse-chase: give cells radioactive amino acid for a short time (the pulse), then flood them with the unlabelled amino acid (the chase), so only proteins made during the pulse are labelled.
The first film’s order came from this experiment. In 1967 James Jamieson and George Palade did it with slices of guinea pig pancreas, whose acinar cells make large amounts of digestive enzymes for export. After a three-minute pulse of carbon-14 leucine, label was in the rough microsomes, the ribosome-studded endoplasmic reticulum (ER) fragments. Smooth microsomes, which these experiments identified as peripheral elements of the Golgi complex, held it next, and later it reached the zymogen-granule fraction, the storage granules that release enzyme from the cell (times in Going deeper).
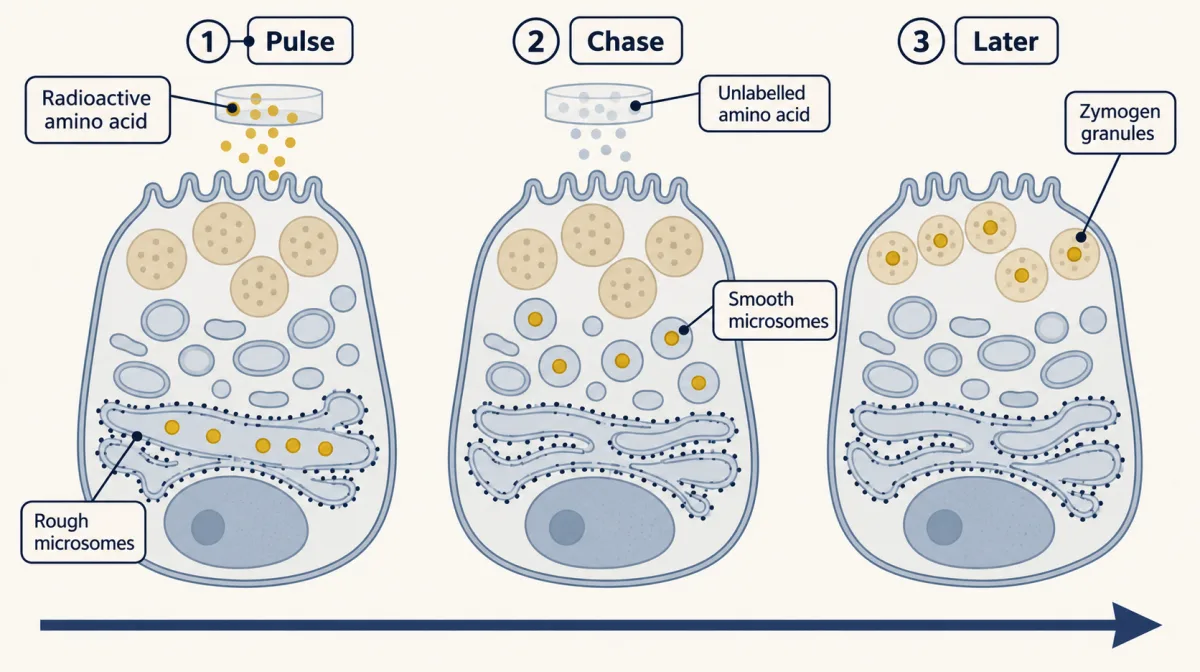
As the first film showed, the order alone cannot choose between carriers and Golgi compartments that themselves mature, cis to trans; the shape of the time course can, in principle (Going deeper). Other models do disagree.
Predict. Is a batch of new protein pushed along by the protein made after it? Model 1: yes, like a queue. Model 2: no, it moves on its own. If you block protein synthesis during the chase, what does each model predict?
Check your prediction
Model 1: transport stalls. Model 2: transport goes on. In 1968 Jamieson and Palade added cycloheximide, a drug that blocks protein synthesis, during the chase. Synthesis fell sharply, yet transport continued at a large fraction of the control efficiency. Newly made protein is not pushed along by protein made after it, at least over that chase and in that tissue: a pulse-chase answering a question about cause.
A pellet’s name is a model too. The granule fraction picked up label early, but electron-microscope autoradiography, which shows where radioactive label sits in a thin section, put that early label largely in condensing vacuoles of the Golgi complex, the large forerunners of granules, which sediment with granules. Labelled mature granules appeared much later in intact cells. A labelled pellet dates the label’s arrival in the pellet, not in the organelle it is named for (more in the secretory pathway).
Cause: remove it, then put it back
Being in the right place at the right time fits a protein that does the job and one that only happens to be there. To choose, take it away and see whether the job fails, then put it back.
A direct small-molecule inhibitor can block a protein within minutes, often faster than RNAi or gene editing, though phenotype timing varies. RNA interference uses a short RNA, delivered as an siRNA or made inside the cell as an shRNA, to guide destruction of a matching mRNA over a few days. CRISPR uses the nuclease Cas9 and a guide RNA to cut the gene; the cell’s error-prone repair of the cut usually breaks it, but some edits keep the reading frame or leave partial protein, so loss of the protein must be checked. (Tools: CRISPR and functional genomics, recombinant DNA, drugs against a part.) Each can mislead, and each has a control that makes the models disagree again.
A drug can hit more than its target. The first film’s drug is OTS167, developed as an inhibitor of the kinase MELK; Ann Lin, Jason Sheltzer and colleagues ran its test in 2017. In their MELK-null breast cancer clones, made by CRISPR, in Cal51 populations the mean GI50, the concentration that halves growth, was 10 nM with control guides and 11 nM with MELK guides. Whether these cells need MELK at all depends on the assay and is still debated (see the anecdote “A drug that did not need its target”). This genotype-by-drug comparison is a chemical-genetic test of target dependence, not a rescue: if the drug effect persists without the target, the target is not required for it; resistance supports the target if the cells are viable and controls hold. A functional drug-resistant target allele is the rescue-like test.
Predict. Suppose you give cells a version of MELK that OTS167 cannot bind. What does each model predict?
Check your prediction
If the drug works through MELK, cells with an active, normally expressed drug-proof MELK should keep growing in it; if through something else, growth still falls. Growth would support MELK as a target that matters, not the only one; a fall means little until the drug-proof MELK is shown to be active.
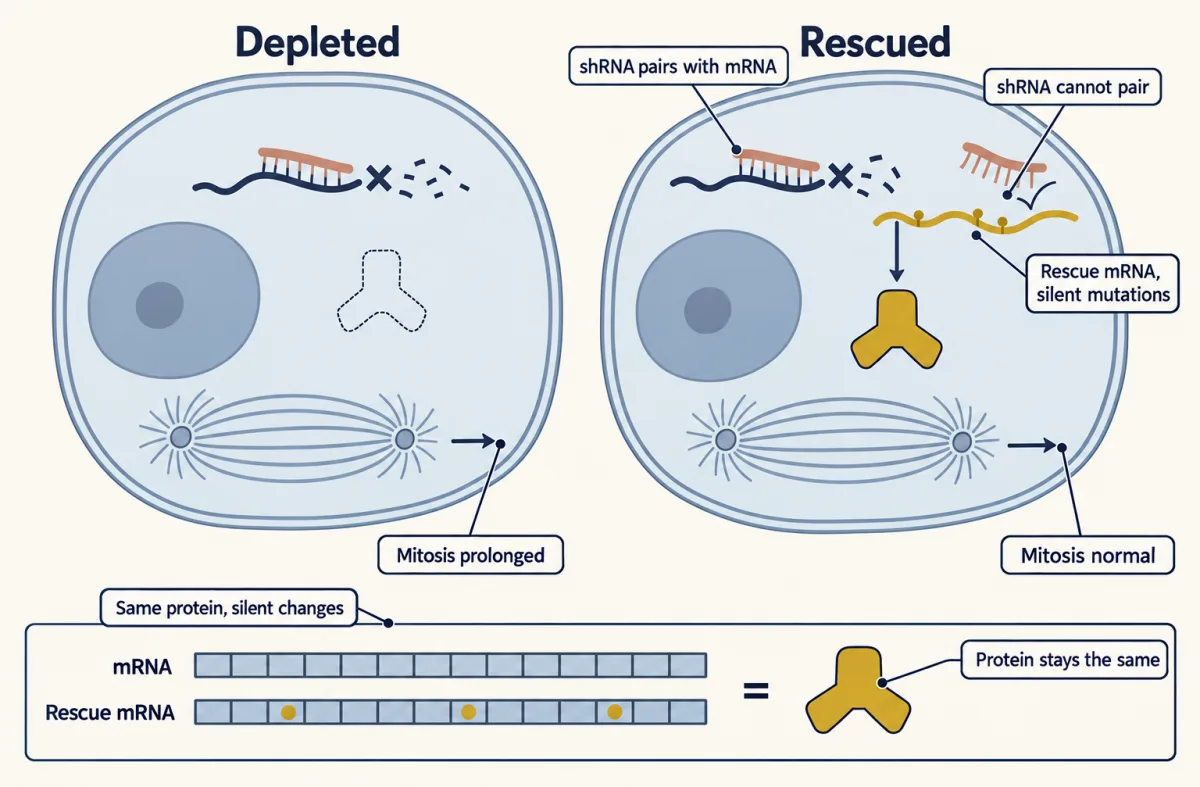
RNAi can silence the wrong mRNA. A short stretch of the guide strand can pair with, and silence, mRNAs it was never meant for (Going deeper). One control is a second shRNA against another part of the same mRNA, since a shared off-target is unlikely. The stronger one is rescue: put back a copy whose mRNA the shRNA cannot touch. If the phenotype came from losing the protein, rescue should cure it; if from an off-target, it should stay. A rescue that fails means little until the construct is shown to be made at about the normal level, folded and correctly placed.
Predict. How can a rescue construct make the same protein and still escape an shRNA that pairs with that protein’s mRNA?
Check your prediction
Change the codons in the shRNA’s target site to synonymous ones, codons for the same amino acid. These silent mutations alter the mRNA, so the shRNA no longer pairs with it, but leave the amino-acid sequence the same. Check by immunoblot (an antibody test for the protein) that the rescue protein is made at about the normal level, since far too much can cause effects of its own.
A knockout can be quietly compensated. In selected zebrafish and mouse models, decay of a mutant mRNA switched on related genes (Going deeper), so a mild knockout phenotype does not prove the gene unimportant.
The second film picks up here: a rescue that works is strong evidence that the defect came from losing the protein, but not which of its jobs mattered.
Read the transcript of “Two Jobs, One Protein”
Film transcript: Two Jobs, One Protein
One protein has two jobs. Which job did the cell miss when losing it slowed division? Chapter one's rule can help: a result chooses only where the twins disagree. Its last test put the protein back, and division recovered.
The protein is clathrin. One protein can do more than one task in a cell. Clathrin's best-known job is endocytosis. Clathrin coats small pockets of the cell's surface membrane, which pinch inward and carry material into the cell. In 2005, Stephen Royle and colleagues silenced clathrin in human cells in a dish. Mitosis, the division of one cell into two, took longer. So clathrin matters for division. But how? Here are the twins again. In the teal twin, clathrin works in mitosis itself. In the orange twin, it helps only through endocytosis, and division suffers indirectly. Interference works over a few days, so an indirect route would have time to build.
Now the rescue from chapter one. Silence clathrin in both twins, then put back the whole protein, in a form the interference cannot touch. If mitosis returns to normal, does that choose between the twins? It cannot. The whole protein brings back both jobs, so both twins predict rescue. And in the experiment, full-length clathrin did rescue mitosis. That strongly ties the defect to clathrin loss. Which job, rescue cannot say. They also put back only the front part of clathrin. It did not rescue. But a failed rescue is hard to read. The piece might be made at the wrong level, fold badly, or sit in the wrong place. To make the twins disagree, change the protein itself.
Build a resistant copy that keeps one job and loses the other. This is a separation-of-function mutant. First show that one job still works and the other does not. Then check its amount, folding and location. Royle and Leon Lagnado built such a copy the next year. What does each twin predict for it? That is a question for you in the text below. Work it out before you read on. So rescue answers one question: did losing the protein cause the defect? To ask which job, use a copy that keeps one and loses the other. Before you test it, write down what each twin predicts.
Rescue supports the protein's role; split its jobs to learn which.
From the film
- A rescue with a resistant copy strongly supports that the defect came from losing the protein, not which of its jobs mattered.
- Royle and colleagues found in 2005 that silencing clathrin in human cells made mitosis take longer.
- Full-length resistant clathrin rescued mitosis, as both models predict, so that rescue cannot choose between them.
- A failed rescue means little until the construct is shown to be made at about the normal level, folded and correctly placed.
- A separation-of-function mutant keeps one job and loses the other, so the two models can predict different results.
Two jobs, one protein: separation of function
The chapter’s experiment, in detail: in 2005 Stephen Royle, Nicholas Bright and Leon Lagnado depleted clathrin heavy chain in HEK293 cells, and the front part that failed to rescue was the N-terminal fragment. Since clathrin also coats endocytic vesicles, it might act in mitosis itself (Model 1) or through endocytosis (Model 2).
Predict. What does each model predict for a resistant clathrin construct that cannot support endocytosis?
Check your prediction
Model 1: it can still rescue mitosis. Model 2: it cannot, because the route that matters is still broken. In 2006 Royle and Lagnado reported that a shortened construct partly rescued mitosis while failing to support transferrin uptake, the standard readout of clathrin-mediated endocytosis. Keeping part of one job while losing the other argues that the jobs are separate.
A separation-of-function mutant like this is the sharpest test of whether two jobs are separate.
Design problem
Depleting protein C by shRNA prolongs mitosis in cultured human cells. Model 1: C acts directly on the spindle. Model 2: the defect is indirect, through C’s role in endocytosis. Design experiments that tell the two models apart.
Saved in this browser only.
One way to do it
1. Make the phenotype trustworthy. Use a non-targeting control shRNA and a second shRNA against another region of C’s mRNA; if both prolong mitosis, an off-target effect is unlikely. Confirm loss of C by immunoblot.
2. Rescue. Express full-length C, at about the normal level, from a construct with silent mutations in the shRNA target site, alongside an empty-vector control. Mitosis should return to normal.
3. Make the models disagree. Score every condition for two things: time in mitosis (by live imaging) and endocytosis (transferrin uptake). Then express shRNA-resistant mutants of C, each keeping one activity and losing the other, such as one that cannot bind the endocytic adaptors (proteins linking the coat to the membrane) and one that cannot reach the spindle. Model 1 predicts that a mutant failing at endocytosis can still rescue mitosis. Model 2 predicts rescue only by versions that restore endocytosis, and that blocking endocytosis another way, without touching C, also prolongs mitosis. RNAi phenotypes are usually scored after a day or more, so indirect effects have time to build. To ask whether C is needed acutely in mitosis, rapid removal at mitotic entry is a sharper complementary test; earlier direct roles need separate tests.
Do not decide on localization: seeing C on the spindle fits Model 1 but does not exclude Model 2, and a fragment can reach the spindle and still fail to rescue.
Going deeper
Fractionation fine print
De Duve’s modified scheme added the light mitochondrial fraction, L, to the older four-fraction one. Summed over all fractions, his group’s recoveries usually came to between 90 and 110%.
The pulse-chase numbers
Times are minutes of chase, from the end of the three-minute pulse. In the Jamieson and Palade pancreas experiments, smooth microsomes peaked at 7 minutes. The isolated zymogen-granule fraction was half-maximally labelled at 17 minutes, mostly in condensing vacuoles; in intact cells, labelled mature granules appeared at the earliest at 57 minutes. In the 1968 experiment, cycloheximide was added at 0.5 mM during a 37-minute chase: synthesis fell by up to 98%, yet transport continued with about 80% of the control efficiency.
Order versus shape
Take a toy model with an instantaneous, synchronous pulse: every labelled molecule enters the endoplasmic reticulum (ER) at time zero and spends exactly 10 minutes there and exactly 15 in the Golgi. No label reaches the granules before 25 minutes, and then all of it arrives together; a finite pulse would broaden that step. If each molecule instead leaves each compartment with a steady chance per minute, with the same average stays, some label arrives within minutes and the rise is smooth: same order, different shapes, so measured kinetics can test such models.
RNAi off-targets and compensation in detail
In HeLa-cell profiling, unintended targets were enriched for 3′ untranslated regions matching positions 2 to 7 of the guide strand. In the compensation studies, alleles that made no mutant mRNA at all lacked the response (El-Brolosy and colleagues, 2019).
Your notes
Select any text in the lesson to highlight it or add a note to it. Your highlights and notes are saved in this browser and collected in your notebook.
This browser is not letting the site save anything (a private window or strict privacy settings), so highlights and notes will be lost when you leave the page.
How we measure it
Differential and density-gradient centrifugation with marker enzymes
A gently broken tissue is spun at rising force to collect pellets that differ in size and density, and a fraction can be refined on a gradient where particles settle at their own buoyant density. Measuring protein and several marker enzymes in every fraction shows which fractions are enriched in which organelle, and how impure each one is.
Pulse-chase labelling with autoradiography
Cells get a short pulse of radioactive amino acid, then an excess of unlabelled amino acid, so only proteins made during the pulse carry label. Samples taken at later times, fractionated or imaged by autoradiography, show where that cohort of protein is at each moment.
Knockdown or knockout with rescue
A protein is depleted with RNAi or its gene is disrupted with CRISPR, and a phenotype is scored. Putting back a version the knockdown cannot touch, such as a construct with silent mutations, tests whether the phenotype came from losing that protein; mutant versions test which of its activities is needed.
Genotype-by-drug comparison
The same drug is given, at a range of doses, to cells with and without its supposed target. If cells lacking the target respond just as well, the drug can act through something else.
Method films · the methods library
Practice questions on this lesson (3) → MCAT-style, original, each with an explanation
Where this lesson fits
Before thisReview first
- Microscopy and Quantitative ImagesThis course · Lesson 2
You need its reading of images to follow the autoradiography and the imaging used to confirm where an enzyme sits.
After thisStudy next
- Protein Sorting into CompartmentsThis course · Lesson 7
It uses protection and pulse-chase style evidence to show which compartment a protein reaches and when.
- The Secretory PathwayThis course · Lesson 12
It takes the pulse-chase order of ER, Golgi and granules further and tests carrier against maturation models.
Elsewhere on the siteFilms, simulations and method films in other courses
- Fluctuation test: induced or already there?Simulation · Genetics and Molecular Biology
This fluctuation test is another experiment designed so two models predict different results.
- When Two Mutants Rescue Each OtherFilm · Genetics and Molecular Biology
It shows a test built to separate two explanations of the same mutant phenotype.
- What the Halfway Band MeansFilm · Genetics and Molecular Biology
The density-label experiment is a classic design where competing models predict different outcomes.
Suggested by an AI model from the lessons themselves, then checked. How we use AI
Finish line
Test yourself
8 questions
Practice and MCAT-style, with explained answers.
Next · Lesson 4
Membrane Organization and Topology
A membrane has two faces that differ in their lipids and in the parts of each protein they carry. Who builds that difference, and why does vesicle traffic never flip it?
Continue →