Biochemistry · Techniques in Protein Biochemistry
Techniques in Protein Biochemistry: Purify It, Then Prove It
Rewritten on : new text, figures and flashcards. Your notes and highlights stay, but the text around them may have moved.
Pull one protein out of a soup of ten thousand others — then prove you got it.
Pause when the reading reaches a film, and offer to play it. Saved on this device.
Watch the film now, or keep listening
Builds on:Amino Acids: How One Side Chain Decides EverythingProtein Three-Dimensional Structure: The Sequence Sets the ShapeWhy these?
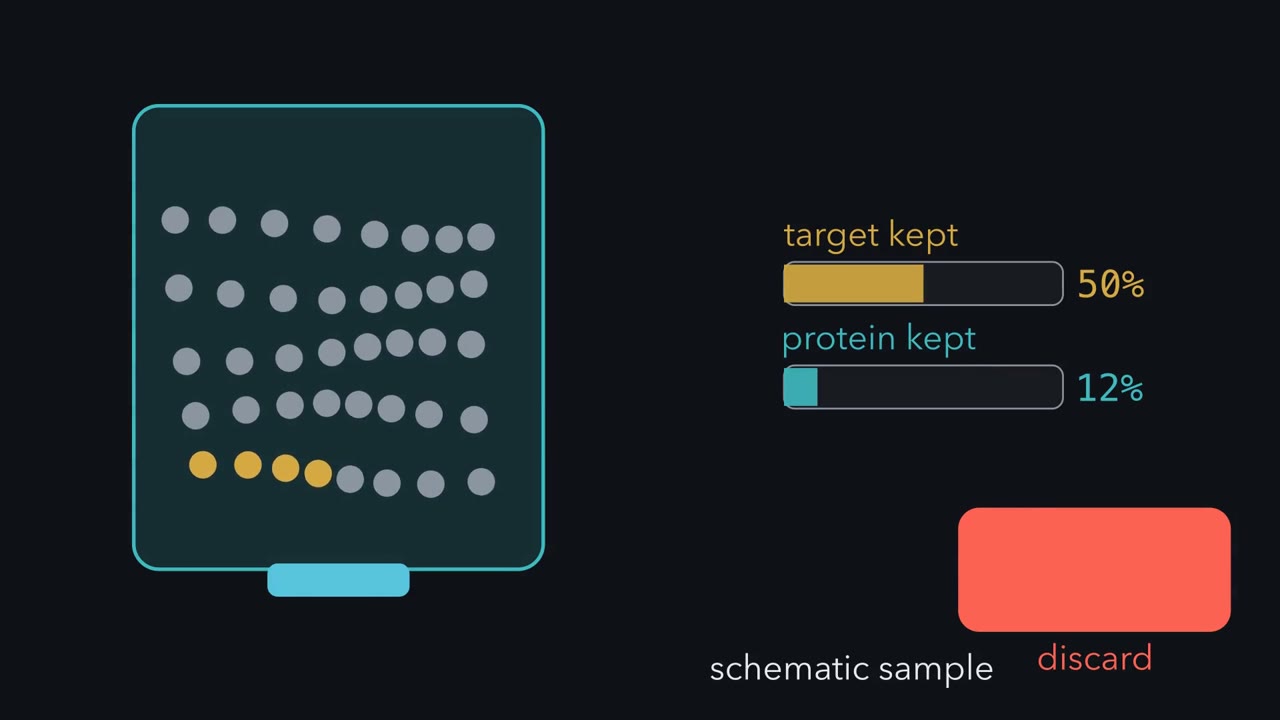 ▶ Watch Purity Through Selective Loss · 3:16
Read the transcript of “Purity Through Selective Loss”
Film transcript: Purity Through Selective Loss
How can losing nearly half your enzyme make purification better? Follow the gold target through one sample, and the answer becomes visible. Gold tokens mark active target. The whole gold-and-grey pile represents total protein.
Before any separation, you need an assay that finds the target. For an enzyme, its reaction reports activity in units. Total protein measures every protein in the same tube. Our crude homogenate has 100,000 activity units and 10,000 milligrams of protein. Divide activity by total protein. Specific activity is 10 units per milligram. The salt cut keeps 90% % of target activity but only 30% % of total protein. Specific activity triples, from 10 to 30. Purity rose although some target was lost. Here is the guiding idea. A good step keeps a larger fraction of target activity than total protein. Specific activity rises by the ratio of those retained fractions.
Now the late affinity step keeps about 55% % of the activity it receives. It keeps only 2% % of the protein. Is losing nearly half the activity a failure? No. 55% % divided by 2% % is about 27. Specific activity jumps from 1,100 to 30,000 units per milligram. This is the best step of the whole route. Two other numbers describe the trade-off. Yield is activity now divided by starting activity.
Fold-purification is specific activity now divided by its starting value. One tracks quantity; the other tracks enrichment. Across this route, activity yield falls to 36%. Yet specific activity rises 3,000-fold. Step by step, both the enrichment factors and the losses multiply. The ledger judges a step; it does not choose one. Choose a property where the target differs from contaminants: solubility, charge, size, or selective binding. Then assay every fraction. In its simplest form, the ledger treats activity per milligram of target as constant. Inactivation can hide enrichment. Removing an inhibitor can mimic it. The text below handles these cases.
So purification is not a contest to lose nothing. Ask whether each step keeps a larger fraction of target activity than total protein. That is how selective loss creates purity.
From the film
- An assay tracks the target through every purification step.
- Specific activity rises when a step retains a larger fraction of target activity than total protein.
- Yield tracks retained activity, while fold-purification tracks enrichment from the start.
- Choose a method using a property that distinguishes the target from contaminants.
Many of the clinical tests you will order as a physician run on the techniques in this lesson. The pregnancy test detects a hormone with an antibody, the troponin test that helps confirm a heart attack does the same, and the classic confirmatory HIV test was a western blot. The film above shows why purification can improve even while it loses target enzyme. In the table below, that enzyme begins at roughly 1 part in 3,000 of the protein in the tube.
The film’s fraction logic holds for any assay that counts the target: an enzyme reaction, a binding signal or an antibody signal. Reading it as purity assumes constant activity per milligram of enzyme (Going deeper, “When the ledger lies”). What the protein is is a separate question, answered at the end.
Find it: the assay and the unit
First you need an assay: a way to detect your protein in a tube where you cannot see it. For an enzyme, the assay is usually its own reaction. Lactate dehydrogenase (LDH) converts pyruvate to lactate, consuming the coenzyme NADH. NADH absorbs light at 340 nm and its oxidized form, NAD⁺, does not, so the absorbance falls, and the slope of that fall is the activity.
A slope is a rate. To turn a rate into an amount of enzyme, biochemists count in units. One unit is the amount of enzyme that converts 1 µmol of substrate per minute, under conditions you state (temperature, pH, substrate concentration). A unit counts catalytic work. It is not a mass.
In words The rate of NADH use equals the fall in absorbance each minute, divided by NADH's absorbance per molar per centimeter times the path length.
- rate“rate”
- how fast NADH is used upM per min
- ΔA₃₄₀“delta A 340”
- the fall in absorbance at 340 nm each minuteper min
- ε₃₄₀“epsilon 340”
- how strongly NADH absorbs at 340 nm: 6,220M⁻¹ cm⁻¹
- path length“path length”
- how far the light travels through the samplecm (usually 1)
Sanity check If the absorbance does not fall, there is no activity. Twice the enzyme should give twice the slope, as long as substrate is not running out.
Try one number
The absorbance falls by 0.311 each minute in a 1 cm cuvette holding 1 mL.
Rate = 0.311 / 6,220 = 0.000050 M per minute, which is 0.050 mM per minute.
1 mM is 1 µmol per mL, so in 1 mL that is 0.050 µmol of NADH used per minute: 0.05 units in the cuvette.
Need a refresher? rates and “per” · units and prefixes
Judge it: specific activity, yield and fold
The film above uses its gold-and-grey sample to build specific activity: units of activity divided by milligrams of total protein. While the enzyme stays fully active, it tracks the gold fraction in the figure below.
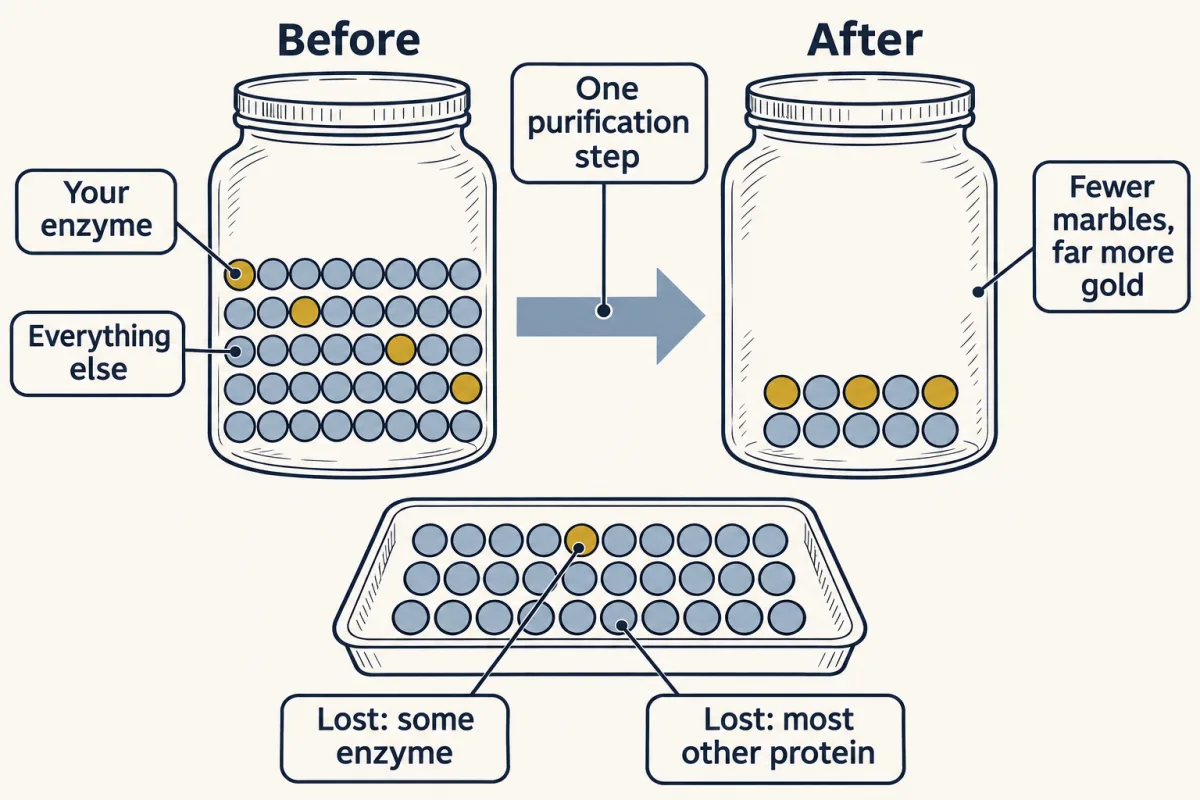
Reading the purification table
One enzyme, from crude homogenate (the broken-open cells) through four separation steps. The simulator below uses the same numbers, and its five buttons are the table’s five rows.
| Step | Total protein (mg) | Total activity (units) | Specific activity (units/mg) | Yield | Fold-purification |
|---|---|---|---|---|---|
| Crude homogenate | 10,000 | 100,000 | 10 | 100% | 1 |
| Salting out | 3,000 | 90,000 | 30 | 90% | 3 |
| Ion exchange | 900 | 81,000 | 90 | 81% | 9 |
| Gel filtration | 60 | 66,000 | 1,100 | 66% | 110 |
| Affinity | 1.2 | 36,000 | 30,000 | 36% | 3,000 |
Three columns are computed from the other two:
- Specific activity = total activity ÷ total protein.
- Yield = total activity now ÷ total activity at the start: how much enzyme you still have.
- Fold-purification = specific activity now ÷ specific activity at the start: how much purer the sample is.
The film above works the salt cut from the retained fractions; the table keeps the underlying totals.
Predict. The affinity step kept about 55% of the activity it was given (36,000 of 66,000 units) and 2% of the protein (1.2 of 60 mg). Is that a good step?
Check your prediction
It is the best step in the table. It lost almost half the enzyme, but 0.55 ÷ 0.02 ≈ 27: specific activity rose 27-fold, from 1,100 to 30,000. A step is judged by what it keeps of the target compared with what it keeps of everything else, not by how much it loses.
Predict. Can yield ever go up from one row to the next?
Check your prediction
Not if the assay is honest and no step activates the enzyme or removes an inhibitor (Going deeper, “When the ledger lies”). Every step loses some enzyme, and the losses multiply: 0.90 × 0.90 × 0.81 × 0.55 ≈ 0.36, the 36% in the last row. The step folds (each row’s specific activity over the row before) multiply too: 3 × 3 × 12.2 × 27.3 ≈ 3,000.
If 30,000 units/mg is pure enzyme, the homogenate at 10 units/mg was 1 part in 3,000: the opening’s haystack.
Run the purification one step at a time — click the highlighted ▶ button to advance. Watch the table and gel update as specific activity climbs and contaminants drop away.
| Step | Protein (mg) | Activity (units) | Sp. act. (u/mg) | Yield (%) | Step fold | Fold |
|---|
Run the simulator to fill the table one step at a time. On its gel, lane one is crowded with bands, and by the affinity step one strong band stands nearly alone.
Enrich it: one property per row
The film’s selector wheel previews the four properties below. Step zero: break the cells open into a homogenate, then spin; what sinks is the pellet, and the liquid above it is the supernatant. Differential centrifugation uses force as a sieve. A gentle spin drops the heavy nuclei; crank it harder and mitochondria pellet; harder still and the smallest vesicles go down, leaving cytosol in the final supernatant. Each spin trades one mixture for two cleaner ones.
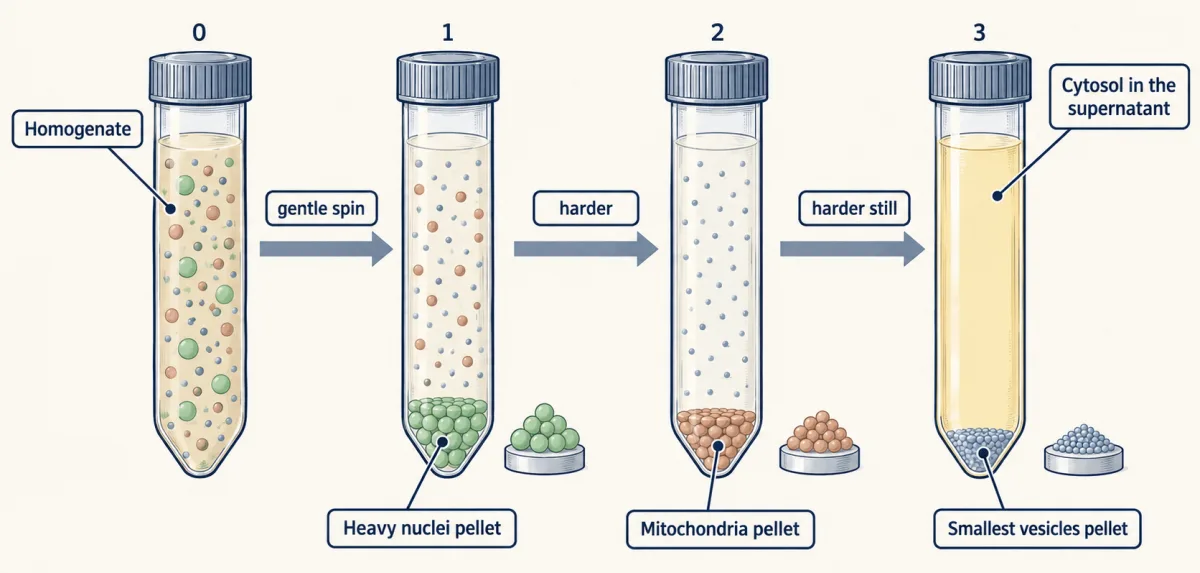
What centrifugation cannot finish, you finish with four properties, one at a time: the first by precipitation, the other three on chromatography columns.
Solubility: salting out
Add ammonium sulfate and proteins begin to drop out of solution, but not all at once. Different proteins precipitate at different salt concentrations, so a carefully chosen cut keeps most of your enzyme and leaves many contaminants behind. A round of dialysis through a semi-permeable membrane then washes the salt back out, because the next column, ion exchange, needs low salt to bind the protein.
Charge: ion exchange
An ion-exchange column carries fixed charges on its beads, and opposite charges stick. The rule compares the buffer pH with the protein’s pI, the pH at which its net charge is zero. At a pH below its pI, a protein is net positive; above its pI, it is net negative. Raise the salt or shift the pH and the bound protein lets go.
The names are the trap. A resin with negative charges holds and swaps positive ions, cations, so it is a cation exchanger. A resin with positive charges is an anion exchanger. Name the resin by what it catches, not by its own charge.
Suppose the enzyme has a pI of 5.0 and the column runs at pH 8.0. The buffer is above the pI, so the enzyme is net negative and sticks to a positive resin, an anion exchanger.
Predict. Which resin would you use for the same enzyme at pH 4.0?
Check your prediction
A cation exchanger. At pH 4.0 the buffer is below the pI of 5.0, so the enzyme is net positive and sticks to a negative resin, which catches cations.
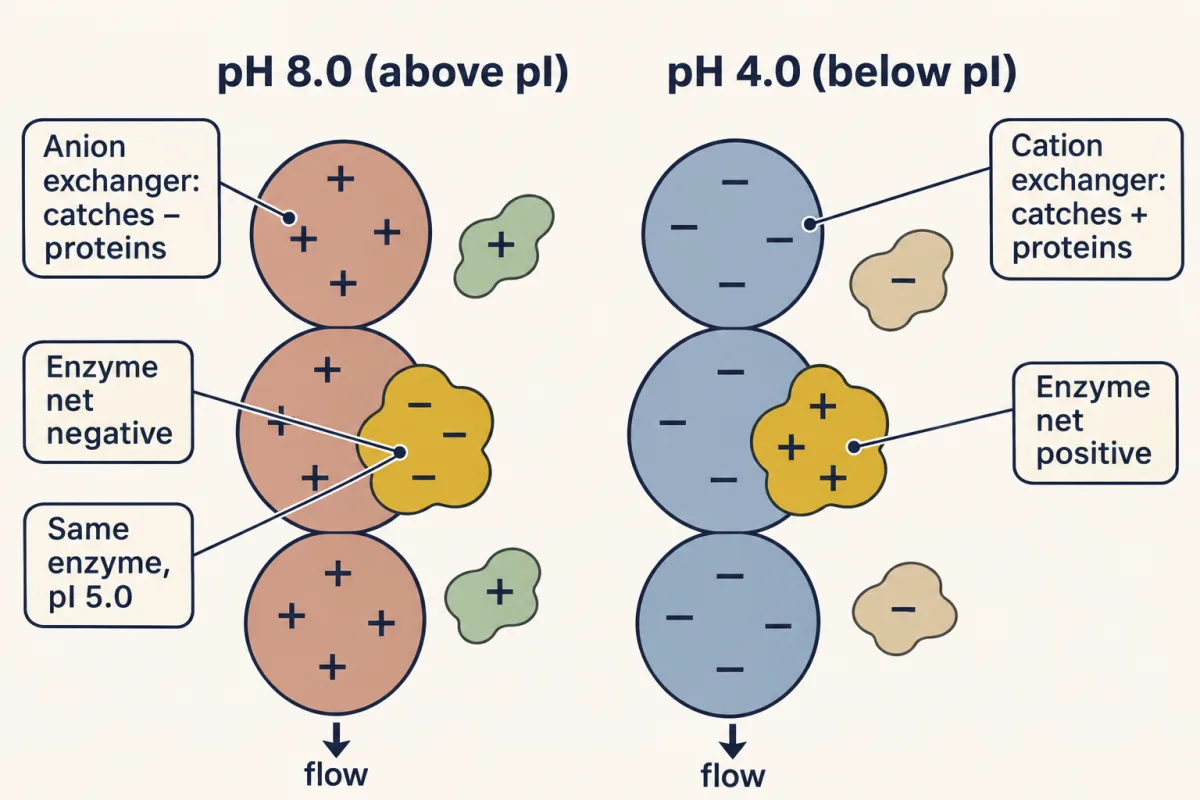
Size: gel filtration
Gel filtration runs backward from intuition. The column is packed with porous beads. A large protein cannot enter the pores, so it can use only the liquid between the beads, and less buffer washes it through: it elutes (comes off the column) first. A small protein also explores the liquid inside every bead, so it takes more buffer to come off and elutes last.
Binding: affinity
Decorate the beads with something your protein binds tightly and selectively (a substrate analog, a cofactor, an antibody, a metal that grips a His-tag, a run of histidines added to the protein), and your target binds while everything else flows through. Then release it, often with a flood of free ligand or a competitor, sometimes with a change in pH. Affinity is usually the most selective step. Its limits: you need a ligand your protein binds, and capacity and cost restrict how much you can load.
Which step goes first?
A property tells you which resin to choose; load and volume set the order. Early steps must handle large volumes and a lot of protein, as salting out and ion exchange can, and as affinity capture can when you have a tag or ligand and enough resin; a His-tag or a known ligand makes affinity capture a natural first step. Gel filtration resolves well only when the load is a small fraction of the column volume, so it usually comes late, polishing a small, concentrated sample. The table’s numbers follow a classic textbook example, which runs gel filtration before affinity; its 12-fold gel-filtration step is generous, since size exclusion usually gives a few-fold. The simulator’s order is one sensible route of several.
The column chooser below runs one four-protein mixture through four columns, including hydrophobic interaction (HIC), which sorts proteins by how greasy their surfaces are. Switch columns and watch the elution order rearrange.
No single column purifies a protein — but each sorts on a different axis, so two or three in series exploit independent properties and multiply their power. Affinity is the outlier: by exploiting one specific binding interaction it can do in a single step what size and charge need several to approach.
Know when to stop
Two signs, taken together, suggest the protein is pure: specific activity stops rising when you add another step, and a gel shows one band at the right size (or one per kind of subunit, in fixed proportion, for a protein built from different chains).
The gel is a check, not a purification step: a small sample run on SDS-PAGE, which sorts chains by size (next section), is sacrificed; the rest of your prep is untouched. The band pattern is needed but not enough: two proteins of the same size run together, and a contaminant can sit below what the stain detects.
Predict. You add a sixth step. Specific activity stays at 30,000 units/mg and the yield falls. What do you conclude?
Check your prediction
Most likely the enzyme was already pure: the step kept the same fraction of activity as of protein, a ratio of 1, and cost enzyme for nothing. Or the column sorts on a property where the leftover contaminants look like your enzyme. The flat number cannot tell these apart; the gel can help.
Prove it: three questions
A pure protein still needs an identity. Ask three questions.
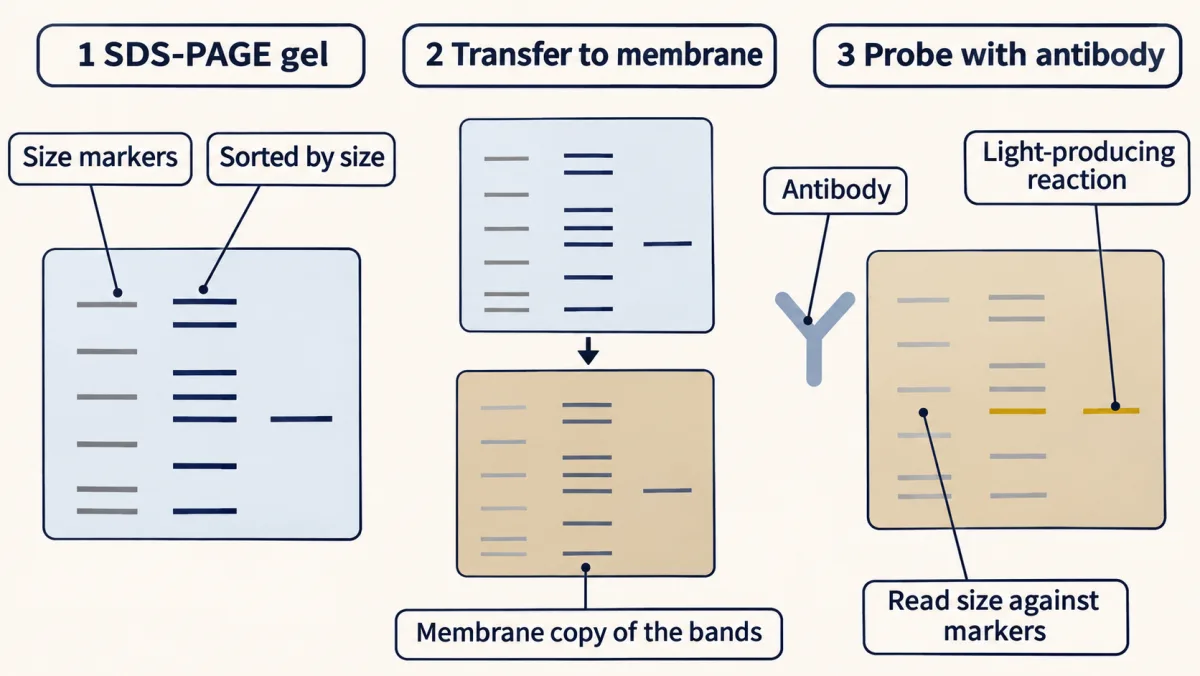
What size is it? Use SDS-PAGE. The detergent SDS unfolds the chain and coats it at roughly one molecule per two residues, giving nearly every protein the same charge-to-mass ratio. Proteins then sort by size alone, the small ones running fastest, and you read the size against a ladder of marker proteins (proteins of known size run in a lane alongside). (Some proteins run at the wrong size; see Going deeper.)
Is it the protein I think it is? One route uses antibodies, which are also how you track a protein with no reaction to assay, such as a hormone receptor. Transfer an SDS-PAGE gel to a membrane, probe it with antibodies, and light up one band with a light-producing reaction (chemiluminescence): the western blot.
The other route uses mass. Cut your protein with trypsin, weigh the pieces by MALDI-TOF mass spectrometry, and match the mass list against the computer-predicted digest of every protein in a database: a peptide mass fingerprint. MALDI-TOF sends ionized peptides down a flight tube where heavier ones arrive later (for ions of the same charge, which in MALDI is usually +1), weighing them to a fraction of a dalton. Few proteins give the same set of masses, so the fingerprint identifies a known protein without reading its sequence.
What is its sequence? Edman degradation clips off the N-terminal residue, identifies it, and repeats. But each cycle is only about 98% efficient.
Predict. After fifty cycles, roughly what fraction of the chains are still in step?
Check your prediction
About a third: 0.98⁵⁰ ≈ 0.36. The losses multiply, just as yields do in the purification table. Signal from chains still in step falls, out-of-step background builds up, and the method stalls past roughly fifty residues. So long proteins are cut into overlapping peptides and read in pieces.
The modern answer is tandem MS. Fragment one peptide inside the mass spectrometer into a ladder of pieces, each one residue shorter than the next, and read its sequence from the spacing between peaks, since each gap matches the mass of one amino acid (with some blind spots, in Going deeper). Frederick Sanger spent twelve years reading the 51 amino acids of insulin by hand; today mass spectrometry can identify a protein from its peptides in a single run.
What each method answers
The ledger says whether your protein is there, how pure it is, whether each step helped and how much you kept. The gel checks chain size and gives a first look at purity. Antibodies, masses and sequence say which protein it is.
Going deeper
The proteome in numbers
A single human cell holds billions of protein molecules, drawn from only about ten thousand distinct species. Across the body, alternative splicing and post-translational modification expand the roughly 20,000 protein-coding genes into a far larger set of protein forms; estimates run into the millions, but no one has counted them.
When the ledger lies
Specific activity reads as purity only while activity per milligram of enzyme stays constant. A step that inactivates some enzyme makes specific activity understate the enrichment. A step that removes an inhibitor or adds an activator can raise specific activity with no purification, and can raise total activity too, giving a “yield” above 100%. Either way, the ledger is reporting a change in activity per milligram of enzyme, not a change in purity.
Planning the order
Purifications are often planned as capture, intermediate purification and polishing. Sort on a different property at each stage: after a charge step, the contaminants left are the ones whose charge resembles your enzyme’s at that pH, so repeating the same charge step buys little (a charge step at another pH, or on the opposite resin, can still help), while a size step can still separate them (if size and charge are not linked among them). Each step should also leave the sample in a buffer the next can take: hydrophobic interaction suits a high-salt sample straight from an ammonium sulfate cut, while ion exchange needs low salt. HPLC (high-performance liquid chromatography) speeds any of these columns up: fine beads under high pressure, paid for with expensive plumbing.
Isoelectric focusing and 2D gels
Isoelectric focusing sorts by pI: proteins drift through a pH gradient until each stalls where its net charge is zero. Run focusing first, then SDS-PAGE at a right angle, and you get a 2D gel, with proteins as spots placed by both pI and mass. Compare a healthy proteome to a tumor’s, and a spot that shifts or brightens is a candidate biomarker. A spot that moves to a more acidic pI at the same mass suggests a modification that adds negative charge, classically phosphorylation.
More antibody methods
An antibody-coated bead pulls its target out of a mixture (immunoprecipitation). Coat a plate instead and you have an ELISA, the clinic’s workhorse, with concentration read off a standard curve; in the classic HIV algorithm, a western blot confirmed a positive ELISA screen. The same antibody-sandwich logic in a lateral-flow strip runs the pregnancy test and the COVID rapid test.
When SDS-PAGE misleads
The charge-to-mass ratio is nearly, not exactly, the same for every protein. The one-SDS-per-two-residues figure holds: about 1.4 g of SDS binds each gram of protein, which at 110 g/mol per residue and 288 g/mol for SDS is about 0.53 SDS per residue. Glycoproteins, very basic proteins and membrane proteins can run anomalously, and disulfide bonds must be reduced for each chain to run at its own size.
Inside the mass spectrometer
MALDI embeds the sample in a matrix and hits it with a laser pulse; the matrix absorbs the energy and launches the ions into the flight tube. Tandem MS has well-known blind spots: leucine and isoleucine have identical mass (113.08 Da); lysine and glutamine differ by only 0.04 Da, which only high-resolution instruments separate; and some single residues weigh the same as pairs (asparagine and Gly-Gly, glutamine and Ala-Gly). So MS/MS alone cannot always tell them apart.
Edman’s blind spot
Edman degradation needs a free N-terminus. Many eukaryotic proteins, including most human ones, are acetylated at the N-terminus, which blocks Edman on the intact chain; internal peptides from a digest can still be read.
Your notes
Select any text in the lesson to highlight it or add a note to it. Your highlights and notes are saved in this browser and collected in your notebook.
This browser is not letting the site save anything (a private window or strict privacy settings), so highlights and notes will be lost when you leave the page.
How we measure it
The enzyme assay
You cannot purify what you cannot find. An assay reports how much of your target is present at each step — for lactate dehydrogenase, the NADH coenzyme it consumes absorbs at 340 nm, so a spectrophotometer reads activity straight off the falling line.
Specific activity and the purification table
Specific activity = enzyme units divided by total protein (units/mg). It rises every time a step removes contaminant faster than it loses your target, so the column of specific-activity numbers — not the raw activity — tells you whether the purification is actually working.
Peptide mass fingerprinting
Cut a protein with trypsin into a predictable set of peptides, measure their masses by MALDI-TOF, and match that list against the in-silico (computer-predicted) digest of every protein in a database. The pattern of peptide masses identifies the protein the way a fingerprint identifies a person.
Practice questions on this lesson (8) → MCAT-style, original, each with an explanation
Where this lesson fits
Before thisReview first
- Amino Acids: How One Side Chain Decides EverythingThis course · Lesson 4
You need each side chain's charge and pKa from there to predict a protein's pI and how it behaves on an ion-exchange column.
- Protein Three-Dimensional Structure: The Sequence Sets the ShapeThis course · Lesson 5
Folded shape and subunit structure explain why affinity binding works and why SDS unfolds chains to sort them by size.
After thisStudy next
- Enzyme Kinetics: The Michaelis–Menten ModelThis course · Lesson 8
The activity assay and units used here become initial rates and Michaelis–Menten parameters measured on the purified enzyme.
- Basic Concepts of Enzyme ActionThis course · Lesson 7
It explains what an enzyme's catalytic activity is, the very quantity this lesson counts to follow the protein through each step.
Suggested by an AI model from the lessons themselves, then checked. How we use AI
Finish line
Test yourself
8 questions
Practice and MCAT-style, with explained answers.
Next · Lesson 7
Basic Concepts of Enzyme Action
Can an enzyme make an impossible reaction happen? No — it can only make a possible one fast.
Continue →← Lesson 5 · Protein Three-Dimensional Structure: The Sequence Sets the Shape