Genetics and Molecular Biology · Unit 5: Tools and genomes
New to this? Review it at high school level: Engineering Genes
Recombinant DNA, Cloning and PCR
Rewritten on : new text, flashcards and film. Your notes and highlights stay, but the text around them may have moved.
A white colony survives ampicillin and a PCR tube ends with a bright band. How do you know either contains the DNA you wanted?
Pause when the reading reaches a film, and offer to play it. Saved on this device.
Watch the film now, or keep listening
Builds on:Bacterial and Phage Genetics: Conjugation, Transduction and TransformationDNA Replication: Semiconservative Copying and Its MachineryDNA Is the Genetic MaterialWhy these?
 ▶ Watch From DNA Fragment to Verified Clone · 3:39
Read the transcript of “From DNA Fragment to Verified Clone”
Film transcript: From DNA Fragment to Verified Clone
A colony has survived an antibiotic. Does it carry the DNA you wanted? Survival is encouraging, but it answers only one question. Follow one candidate insert through a chain that narrows what the colony might contain. Start with a blue plasmid and a yellow DNA insert. Matching restriction cuts create compatible ends on both pieces. Their exposed bases can pair.
DNA ligase seals the backbone. This creates a recombinant candidate, but other products can form too. Compatibility permits a join; it does not verify the joined pieces. The plasmid carries an origin, a selectable marker, and a cloning site. The origin lets the host copy the circle. The marker can let plasmid-bearing cells survive an antibiotic. The cloning site holds the insert. These parts make propagation possible, but none reads the insert's complete sequence. Next, the plasmid enters bacteria by transformation.
Only some cells take up a circle. Those cells divide, copying the plasmid as they grow. Cells with no plasmid remain mixed among them. The tube now contains several possibilities, so the experiment needs a way to narrow the population. Selection asks whether a cell probably carries a plasmid with the marker. Spread the cells on antibiotic.
Plasmid-free cells stop growing. Marker-bearing cells form colonies. Yet an empty vector can carry the same marker. Survival enriches plasmid-bearing cells; it does not identify the construct inside each colony. Several colonies remain, and their plasmids are hidden. Which next observation would separate an empty vector from the intended construct? Hold the plate in mind. You need evidence about the DNA inside a colony, not another test of antibiotic survival.
Screening inspects the candidate DNA. A colony PCR or restriction digest can test whether fragments have expected sizes. A matching pattern moves a colony forward, but size is not sequence. Screening changes the odds. It does not turn a candidate into proof. Sequence both junctions and the insert to test the bases and orientation. A correct sequence supports the intended construct. Expression is a separate question: the plasmid also needs a working promoter and other expression parts. Each result earns only the conclusion its measurement can support. The chain now makes sense. Compatible ends create possibilities.
Transformation and growth create copies. Selection removes many cells without plasmids. Screening narrows the candidates. Sequencing tests the construct itself. Cloning succeeds by combining amplification with evidence, one inference at a time.
From the film
- Selection finds plasmids; screening narrows candidates; sequencing identifies the construct.
- Matching restriction cuts make compatible ends, and DNA ligase seals the joins.
- A cloning vector needs an origin, a selectable marker and a cloning site.
- Antibiotic survival alone does not show that the intended insert is present.
The first film took one insert from cut ends to a sequenced clone; here is what it skipped.
The one idea. Amplification solves scarcity, not identity: cut sites and primers set what can be joined or copied, while readouts and controls test what actually was.
Scope: this lesson’s methods. A restriction site or primer pair can still admit an unintended product, and not every readout establishes sequence. Nor does making more DNA report the starting amount; only qPCR timing estimates that, under stated assumptions.
Cut at a known site, then seal the join
Many bacteria fight phages, viruses that inject their DNA into bacterial cells, with a restriction enzyme that cuts unmodified copies of a short recognition sequence and a methylase that marks those sites in their own DNA. Host DNA is usually spared; matching sites in incoming unmarked phage DNA can be cut.
Laboratory type II restriction enzymes recognize defined sequences and cut at fixed positions in or near them. Many sites are palindromes of four to eight base pairs: they read the same 5’ to 3’ on both strands. EcoRI, from E. coli, recognizes 5’-GAATTC-3’ and cuts each strand between G and A. The cuts sit four bases apart, leaving single-stranded 5’ AATT overhangs that let EcoRI ends pair, so they are called sticky, or cohesive. SmaI cuts both strands at the same point in CCCGGG and leaves blunt ends.
Predict. EcoRI leaves AATT overhangs and BamHI leaves GATC. Will an EcoRI-cut insert pair with a BamHI-cut vector?
Check your prediction
No. “Sticky” means single-stranded, not universally compatible; AATT and GATC do not pair. For enzymes like these, which leave a fixed overhang, the same enzyme on vector and insert gives compatible ends; two enzymes whose ends are distinct and cannot pair, such as EcoRI at one end and BamHI at the other, also fix the insert’s orientation.
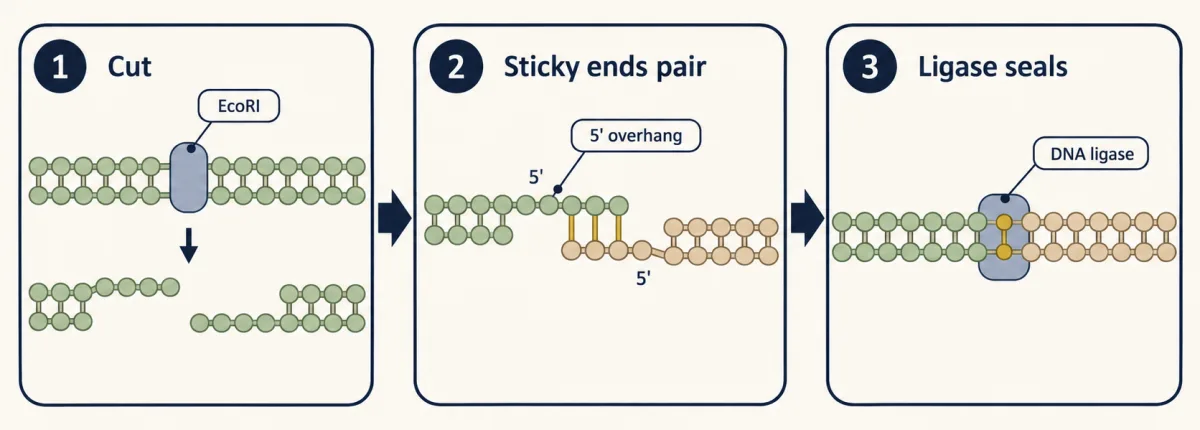
Like matching jigsaw tabs, compatible ends fit but only loosely. DNA ligase forms the missing phosphodiester bond between a 3’-OH and a 5’-phosphate on each strand. T4 DNA ligase can also join blunt ends in vitro.
Into bacteria: retain, screen, confirm
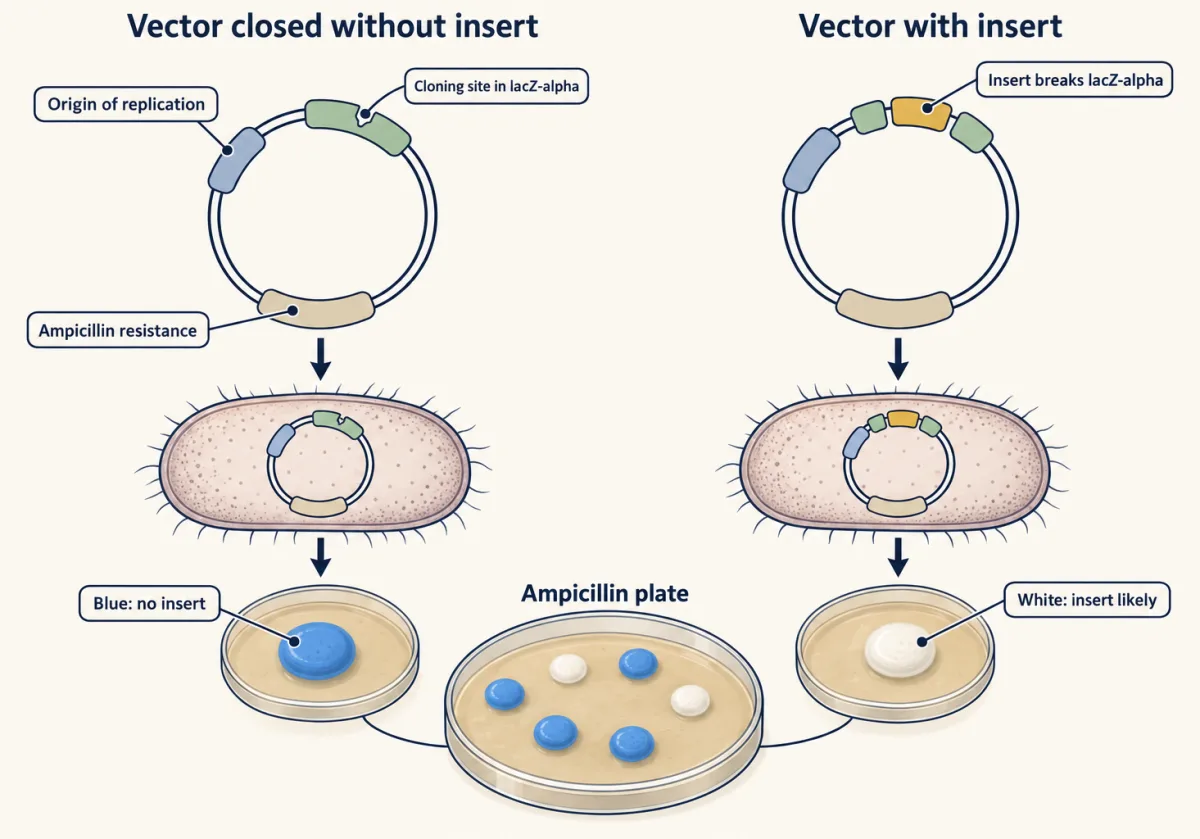
A plasmid is a small DNA circle copied separately from the bacterial chromosome (see bacterial and phage genetics). A cloning vector carries an origin of replication, without which the plasmid is lost as cells divide; a selectable marker such as ampicillin resistance; and a cloning site of unique restriction sites.
Bacterial uptake of naked DNA is transformation: cold calcium chloride and a brief heat shock, or an electric pulse (electroporation), let a fraction of cells take it up. It differs from transfection (DNA entry into animal cells) and oncogenic transformation (a cell becoming cancer-like).
Selection on ampicillin kills plasmid-free cells but spares empty vectors, so screening asks which plasmid survived. In blue-white screening, the cloning site lies inside lacZ-alpha, a short part of the beta-galactosidase gene from the lac operon. The host makes the rest of the enzyme; together the parts turn colorless X-gal blue. An insert usually disrupts lacZ-alpha, so recombinant colonies stay white, but some white colonies carry no insert.
Predict. A colony on the same ampicillin plate is blue. What does it most likely carry?
Check your prediction
A vector that closed up without an insert, leaving lacZ-alpha intact. Pick white colonies, but white is a strong hint, not proof: check each as the first film did.
Expressing the insert needs a promoter and other expression parts (see hacking the cell).
Before PCR, cloning in bacteria was the usual way to make many copies of a DNA fragment; both routes remain routine. PCR copies DNA in a tube, with no living cell involved; the second film follows one bounded region as it grows.
Read the transcript of “Reading a PCR as It Grows”
Film transcript: Reading a PCR as It Grows
The first film grew DNA inside bacteria. Now two PCR tubes end equally bright. Did they start with the same amount? The answer hides in how the signal grew. Watch a bounded target become a curve that can be read. PCR starts with template DNA, primers, nucleotides, and heat-stable polymerase. A yellow primer binds each grey strand. Their 3' ends point into the target. Polymerase extends from those ends. Primer placement sets the candidate boundaries for amplification. Heating separates template strands. Cooling lets each primer pair with its site. Polymerase extends each primer, building blue DNA along grey template. Repeat the cycle, and earlier products become templates.
Like a photocopier whose copies can be copied, the bounded target branches into a growing family. During ideal early cycles, each completed target can seed another copy. Product can double every cycle, bending the graph upward. The blue curve is computed from starting amount times two raised to cycle number. Real reactions follow this only early. As product accumulates, amplification slows toward a plateau. Different starting amounts can finish at similar levels. Endpoint brightness loses how each reaction arrived there. Real-time PCR preserves that history by measuring fluorescence throughout the run, while early curves remain separated. A green threshold crosses both curves.
One curve reaches it earlier, although both endpoints look alike. Which reaction began with more target? Think about how many rounds each needed to reach the same fluorescence. The earlier crossing came from more starting target. That reaction needed fewer rounds to reach the shared threshold. The crossing is the threshold cycle, written Ct. With matched, near-perfect efficiency, an earlier Ct means more starting template. The plateau cannot support that inference. Real-time quantitative PCR watches DNA accumulate.
Reverse-transcription PCR starts differently. Reverse transcriptase copies RNA into complementary DNA, which PCR can amplify. Combining the steps measures an RNA target. The fluorescence still reports amplified DNA, not RNA directly. A curve is evidence only within a controlled comparison. A tube with no template can expose contamination.
For RNA, a tube without reverse transcriptase can expose genomic DNA. A known positive shows the assay works. Controls turn a glowing curve into an interpretable result. The early rising curve preserves information about starting amount. The endpoint mostly shows that product accumulated. Read the crossing under stated assumptions, then challenge the signal with controls. The useful measurement is when the curve arrives, not how bright it ends.
From the film
- Copy timing estimates input; endpoint abundance does not.
- Opposite-strand primers point their 3' ends into the target.
- Early ideal copying follows N = N0 x 2^n, for n cycles.
- With matched near-perfect efficiency, a lower Ct means more starting template.
- Controls distinguish target signal from contamination, genomic DNA and assay failure.
PCR: copying one bounded region
PCR needs a template, two primers, four dNTPs (see nucleotide metabolism) and a DNA polymerase, which adds nucleotides only to the 3’-OH of a primer paired with a template, as in DNA replication. Each cycle has three steps:
- Denature at about 94 to 98 °C to separate the strands.
- Anneal a few degrees below the primers’ melting temperature so each primer pairs with its site.
- Extend, typically at 72 °C for Taq polymerase, which lengthens each primer 5’ to 3’.
Primers are commonly 15 to 30 nucleotides, with matched melting temperatures and no self-pairing or hairpins. Primer-BLAST can check a pair against a sequence database for unintended targets.
Predict. After two ideal cycles from one long genomic duplex, are any double-stranded molecules bounded by both primers?
Check your prediction
No. The first copies start at one primer but run past the other site. Exact-length strands appear in cycle 2, paired with longer strands; exact-length duplexes first appear in cycle 3.
After n ideal cycles, exact-length duplexes number 2n - 2n per starting genomic duplex. By cycle 30, they are nearly all the product.
| Copies after the chosen cycles, ideal N0 x (1 + E)^n | |
|---|---|
| Copies in the plotted reaction (plateau level is a sketch) | |
| Ct expected from the formula | |
| Ct observed: first whole cycle at the threshold |
Keep the rule: a lower Ct means more starting template, and at 100% efficiency one cycle earlier means twice as much; a plateau hides the starting amount at the end but not at the threshold. The plateau level and threshold height are relative units, a sketch of the logic.
Worked problem (a). Starting from 10 double-stranded template molecules with perfect doubling every cycle, how many copies are there after 30 cycles?
N = N0 x (1 + E)n, with E = 1 for perfect doubling
- Each cycle multiplies by 2, so 30 cycles multiply by 230 = 1,073,741,824.
- N = 10 x 1,073,741,824 = 10,737,418,240, or about 1.07 x 10¹⁰.
Amplification is exponential only early; in one model system, reactions with different starting amounts converged on the same plateau. Making more DNA neither identifies nor quantifies it.
Counting from when the signal appears
The threshold cycle, Ct, from the second film, is the cycle at which fluorescence crosses a set threshold during exponential amplification. Real-time quantitative PCR (qPCR) reads fluorescence each cycle with a double-stranded-DNA dye or a sequence-specific probe. RT-PCR (reverse-transcription PCR) first copies RNA into complementary DNA (cDNA); RT-qPCR combines them to measure mRNA. With matched, near-perfect efficiency and the same threshold, a lower Ct means more starting template; at 100% efficiency, one cycle earlier means twice the starting template.
Predict. Target and reference Ct values both move one cycle earlier in a treated sample. Has target abundance changed relative to the reference?
Check your prediction
No. Subtracting reference Ct from target Ct removes the shared shift, so delta Ct is unchanged; relative qPCR asks whether that gap changes between conditions.
Worked problem (b). Both reactions are about 100% efficient. Target gene Ct is 24.0 in treated cells and 26.5 in control; reference gene Ct is 18.0 in treated and 18.5 in control.
fold change = 2−ΔΔCt, where ΔCt = Ct(target) - Ct(reference)
- ΔCt treated = 24.0 - 18.0 = 6.0.
- ΔCt control = 26.5 - 18.5 = 8.0.
- ΔΔCt = 6.0 - 8.0 = -2.0.
- Fold change = 22 = 4. Target mRNA is about 4-fold higher in treated cells.
The method assumes equal efficiencies near 100% for both assays and a reference gene shown not to change in this experiment.
Reading the result: size, identity and controls
In an agarose gel, DNA’s negatively charged backbone moves toward the positive electrode, and smaller linear fragments move faster through the mesh. A size ladder of known fragments in a neighboring lane turns position into an estimated length. Uncut circular plasmid runs differently from the same plasmid cut into a line. A right-sized band is evidence about size, not identity.
Blots add identity: in Southern’s 1975 method, gel-separated DNA fragments are denatured, transferred to a membrane and paired with a labeled probe. Only complementary fragments light up. A Northern blot does the same for RNA. A Western blot transfers proteins separated by SDS-PAGE and detects one with an antibody (see protein purification techniques).
Predict. In an RT-qPCR run, the no-reverse-transcriptase control crosses the threshold ten cycles after the matched full reaction. Does genomic DNA explain much of the signal?
Check your prediction
Very little. With no cDNA made, that signal comes from DNA already in the RNA. At about equal efficiency, ten cycles later means about 210, or roughly 1,000-fold, less template: about a tenth of a percent of the signal.
Match each control to a failure:
- a size ladder calibrates every gel;
- a no-template control detects PCR contamination, and a no-RT control detects genomic DNA in an RNA preparation;
- a positive control shows the assay works, and an inhibitor check such as a spike-in shows that a negative sample means the target was not detected rather than that the reaction failed;
- a loading control on a blot, such as a stable-RNA reprobe or total-protein stain, supports comparison within its linear range.
Design problem
You cut a 5.0 kb vector and a 1.2 kb insert with EcoRI and BamHI, ligate, transform and select on ampicillin. Insert plus vector gives 200 colonies; vector alone with ligase gives 180. Interpret the result and redesign the experiment.
Saved in this browser only.
One way to do it
Interpret. An EcoRI end (AATT overhang) cannot pair with a BamHI end (GATC overhang), so a vector cut by both enzymes cannot close on itself. Colonies from vector alone mostly come from vector that was cut by only one enzyme, whose matching ends re-ligate, or not cut at all, since uncut plasmid transforms well. Less often, the small piece cut out between the two sites is ligated back in. That background is 180 of 200, so most colonies on the insert plate probably lack the insert.
Redesign.
- Digest the vector longer or with more enzyme, and check each single digest.
- Gel-purify the cut vector away from uncut circles. When the two sites sit close together, as in a cloning site, singly and doubly cut vector run at almost the same size, so this step alone is not enough.
- Dephosphorylate the vector with alkaline phosphatase. Without 5’-phosphates it cannot re-ligate, while the insert still supplies phosphates for each junction.
- Add controls: cut vector without ligase, to measure carry-over of uncut plasmid (the vector-only ligation above adds singly cut vector that re-closes); and uncut plasmid, to measure transformation efficiency.
- Screen colonies by colony PCR or by EcoRI plus BamHI digest, expecting bands of 5.0 and 1.2 kb, then sequence across both junctions and through the insert.
Going deeper
From test-tube joins to copied constructs
In 1972 David Jackson, Robert Symons and Paul Berg joined lambda phage genes and the E. coli galactose operon to SV40 DNA entirely in a test tube. That year Janet Mertz and Ronald Davis showed that EcoRI ends are complementary and that a restriction enzyme plus ligase can make hybrid molecules.
In 1973 Stanley Cohen, Annie Chang, Herbert Boyer and Robert Helling joined restriction fragments from separate plasmids, transformed E. coli and recovered plasmids with properties of both parents. Berg’s group made recombinant DNA first; the Cohen and Boyer collaboration first showed a recombinant plasmid replicating in a cell.
Why PCR no longer needs fresh enzyme each cycle
The first published PCR, in 1985, used the Klenow fragment of E. coli DNA polymerase I. Heating destroyed it, so fresh enzyme was added every cycle. That Cetus team amplified a short beta-globin region about 220,000-fold.
In 1988 the group reported PCR with polymerase from Thermus aquaticus, which survives denaturation. Taq lacks a 3’ to 5’ proofreading exonuclease, so its copies carry more errors. In one 1991 reporter assay, products made with Pfu polymerase carried fewer than a tenth as many mutations. Kary Mullis shared the 1993 Nobel Prize in Chemistry for conceiving PCR.
Your notes
Select any text in the lesson to highlight it or add a note to it. Your highlights and notes are saved in this browser and collected in your notebook.
This browser is not letting the site save anything (a private window or strict privacy settings), so highlights and notes will be lost when you leave the page.
How we measure it
Restriction-ligation cloning
Vector and insert are cut with restriction enzymes to give compatible ends, joined with DNA ligase, and introduced into E. coli by transformation. Antibiotic selection keeps cells that carry a plasmid; screening, digestion and sequencing show which plasmid it is.
PCR and real-time quantitative PCR
Two primers and a heat-stable polymerase copy the region between them in repeated cycles of denaturing, annealing and extension. Watching fluorescence each cycle gives a Ct value that falls as the starting amount of template rises.
Southern blotting
Restriction fragments separated on an agarose gel are denatured and transferred to a membrane, then hybridized with a labeled probe. Bands show which fragment sizes carry the probe's sequence.
Agarose gel electrophoresis
DNA is loaded into a gel and pulled toward the positive electrode by its negatively charged backbone. Smaller linear fragments move faster, and a size ladder in a neighboring lane turns position into an estimate of length.
Practice questions on this lesson (3) → MCAT-style, original, each with an explanation
Where this lesson fits
Before thisReview first
- Bacterial and Phage Genetics: Conjugation, Transduction and TransformationThis course · Lesson 11
Plasmids, transformation and phage defence against bacteria are used here without being re-taught.
- DNA Replication: Semiconservative Copying and Its MachineryThis course · Lesson 13
PCR extension relies on a polymerase adding nucleotides to a primer's 3' end, as in replication.
- DNA Is the Genetic MaterialThis course · Lesson 12
Cutting, joining and copying DNA assumes you know DNA carries the heritable information.
After thisStudy next
- Sequencing and GenomesThis course · Lesson 23
Sequencing is what finally identifies a construct, which gels and colonies alone cannot do.
- Forward and Reverse Genetics: Screens, RNAi and CRISPRThis course · Lesson 24
Editing and screening tools use cloned guide and vector constructs built with these joining and amplifying methods.
Elsewhere on the siteFilms, simulations and method films in other courses
- How Bacteria Make Human InsulinFilm · Biology
It shows restriction enzyme and ligase joining a gene into a plasmid to make recombinant DNA.
Suggested by an AI model from the lessons themselves, then checked. How we use AI
Finish line
Test yourself
8 questions
Practice and MCAT-style, with explained answers.
Next · Lesson 23
Sequencing and Genomes
A deeply sequenced genome can have almost no random gaps and still break at one repeat. How can both be true?
Continue →