Physiology · Unit 3: The heart and circulation
Cardiac Action Potentials and the ECG
Rewritten on : new text, figures and flashcards. Your notes and highlights stay, but the text around them may have moved.
A ventricular cell stays depolarised for about a fifth of a second. Why can't your heart cramp into a sustained contraction the way a skeletal muscle can?
Pause when the reading reaches a film, and offer to play it. Saved on this device.
Watch the film now, or keep listening
Builds on:Skeletal Muscle: Length, Load and SpeedWhy these?
Once excited, a ventricular muscle cell stays depolarised for a few hundred milliseconds, roughly a hundred times as long as a nerve spike. That plateau sets how much calcium enters, keeps beats from fusing, and shows on the skin as the stretch between the QRS complex and the T wave. This lesson goes further than circulation and the heart, from currents to the tracing.
Here is the puzzle that joins the cell to the tracing. Between the QRS complex and the T wave, nearly every ventricular cell sits on its plateau, depolarised well above its resting level. Yet the electrocardiogram (ECG) at that moment is flat, as flat as it is between beats, when every cell is at rest. Why?
The one idea to carry through this lesson. The ECG never shows a cell’s voltage, only differences between cells: it sees the edges of waves. When every ventricular cell is in the same phase, all at rest or all on the plateau, the trace is flat. It moves only while a boundary between excited and resting tissue travels through the heart: upward when depolarisation travels toward the positive electrode, or when repolarisation travels away from it. The more tissue the boundary spans, the bigger the deflection.
The rule is a simplification (a real ST segment is only nearly flat), and it says nothing about what sets the heart rate or holds the plateau. Those come from the cells’ own currents, so we build the cells first.
One ventricular cell: a long plateau
Picture the voltage of one ventricular cell through a single beat. The values are teaching values for a human or other large-mammal ventricle, from recent reviews; mouse and rat ventricular action potentials are much shorter, with little plateau.
- Phase 4, rest: flat near −90 mV, held close to the potassium equilibrium potential (EK, said “E sub K”) by the inward-rectifier potassium current IK1.
- Phase 0, the upstroke: sodium channels (Nav1.5) open once the membrane is depolarised to threshold, and the voltage overshoots well above zero.
- Phase 1, a small notch, as sodium channels inactivate and a transient outward potassium current, Ito, flows.
- Phase 2, the plateau: the voltage hangs near zero for about 200 ms.
- Phase 3, repolarisation: the voltage falls back to rest.
To see what holds the plateau, borrow the rule from the action potential: with no current injected, the voltage moves toward a balance point, the average of the ions’ equilibrium potentials weighted by their conductances, and it holds still where inward and outward currents cancel.
During phase 2 the main pull is between two sets of channels. The L-type calcium current (ICaL, through Cav1.2) flows in, helped by the sodium-calcium exchanger. The delayed-rectifier potassium currents IKr (the hERG channel) and IKs flow out. The currents are nearly equal, so the voltage changes only slowly, drifting down as the outward currents gain.
Why doesn’t the large resting potassium conductance drag the cell straight back to −90 mV? Because IK1 is an inward rectifier: it passes current well near rest but largely shuts at plateau voltages. So during the plateau the total conductance is low, and small currents hold the voltage. That makes the plateau easy to stretch. Block one of the outward currents, as drugs that block hERG do, and the plateau lengthens, and with it the QT interval on the electrocardiogram (ECG).
Predict. Treat the plateau as just these two currents, at about +10 mV, with EK at −95 mV. The L-type channel’s current reverses at about +60 mV (below calcium’s own equilibrium potential, partly because the channel also lets some potassium out). Hold them in balance at that instant: the inward calcium current equals the outward potassium current. Which has the larger conductance?
Check your prediction
Calcium’s. Current is conductance times driving force. Potassium sits 105 mV from its equilibrium potential (+10 minus −95); calcium sits only 50 mV below its reversal (+60 minus +10). To match a strong push with a weak one, calcium needs about twice the conductance (105 / 50 = 2.1). Check with the balance-point rule: (2.1 × 60 + 1 × (−95)) / 3.1 = +10 mV. So the plateau does not sit at the midpoint of −95 and +60 (about −18 mV); the larger calcium conductance pulls it up to +10.
In phase 3 the L-type channels inactivate, the same word you met for sodium channels: they shut with time at depolarised voltages, and as calcium builds up inside. Calcium’s pull fades, the potassium currents win, and the balance point slides down. As the voltage falls, IK1 conducts again and finishes repolarisation. Several potassium currents can repolarise the cell, so losing one to a gene variant or a drug is partly covered, a margin called the repolarisation reserve.
While the membrane is depolarised, sodium channels stay inactivated and the cell is refractory: a second stimulus cannot fire it. The refractory period lasts nearly as long as the action potential, and in heart muscle the contraction rises and falls within roughly those same few hundred milliseconds, so it covers most of the twitch. A skeletal muscle fibre, with its brief action potential, can be restimulated during a twitch and summed into tetanus (skeletal muscle mechanics). A ventricular cell cannot, so the ventricle refills between beats.
The classic experiment: what carries the plateau?
The fast sodium current inactivates within milliseconds, so what keeps a ventricular cell depolarised for hundreds? One candidate was a slowly inactivating sodium current. G. W. Beeler Jr. and Harald Reuter tested it in dog ventricular muscle under voltage clamp (Journal of Physiology, 1970). A conditioning depolarisation first inactivated the fast sodium system; then they recorded the inward current left. A slow inward current remained.
Predict. If sodium carried that slow current, what would sodium-free solution do to it? If it ran through the fast sodium channel, what would tetrodotoxin, a fast sodium channel blocker, do? And should external calcium matter?
Check your prediction
A sodium current should vanish in sodium-free solution, a current through the fast channel should be blocked by tetrodotoxin, and calcium should not matter. The real current did the opposite on all three. It persisted in sodium-free solution, was unaffected by tetrodotoxin and by magnesium, and was very sensitive to external calcium. It also inactivated slowly enough to span a plateau. They concluded that calcium carries it.
That ruled out the tetrodotoxin-sensitive sodium channel as the carrier. It did not show that the plateau is calcium current alone.
Calcium in, more calcium out
The calcium that holds the plateau also starts the contraction. It enters through L-type channels at the dyad, where a T tubule meets the junctional sarcoplasmic reticulum (SR). There it raises calcium in a narrow space and opens the SR’s ryanodine receptors (RyR2), which release far more: calcium-induced calcium release (CICR). The Fabiatos’ skinned-cell evidence is in muscle and movement.
Positive feedback like that could run away. It does not, because release is under local control. Each cluster of RyR2 responds mainly to the L-type channels next to it, so total release is graded with the L-type current: a smaller trigger gives a smaller release, not none. Release at each site also shuts off before the SR empties, by mechanisms still being studied. The fraction of SR calcium released per beat varies with SR load and the trigger. Calcium then returns to the SR through the pump SERCA and leaves the cell through the sodium-calcium exchanger (NCX), and the muscle relaxes.
Contractility, the strength of contraction at a given filling, rises with sympathetic drive. Protein kinase A phosphorylates Rad, a protein that inhibits the L-type channel, relieving the inhibition so more calcium enters. It phosphorylates phospholamban, releasing its brake on SERCA so the SR holds more, and troponin I, which speeds relaxation. See cAMP and PKA and, for the loop, the cardiac cycle. Mutations in RyR2 itself cause an inherited arrhythmia, catecholaminergic polymorphic ventricular tachycardia: Priori and colleagues (2001) found them in four of twelve probands.
Pacemaker cells have no resting potential
A sinoatrial (SA) node cell never rests. Picture its trace: after each action potential the voltage falls to a maximal diastolic potential, the most negative point of the cycle, then drifts upward in phase 4 diastolic depolarisation until it reaches threshold and fires. L-type calcium channels carry its slow upstroke, and there is no plateau.
Two clocks drive the drift. The best-known part of the membrane clock is the funny current (If), carried mainly by HCN4 channels. It is activated by hyperpolarisation and carries both sodium and potassium, a net inward current at diastolic voltages. How far If is activated at the end of each action potential helps set the steepness of phase 4 and so the rate. The calcium clock is a series of local calcium releases from the sarcoplasmic reticulum (SR) in late diastole, which add inward current through the sodium-calcium exchanger. In the coupled-clock model, built mostly from rabbit cells, the two clocks entrain each other. Other currents also contribute, including a low-threshold L-type calcium current (Cav1.3) and the decay of potassium current left from the action potential. How much each contributes is still debated.
Autonomic nerves act on both clocks. Noradrenaline at beta-adrenergic receptors raises cyclic AMP. Cyclic AMP binds HCN4 directly and increases If, and through protein kinase A (PKA) it increases L-type calcium current and SR calcium cycling; both steepen phase 4. Acetylcholine at muscarinic M2 receptors lowers cyclic AMP and If. It also opens a G-protein-gated potassium channel. By the balance-point rule, more potassium conductance pulls the balance point toward EK, so the maximal diastolic potential becomes more negative and the ramp has farther to climb (GPCRs and G proteins; reflex control is in regulating arterial pressure).
A simple description of the timing shows why a steeper ramp means a faster heart: one beat is the ramp’s climb to threshold plus the action potential itself.
In words Cycle length equals the voltage gap the ramp must climb, divided by how fast it climbs, plus the length of the action potential.
- cycle length“cycle length”
- time from one beat to the next. Heart rate per minute = 60,000 ms / cycle length in ms.ms
- threshold“threshold”
- the voltage at which the upstroke firesmV
- maximal diastolic potential“maximal diastolic potential”
- the most negative point of the cycle, where the ramp startsmV
- slope of phase 4“slope of phase 4”
- how fast the diastolic ramp climbsmV per ms
- action potential duration“action potential duration”
- how long the action potential itself lastsms
Sanity check Units: mV divided by mV per ms leaves ms, so the first part is a time, and it adds to another time. If the ramp is flat (slope zero), the cell never reaches threshold and does not fire. A steeper ramp shortens only the climb; the action potential still takes its own time.
Try one number
A made-up example: a ramp from −60 to −40 mV at 0.05 mV per ms.
Climb: (−40 − (−60)) / 0.05 = 20 / 0.05 = 400 ms. Add a 200 ms action potential: the cycle is 600 ms, and 60,000 / 600 = 100 per min.
Double the slope to 0.10 mV per ms: the climb is 20 / 0.10 = 200 ms, the cycle 400 ms, and the rate 60,000 / 400 = 150 per min.
Need a refresher? units and prefixes · rates and “per”
In normal sinus rhythm, with every beat conducted, each firing of the SA node becomes one beat on an electrocardiogram (ECG), so the distance between beats on the paper, the R-R interval (or the P-P interval), is the cycle length.
- diastolic ramp (phase 4)
- action potential (shape and height schematic)
- threshold
- maximal diastolic potential (MDP)
- ECG (schematic P, QRS and T)
- the lesson’s made-up example (cycle 600 ms)
For much of the time the pacemaker cell’s voltage is climbing, the ECG is flat: the node is too small for its boundary to show at the skin. The trace moves only when the wave spreads across the atria (P) and the ventricles (QRS, and T, which comes later and can fall early in the next climb).
- Values used in the rule
- Ramp time = (threshold − MDP) / slope
- Action potential duration (fixed in this sketch)
- 200 ms
- Cycle length = ramp time + action potential
- Rate = 60,000 ms per min / cycle length
- R-R on paper at 25 mm per s (1 small square = 0.04 s, 1 large = 0.20 s)
- Check from the paper: 1,500 / small squares, 300 / large squares
Hutter and Trautwein’s numbers are frog values: they recorded from sinus venosus fibres of the isolated frog heart, where vagal stimulation moved the mean maximal diastolic potential from about −55 to −65 mV (largest shift 23 mV) and suppressed the ramp, and sympathetic stimulation steepened the ramp with the threshold unchanged. They are not mammalian sinoatrial values, and the sliders here are not fitted to them.
Illustrative sketch, not an ionic model and not a measurement. In this sketch (made up for the sketch unless the lesson gives it): one pacemaker cell; the lesson’s simple description, cycle length = (threshold − maximal diastolic potential) / slope of phase 4 + action potential duration, with a straight ramp; a fixed 200 ms action potential (the lesson’s), and the lesson’s made-up example of −60 mV, −40 mV and 0.05 mV per ms, are the lesson’s; the sympathetic doubling of the slope is the lesson’s made-up doubling, but the vagal factor 0.8, the 10 mV shift and all slider ranges are invented; threshold is taken as unchanged by autonomic input (as Hutter and Trautwein found for sympathetic stimulation in the frog; the lesson does not say for vagal); the spike’s height and shape are drawn schematically; the ECG row’s P, QRS and T shapes, the 160 ms from firing to the QRS (inside the lesson’s 0.12 to 0.20 s PR interval) and the T wave’s timing are made up, with no amplitude axis; the window starts at the end of an action potential; every firing gives one beat of a regular rhythm, so R-R equals the cycle length.
Rule to keep: cycle length = (threshold − maximal diastolic potential) / slope of phase 4 + action potential duration, and rate = 60,000 ms per min / cycle length; a steeper ramp shortens the cycle, a more negative maximal diastolic potential or a less negative threshold lengthens it.
Is the funny current the whole pacemaker? If it were, removing it should stop the heart. Mirko Baruscotti, Dario DiFrancesco and colleagues (PNAS, 2011) deleted Hcn4 in adult mouse hearts. In the intact mice, they report, heart rate fell by about half and atrioventricular (AV) block developed, but the rhythm did not stop at once (the mice died within about five days), and beta-adrenergic stimulation still sped the isolated pacemaker cells. So If is a major part of the membrane clock, and these data do not show that it is the whole pacemaker. Another adult knockout gave a different picture (Going deeper), and a mouse heart beats several times faster than a human’s.
The wave spreads, pauses at the AV node, then races
From the sinoatrial (SA) node, excitation crosses the atria to the atrioventricular (AV) node, normally the only electrical path into the ventricles. It pauses there, then runs quickly through the bundle of His, the bundle branches and the Purkinje fibres.
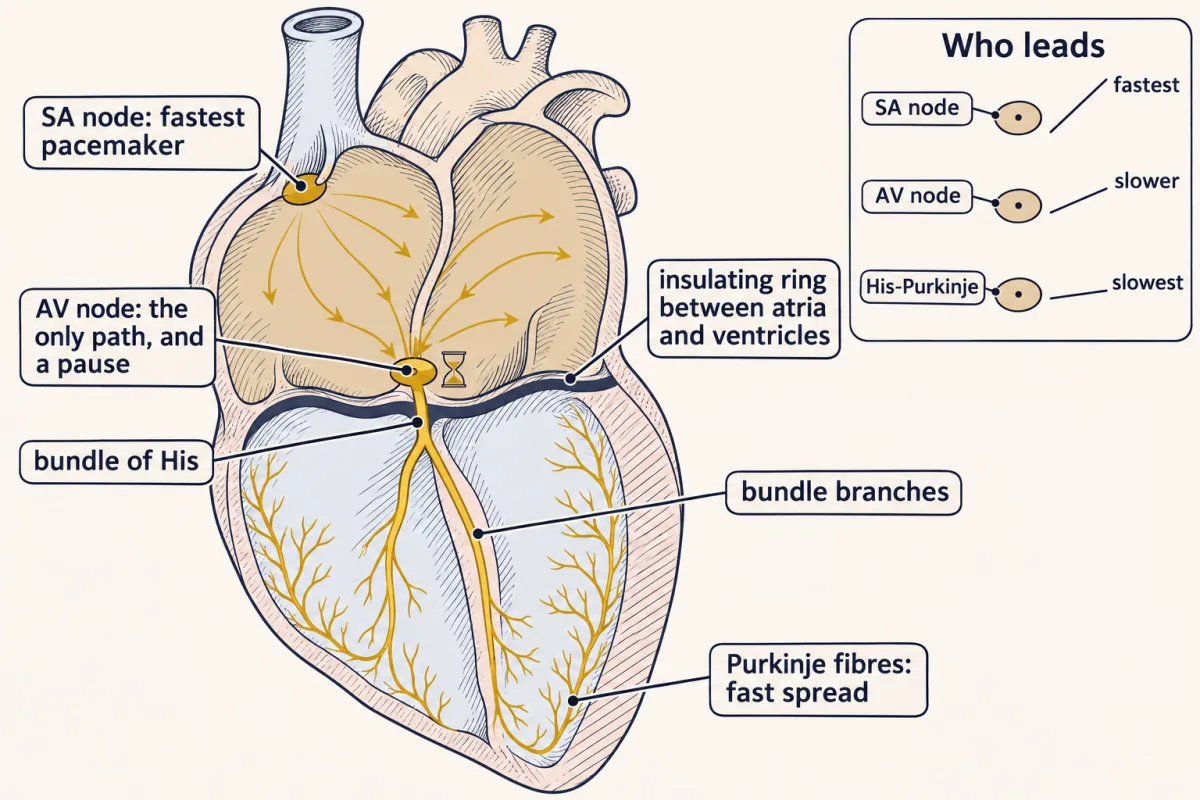
Cells of the AV node and the conducting system below it can also pace, at slower intrinsic rates. The SA node is fastest; in a standard textbook account, AV node cells fire about 40 to 60 per min and His-Purkinje cells about 15 to 40. The fastest site leads: its wave reaches each slower site and fires it before that site’s own ramp gets to threshold. The resting sinus rate is usually below the node’s intrinsic rate because vagal tone slows it.
What the ECG records: cells that disagree
An electrode on the chest sits centimetres from the nearest heart cell. It cannot record any one cell’s action potential, and it records electrical activity, not contraction. What reaches it is current flowing through the fluid around the cells, and that current flows only where neighbouring cells sit at different voltages.
Picture a strip of ventricular muscle with a wave of excitation halfway along it. Behind the wave the cells have fired and sit on their plateau. Ahead of it they are still at rest, near −90 mV. At the boundary, positive charge flows through gap junctions from the excited cells into the resting ones; that is the current that brings the next cells to threshold and moves the wave on. The circuit closes through the fluid outside the cells, where the resting side of the boundary is positive and the excited side negative. So the boundary acts like a small battery lying in the tissue, positive end forward, travelling with the wave.
That is the reason behind the one idea at the top of the lesson: the skin sees these travelling batteries, never the cells’ voltages themselves. It also shows why “the electrocardiogram (ECG) is all the action potentials added up” is wrong: that sum stays high right through the plateau, where the real trace is flat.
Predict. A lead’s positive electrode is on the left leg, below the heart. During ventricular depolarisation the main front travels down and to the left, toward the apex. Does the QRS in this lead point up or down?
Check your prediction
Up. The front is coming toward the electrode, so the electrode faces its positive, resting side. This lead is lead II, and in most healthy people its QRS is mostly upright.
Now read one beat, left to right.
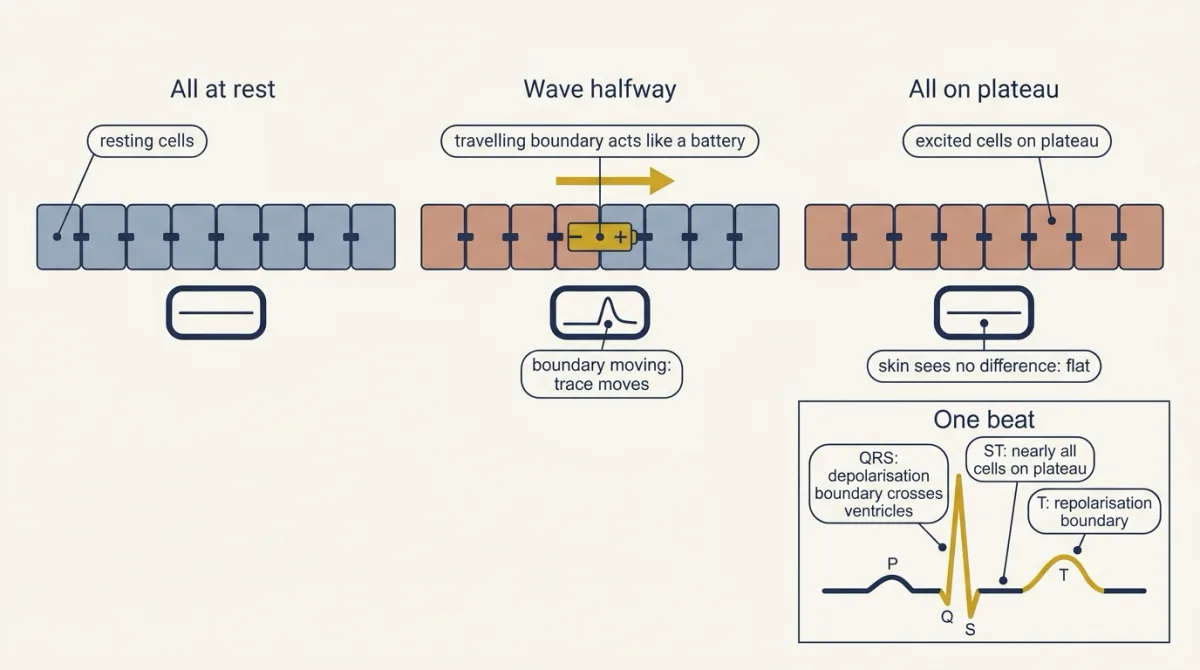
- Before the P wave, every cell is at rest. Flat.
- The P wave is depolarisation spreading across the atria from the sinoatrial (SA) node, down and to the left. It is upright in lead II.
- The PR segment, between P and QRS, is nearly flat although the atrioventricular (AV) delay is happening. The atria are depolarised (their repolarisation is just beginning and is small), and the wave is crawling through the AV node and the bundle of His, structures too small for their boundary to register at the skin. So the PR interval, from the start of P to the start of QRS, contains the AV delay. In healthy adults at rest it typically runs 0.12 to 0.20 s.
- The QRS complex is depolarisation crossing the ventricles through the fast Purkinje network, in under 0.12 s in healthy adults. Its width is how long the crossing takes, so anything that slows ventricular conduction widens it. Atrial repolarisation happens now, hidden by the much larger QRS.
- The ST segment comes when nearly every ventricular cell is on its plateau. Flat, or nearly: the opening puzzle, answered.
- The T wave comes from phase 3 happening at different times in different regions: a broad, slow repolarisation boundary, set by when each region was excited and how long its action potential lasts.
- The QT interval, from the start of QRS to the end of T, runs from the first ventricular cell’s phase 0 to the last cell’s phase 3. So it tracks the ventricular action potential duration, and anything that lengthens the plateau lengthens QT.
Predict. Suppose every ventricular cell had the same action potential duration. Then the cells excited first would also finish first, and repolarisation would sweep the same way depolarisation did. Would the T wave point the same way as the QRS, or the opposite way?
Check your prediction
The opposite way. A repolarisation boundary is the depolarisation battery turned round: its resting side is now behind it. Travelling the same way as the QRS front, it would show the electrode its negative side. Yet in most leads of a healthy ECG the T wave points the same way as the QRS. So, on balance, repolarisation must run the opposite way to depolarisation: the regions excited last finish first, because their action potentials are shorter. The textbook account puts that gradient across the wall, with the outer layer (the epicardium) finishing first. Mapping studies find the gradient across the wall small and larger ones along other axes, so which gradients matter most is still debated (numbers in Going deeper).
Leads, and why two leads give a direction
Willem Einthoven set out the first three leads as the sides of a triangle. Each of these three leads is one voltage difference between two electrodes. Lead I is left arm minus right arm, lead II is left leg minus right arm, and lead III is left leg minus left arm. Seen from the front, each lead looks along one side of the triangle toward its positive electrode. Because left leg minus right arm equals (left arm minus right arm) plus (left leg minus left arm), lead II always equals lead I plus lead III. This is Einthoven’s law, a check you can run on any tracing.
A lead also cares about direction: a boundary travelling straight toward its positive end gives the largest upward deflection, one at right angles gives none, and in between the size scales with the cosine of the angle. In a real QRS the front’s direction rotates; when its average direction is at right angles to a lead, the up and down parts cancel and the complex is called isoelectric.
In words A lead's deflection equals the size of the net front times the cosine of the angle between the front's direction and the lead's direction.
- deflection“deflection”
- the net height of the wave in that lead: positive is upwardmV
- size of the net front“size of the net front”
- how strong the heart's combined travelling boundary is at that moment, set mostly by how much tissue it spansmV
- angle between front and lead“angle”
- the angle between the direction the front travels and the direction from the lead's negative to its positive electrodedegrees
Sanity check At 0 degrees cos is 1, the full size and upward. At 90 degrees cos is 0, so the lead is isoelectric. At 180 degrees cos is −1, the full size but downward: the front is travelling away from the positive electrode.
Try one number
A made-up net front of size 1 travels at +60 degrees.
Lead II looks along +60 degrees: cos 0 = 1, so the deflection is 1. Lead I looks along 0 degrees: cos 60 = 0.5. Lead III looks along +120 degrees: cos 60 = 0.5.
Check with Einthoven’s law: I + III = 0.5 + 0.5 = 1 = II.
Need a refresher? rates and “per”
Three more leads fill the gaps. The augmented leads, aVR, aVL and aVF, each compare one limb electrode with the average of the other two. Together the six limb leads give six lines through the heart spaced 30 degrees apart, the hexaxial system. Angles are measured from the patient’s left, with positive angles pointing down: lead I at 0 degrees, aVL at −30, II at +60, aVF at +90, III at +120 and aVR at −150. The mean QRS axis is the average direction of ventricular depolarisation in this front-facing (frontal) plane.
AV block on the tracing
- First-degree block: every P wave conducts, after a longer delay.
- Mobitz I (Wenckebach): the PR lengthens beat by beat until one P wave has no QRS after it, then the cycle restarts. Each atrial impulse reaches the atrioventricular (AV) node earlier in the node’s recovery from the last one, so it is conducted more slowly and the PR lengthens. Eventually an impulse arrives while the node is still refractory and fails. The pause lets the node recover. The same rate dependence shows in perfused rabbit hearts, where the delay where atrium meets node grew with rapid atrial pacing.
- Mobitz II: the PR stays constant and a P wave suddenly fails, usually from block below the node.
- Third-degree block: no P wave conducts, and a slower escape pacemaker, from the hierarchy of rates described earlier, drives the ventricles.
First-degree and Mobitz I block can be found in healthy endurance athletes and are usually attributed to high vagal tone.
Worked problem: reading one tracing
Illustrative numbers, adult human resting electrocardiogram (ECG) at 25 mm per s: 1 small square = 1 mm = 0.04 s; 1 large square = 5 mm = 0.20 s. Assume a regular rhythm.
- Rate. R-R = 4 large squares = 0.80 s. Rate = 60 s per min / 0.80 s = 75 per min (check: 300 / 4 = 75).
- Intervals. PR = 4 small squares = 0.16 s; QRS = 2 small squares = 0.08 s.
- QT corrected for rate. QT = 9 small squares = 0.36 s. QT shortens as rate rises, so it is corrected to a 1 s cycle. Two formulas do this; they differ only in which root of RR they divide by:
In words QT c equals QT divided by the square root of R R (Bazett), or by the cube root of R R (Fridericia).
- QTc“Q T c, corrected QT”
- the QT interval corrected for rates
- QT“Q T”
- the measured QT interval, from the start of QRS to the end of the T waves
- RR“R R”
- the R-R interval, one cardiac cycle. It must be in seconds for these formulas.s
Sanity check At RR = 1 s both roots equal 1, so QTc = QT: no correction at 60 per min. At faster rates RR is below 1 s, its root is below 1, and dividing by it makes QTc larger than QT.
Try one number
What the roots mean, for RR = 0.80 s. The square root of 0.80 is the number that times itself gives 0.80: 0.894 × 0.894 = 0.80 (0.799 before rounding). The cube root is the number that, used three times, gives 0.80: 0.928 × 0.928 × 0.928 = 0.80 (0.799 before rounding).
A calculator gives both (on many, the cube root is RR1/3).
Need a refresher? powers and roots
Bazett: 0.36 / 0.894 = 0.40 s. Fridericia: 0.36 / 0.928 = 0.39 s.
- Axis. Net QRS is positive in I and aVF, so the axis lies between 0 and +90 degrees. QRS is isoelectric in aVL, at −30 degrees, so the axis is at right angles to it: −30 + 90 = +60 or −30 − 90 = −120 degrees; the quadrant picks +60. Check: lead II, which looks along +60 degrees, should show the largest positive QRS, and lead I plus lead III should equal it.
Answer: 75 per min, PR 0.16 s, QRS 0.08 s, QTc 0.40 s (Bazett) or 0.39 s (Fridericia), axis about +60 degrees.
The two corrections agree here but drift apart as rate rises. At 120 per min (R-R 0.50 s) with QT 0.30 s: Bazett 0.30 / 0.707 = 0.42 s; Fridericia 0.30 / 0.794 = 0.38 s. Bazett’s is widely described as overcorrecting at fast rates; his 1920 formula came from a small group of healthy people.
Potassium moves the resting potential and reshapes the ECG
Because IK1 dominates the resting ventricular membrane, the resting potential follows EK, so compute EK. The Nernst equation (membrane transport) does this; at 37 C it gives 61.5 mV per tenfold ratio. With intracellular potassium at 140 mmol per L:
In words E sub K equals 61.5 millivolts times the base-10 log of outside potassium over inside potassium.
- EK“E sub K”
- the potassium equilibrium potential: the voltage at which potassium has no net push in or outmV
- log10“log ten”
- the base-10 logarithm: how many factors of ten the ratio is. log10(10) = 1, log10(1) = 0, log10(0.1) = −1.
- [K]outside“K outside”
- extracellular potassium concentrationmmol per L
- [K]inside“K inside”
- intracellular potassium concentration, here 140mmol per L
Sanity check If outside equals inside, the ratio is 1, its log is 0, and EK = 0 mV. Each tenfold fall in the ratio makes EK 61.5 mV more negative. A rise in outside potassium shrinks the gap between the two concentrations, so EK moves toward zero.
Try one number
At 4 mmol per L outside: the ratio is 4 / 140 = 0.0286, and log10(0.0286) = −1.544 (between one and two factors of ten below 1: 0.1 would give −1, 0.01 would give −2). EK = 61.5 × (−1.544) = −95 mV.
At 7 mmol per L: 7 / 140 = 0.05, log10(0.05) = −1.301. EK = 61.5 × (−1.301) = −80 mV.
Need a refresher? log scales · rates and “per”
So raising outside potassium from 4 to 7 mmol per L moves EK from −95 to −80 mV, and the resting potential approximately with it.
Now the tracing. In simple models, more potassium outside also raises potassium conductance, so phase 3 is faster and steeper, and the action potential shortens. Two regions that start phase 3 a few milliseconds apart then differ by more millivolts at any instant, because each is falling more steeply, and they differ for a shorter time. By the same logic, that gives a taller, narrower T wave: tall, peaked T waves are the classic early electrocardiogram (ECG) change. A modest depolarisation brings cells nearer threshold, so conduction may first speed. With larger rises, more sodium channels sit inactivated, so phase 0 slows and conduction slows; propagation fails only far higher. Slower conduction widens the QRS, since its width is the crossing time, and the P wave broadens and flattens for the same reason.
In people, the potassium level at which these ECG changes appear varies widely, and their sequence comes mainly from models, isolated hearts and animal preparations. Low extracellular potassium does the reverse to duration, lengthening the action potential by reducing outward current through potassium channels and the sodium-potassium pump. Regulation of plasma potassium is in water, sodium and potassium.
Design problem
Hutter and Trautwein (Journal of General Physiology, 1956) recorded with intracellular microelectrodes from the isolated, beating frog heart while stimulating its nerves. Vagal stimulation stops the beat. Does the vagus (A) make the pacemaker membrane more negative, (B) stop the ramp at the same diastolic potential, or (C) block spread of excitation out of the pacemaker? Which recordings tell these apart, what is the control tissue, and what would sympathetic stimulation do?
Saved in this browser only.
One way to do it
Record maximal diastolic potential and ramp slope in sinus venosus fibres (the frog’s pacemaker region) during vagal stimulation. A predicts a more negative diastolic potential; B the same potential with a flat ramp; C normal pacemaker activity with a silent atrium. As control, record auricle fibres, which have a stable diastolic potential, to ask whether any hyperpolarisation is general.
Their data: in 28 experiments the sinus fibres’ mean maximal diastolic potential went from about −55 to −65.4 mV (largest shift 23 mV), the ramp was suppressed, and auricle fibres did not change. Hypothesis A fits. Sympathetic stimulation steepened the pacemaker potential with threshold unchanged.
Ruled in: both autonomic limbs act directly on the pacemaker potential. Not shown: which ion carries the change, or how a mammalian SA node behaves; mammalian atrial muscle, unlike this frog auricle, does respond to acetylcholine. Extensions: vary external potassium to test the permeability idea, or block muscarinic receptors (Loewi’s frog hearts are in transmitter systems).
Going deeper
Plateau numbers and disagreements
Sources differ on the peak of phase 0: one review gives about +30 mV, another an overshoot of +40 to +60 mV with a maximum rate of rise near 400 V per s. In Beeler and Reuter’s experiments the slow inward current’s threshold was near −35 mV in Tyrode solution, and its inactivation time constants ran from 40 to 700 ms between −35 and +50 mV. Their work did not show the channel protein (later Cav1.2) or anything about human cells, and voltage in a multicellular strip is never perfectly uniform. Nor was this the first cardiac calcium current: Reuter had reported a calcium-dependent slow inward current in Purkinje fibres in 1967.
The HCN4 knockouts in detail
Hcn4-mutant mouse embryos lost about 85 percent of If (Stieber and colleagues, 2003) but died, which is why the 2011 study used a tamoxifen-inducible, cardiac-specific system in adults. In its isolated SA node myocytes, If fell by about 70 percent and spontaneous rate by about 60 percent, and the residual If still responded to beta-adrenergic stimulation. An earlier adult knockout (Herrmann and colleagues, EMBO Journal, 2007) also removed most sinoatrial If but gave recurrent sinus pauses, with no slowing of baseline rate and normal acceleration under sympathetic stimulation, so the phenotype differs between models. In humans, Schulze-Bahr and colleagues (2003) found a heterozygous HCN4 deletion (1631delC) in one person with sinus node dysfunction; in COS-7 cells the mutant gave If-like currents insensitive to cyclic AMP.
Numbers from animal hearts
In the perfused rabbit hearts, optical mapping found a step delay of more than 40 ms at the junction of atrium and node; refractory periods were about 81 ms in atrium, 90 ms in atrioventricular (AV) node and 185 ms in His bundle. For the T wave: in isolated cells and some cut wedge preparations, mid-wall (M) cells have the longest action potentials, then endocardial, then epicardial, but whether this ordering holds in the intact, well-coupled heart is debated. In nine perfused pig hearts repolarisation differed by only about 14 ms across the wall, against 66 ms from left to right and 51 ms from apex to base.
Why the T wave peaks in hyperkalaemia
A 2017 review (Weiss, Qu and Shivkumar) explains the peaked T wave by global shortening of the action potential, which makes repolarisation more synchronous across the wall and narrows the T wave. Synchrony alone would lower the T wave, so its height probably comes mainly from the steeper phase 3; which effect dominates in people is not settled.
Your notes
Select any text in the lesson to highlight it or add a note to it. Your highlights and notes are saved in this browser and collected in your notebook.
This browser is not letting the site save anything (a private window or strict privacy settings), so highlights and notes will be lost when you leave the page.
How we measure it
Voltage clamp of cardiac preparations
Hold the membrane at a chosen voltage with a feedback amplifier and record the current needed to keep it there. Changing the voltage protocol, the bath ions or a blocker such as tetrodotoxin separates one current from another, as Beeler and Reuter did in dog ventricle. In multicellular strips the voltage is not perfectly uniform, which limits precision.
Intracellular microelectrode recording
Push a fine glass pipette filled with salt solution into a single cell and record its membrane potential through each beat. It shows the shape of the action potential, the maximal diastolic potential and the slope of the pacemaker ramp, and how nerve stimulation changes them.
Electrocardiography
Record voltage differences between electrodes on the skin as excitation spreads through the heart, on paper moving at a standard speed. The tracing reflects voltage differences between groups of cells, so it moves only while excitation or recovery is spreading; its timing gives rate and conduction intervals, and the size and polarity of QRS across the limb leads give the mean electrical axis.
Inducible tissue-specific knockout mice
Flank a gene with recombination sites and delete it only in one tissue, and only when a drug such as tamoxifen is given. This avoids embryonic death and tests what the gene does in the adult, as in the cardiac Hcn4 knockout.
Practice questions on this lesson (5) → MCAT-style, original, each with an explanation
Where this lesson fits
Before thisReview first
- Skeletal Muscle: Length, Load and SpeedThis course · Lesson 3
You need its twitch and tetanus summation to see why a long refractory period stops the heart from tetanising.
After thisStudy next
- The Cardiac Cycle and Pressure-Volume LoopsThis course · Lesson 6
It takes the calcium-driven contraction and relaxation from here and follows them through the pressure and volume of one beat.
- Cardiac Output and Venous ReturnThis course · Lesson 7
Heart rate and contractility, set here by pacemaker slope and PKA, become the heart side of cardiac output.
- Regulating Arterial PressureThis course · Lesson 10
Sympathetic and vagal control of the pacemaker and contractility here is the heart's part in reflex pressure control.
Elsewhere on the siteFilms, simulations and method films in other courses
- Patch clampMethod film
The plateau and funny currents are separated by recording currents through channels with a clamped voltage.
- Run the 1952 equationsSimulation · Neuroscience
Running the squid axon equations shows how sodium and potassium currents shape a spike, the base for the cardiac versions.
- Nernst calculatorSimulation · Cell Signaling
The Nernst calculator helps predict how raised potassium shifts the resting potential.
Suggested by an AI model from the lessons themselves, then checked. How we use AI
Finish line
Test yourself
11 questions
Practice and MCAT-style, with explained answers.
Next · Lesson 6
The Cardiac Cycle and Pressure-Volume Loops
Plot ventricular pressure against volume and every heartbeat draws a loop. Which corner moves when the arteries tighten?
Continue →