Sensory Systems · Unit 7: Smell and taste
Taste from Tongue to Cortex
Rewritten on : new text, flashcards and film. Your notes and highlights stay, but the text around them may have moved.
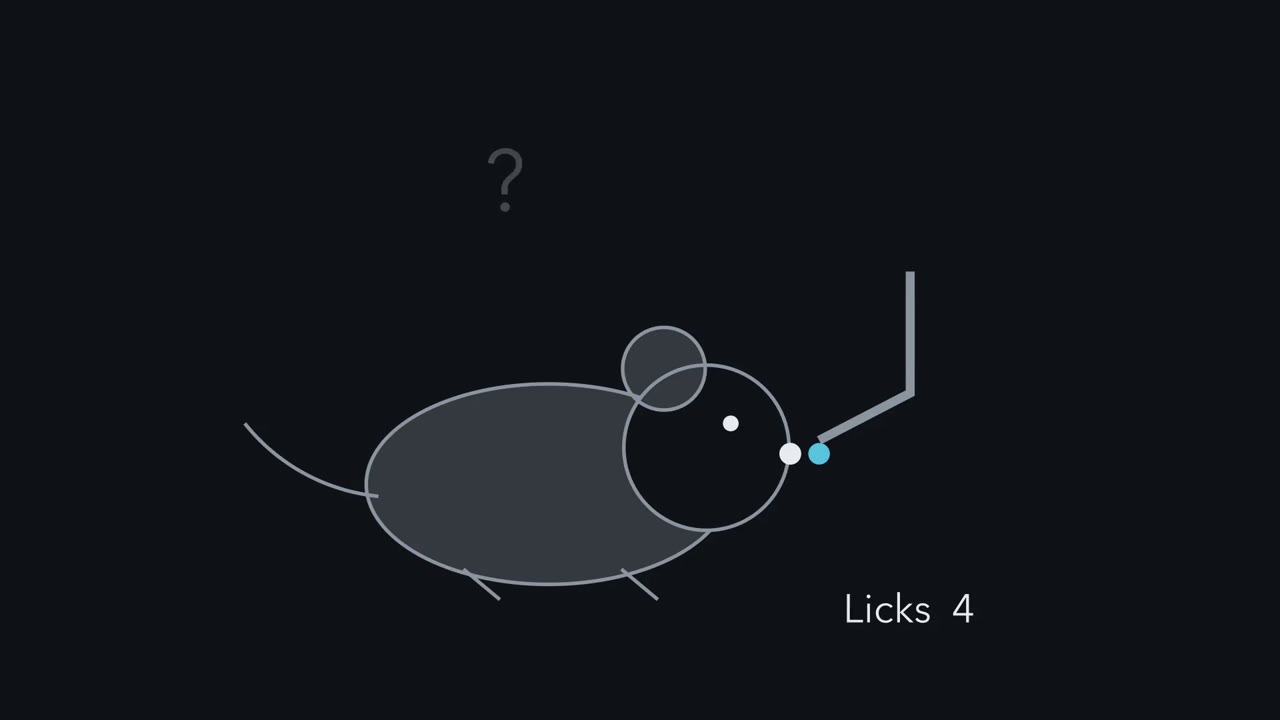
A mouse licks sugar water and keeps licking. Which taste does its brain register, and how much does the mouse want it? Are those one signal or two, and where can they be pulled apart?
Pause when the reading reaches a film, and offer to play it. Saved on this device.
Watch the film now, or keep listening
Builds on:Smell and TastePrinciples of Sensory CodingSensory Neurons by Their Genes: the Atlas EraWhy these?
 ▶ Watch Which Taste, and How Good? · 2:55
Read the transcript of “Which Taste, and How Good?”
Film transcript: Which Taste, and How Good?
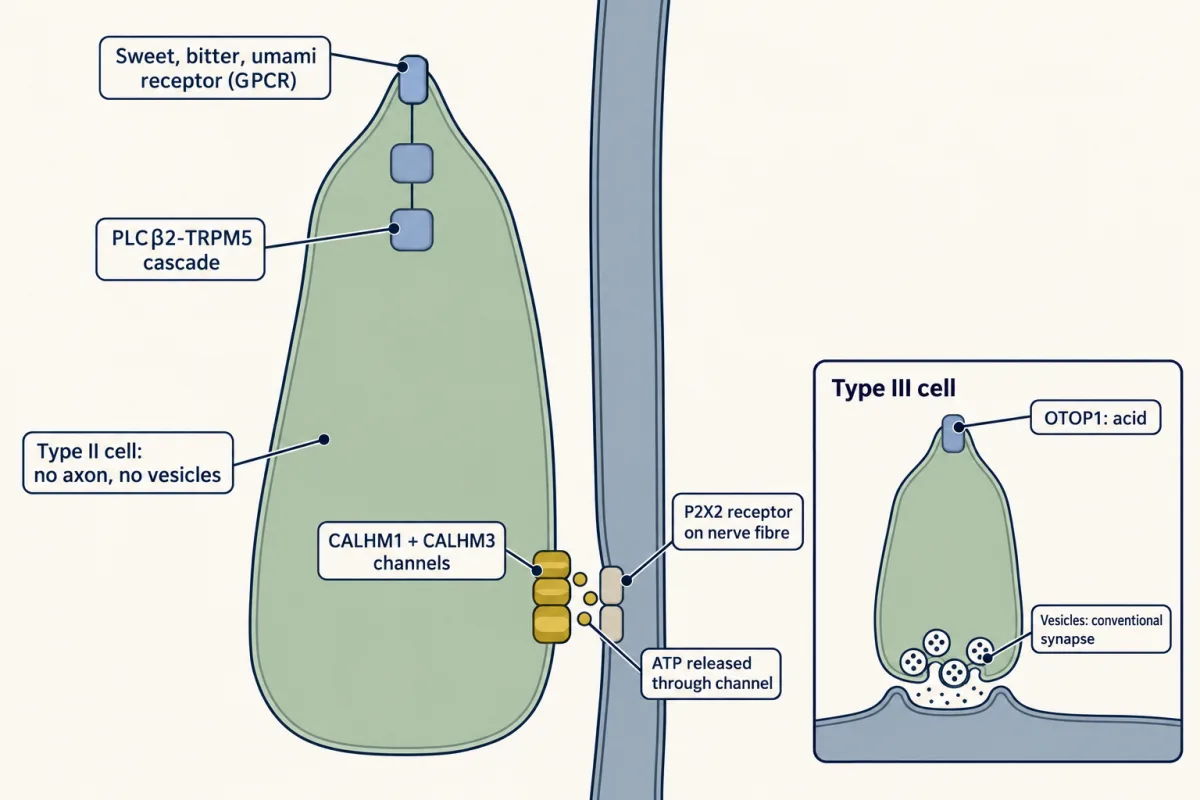
A mouse licks sugar water and keeps licking. What has its brain just worked out? Two questions hide in that licking. Which taste does its brain register? And how much does the mouse want it? Are those one signal or two? And where can they be pulled apart? Call the first one identity: which taste it is. Call the second one value: whether the animal is drawn to it or turns away, and how strongly. Its good-or-bad sign is called valence. Taste cells are not neurons. They must hand their news to a fibre. In mice, type II cells include populations that respond mainly to sweet, to bitter or to umami. Some cells respond to more than one. Type III cells sense acid.
They make conventional synapses onto the fibre. Type II cells have no conventional vesicular synapse. They release ATP through a channel. On its own, the main channel subunit opens slowly in cultured cells. Its time constant is over half a second. A type II cell's spike is brief. Can a gate that slow keep up?
Barely. Adding a partner subunit speeds opening to about ten milliseconds. These are cultured-cell times, not delays in a living mouse. in mice lacking that partner, taste buds released no ATP in response to tastes. Fibres from the front of the tongue have their cell bodies in the geniculate ganglion. In rodents, signals then climb through brainstem relays and the thalamus to taste cortex, and on to the amygdala. The experiments here sample three stations: the ganglion, the cortex and the amygdala. Here is the one idea. In the mouse, identity begins with which taste-cell population is driven. Many fibres pass that on selectively at low strength, and more broadly at high strength. Not all of them broaden.
Drive the sweet field of taste cortex, and a mouse is drawn in. Block that field, and trained mice struggle to recognize sweet. Drive the bitter field, and it turns away. Then one manipulation pulled those two readouts apart. Silence the amygdala, and mice still recognize sweet. But driving sweet cortex no longer draws them in. And the pull changes with what the body needs. The experiments here are in mice. None of this is a human map. Which taste, and how good: one cortical field bears on both, and silencing the amygdala separates them in these mouse assays.
From the film
- In the mouse, identity (which taste) and value (how much the animal wants it) are two readouts that can be pulled apart.
- In mice, type II taste cells release ATP through channels instead of a conventional vesicular synapse.
- In mice, silencing the amygdala leaves recognition of sweet intact but removes the attraction produced by driving sweet cortex.
- Value also changes with what the body needs.
A mouse licks a drop of sugar water and keeps licking. Two questions hide in that licking. Which taste does its brain register? And how much does the mouse want it? Are those one signal or two, and where along the path from tongue to cortex can they be pulled apart?
The lesson names the two and keeps the names throughout.
- Identity is which taste it is: sweet, bitter, sour, salty or umami. In a mouse you measure it with a trained recognition task, in which the animal must report which taste it got.
- Value is how much the animal wants it: attraction toward a taste or aversion from it, read out as approach, avoidance or licking. Some of it is innate, and it changes with need and learning. Papers often call its good-or-bad sign valence.
Smell and taste gave you the cells and receptors, and sensory coding gave you the labelled-line and population ideas. This lesson starts where they stop: at the synapse between taste cell and fibre, the fibre itself and the stations that follow. The stations in bold are the ones the experiments below record from or manipulate.
| Station | What it is |
|---|---|
| Taste bud | Taste cells, which are not neurons, and the fibre endings they signal to |
| Geniculate ganglion | Cell bodies of the facial-nerve fibres from the front of the tongue and the palate. Fibres from the back of the tongue and the throat travel in the glossopharyngeal and vagus nerves |
| Rostral nucleus of the solitary tract | The first brainstem station, where all of these fibres end |
| Parabrachial nucleus | The next relay in rodents, which also projects to the amygdala and hypothalamus, so the route branches; in primates the solitary nucleus projects to the thalamus directly |
| Gustatory thalamus (VPMpc) | The thalamic taste relay |
| Insular cortex | Taste cortex |
| Amygdala | A target of taste cortex |
The unmarked relays are not tested here. Everything below is a mouse result unless it says otherwise, and none of it is a human map.
Where identity starts: two cell types, two synapses
A taste cell detects a chemical, but it is not a neuron, so it must hand its news to a fibre. In mice, separate populations of taste cells respond mainly to sweet, to bitter, to umami or to sour: the sweet cells, the bitter cells and so on. The separation is predominant, not absolute: some mouse taste cells respond to both sweet and umami (Kusuhara and colleagues, 2013). Most belong to two main cell types, which hand on their news in different ways.
| Quality | Cell type | How it detects | How it signals to the fibre |
|---|---|---|---|
| Sweet, bitter, umami (predominantly selective populations, with some overlap) | Type II | G-protein-coupled receptors, then an enzyme and a channel (the PLCβ2-TRPM5 cascade) | releases ATP through CALHM1/3 channels, which are large-pore channels; no conventional vesicular synapse |
| Sour (acid) | Type III, the acid-sensing cells, marked by the protein PKD2L1 | acid acts through OTOP1, a proton channel | conventional vesicular synapse; can also release serotonin |
| Sodium (the amiloride-sensitive part, which the drug amiloride blocks) | amiloride-sensitive sodium cells | not covered here | releases ATP through CALHM1/3 channels |
Keep the PKD2L1 marker in mind. The key fibre experiment below silences the cells that carry it.
The one idea to carry through this lesson. In the mouse, a taste’s identity begins with which taste-cell population is driven, and fibres pass that population’s activity on: many look selective at low strength and broader at high strength. At a cortical taste field the two readouts come bundled, like one package: the sweet field is needed to recognize sweet, and driving it draws a mouse in. Silencing the amygdala opens the package: a mouse still recognizes sweet after the attraction that driving sweet cortex produces is gone. And value changes with what the body needs.
The idea covers mouse data from the geniculate ganglion to the amygdala, with identity and value measured as defined above; the cortex and amygdala experiments used sweet and bitter. The package is two behavioural readouts that one manipulation separates in those assays. It does not trace a joint signal through the earlier stations, which branch from the parabrachial nucleus on, mark where the two first separate or where value is first computed, or say that value is assigned only in the amygdala. Brainstem circuits support innate acceptance and rejection on their own: decerebrate rats, whose forebrain is disconnected, still accept sweet and reject bitter in taste-reactivity tests, which score mouth and face movements (Grill and Norgren, 1978). Value is also shaped by learning, as in a conditioned taste aversion, the avoidance of a taste once paired with sickness. The idea does not cover human perception, or flavour, which also depends on smell, and it does not settle whether cortex holds a map of qualities.
A synapse made of a channel
The type II receptor cascade in the table is covered in PLC, IP3, DAG and PKC, G proteins and calcium signalling. With no conventional vesicular synapse, the depolarized cell releases ATP through a channel onto fibres that carry the ATP receptor P2X2.
Taruno and colleagues (Nature, 2013) found that CALHM1 is required for taste-evoked ATP release from mouse type II cells, using Calhm1 knockout mice, isolated cells and taste tissue, nerve recordings and behaviour. Sour and salty taste recognition was mostly normal in the assays they tested. For sour, that fits the vesicular synapse of type III cells, described below. It does not mean that salt signalling avoids CALHM channels: Nomura and colleagues (Neuron, 2020) reported that the amiloride-sensitive sodium cells also release through CALHM1/3, and that deleting Calhm3 abolished the amiloride-sensitive sodium component of nerve responses.
A puzzle remained: CALHM1 alone is slow. In mouse N2a neuroblastoma cells recorded by whole-cell voltage clamp, CALHM1 alone activated with a time constant above 500 ms. A time constant is the time a gate takes to get about 63 percent of the way to its steady-state opening. Type II cells fire brief action potentials.
Predict. Treat the gate as a simple first-order process during a constant voltage step, which is an illustration, not a measurement. During a depolarization lasting 5 ms, about how far does a gate with a time constant above 500 ms get? And a gate with a time constant of 10 ms?
Check your prediction
The fraction of the way to steady state reached after a time t is 1 − e−t/τ. With τ = 500 ms, 5 ms gives 1 − e−0.01, about 1 percent, and 10 ms about 2 percent; a longer τ gives less. With τ = 10 ms, 5 ms gives about 39 percent and 10 ms about 63 percent. A CALHM1-only gate would barely open during a brief spike. These numbers illustrate the logic; they are not recordings, and they do not predict how much ATP leaves per spike.
Ma and colleagues (Neuron, 2018) found the missing piece: deleting Calhm3 in mice abolished taste-evoked ATP release from taste buds. In the same N2a cells, CALHM1 coexpressed with CALHM3 activated in about 10 ms. That is a speed-up of more than fifty-fold (500 / 10), although the exact times depend on voltage and protocol. This is a property of cultured cells, not a delay measured in a living animal.
Type III cells, and why ATP at all
Type III cells are different. They make conventional synapses onto fibres, and they transduce acid through OTOP1. In Otop1 knockout mice, acid-evoked taste-nerve responses were severely attenuated, though not necessarily absent (Teng and colleagues, Current Biology, 2019). OTOP1 is not exclusive to type III cells: Kaplan and colleagues (Journal of Neuroscience, 2025), who epitope-tagged endogenous OTOP1, found it outside them, and its function in other cells is unresolved.
Why ATP at all, if type III cells have vesicles? Because, in knockout mice, ATP signalling was needed even for the qualities type III cells carry. Finger and colleagues (Science, 2005) found that mice lacking the ATP receptors P2X2 and P2X3 lost taste-nerve responses to taste stimuli, while the nerves still answered touch, temperature and menthol. Serotonin from type III cells, acting on 5-HT3 receptors, is also a significant component of the signal to mouse gustatory fibres, and pentobarbital apparently blocked that signalling, so what you see depends on the anaesthetic (Larson and colleagues, Journal of Neuroscience, 2015). Which cell supplies the ATP needed during sour signalling is, so far as these papers go, still open.
One quality per fibre, or one at a time
Read the transcript of “Narrow at Threshold, Broader with Strength”
Film transcript: Narrow at Threshold, Broader with Strength
Does each taste fibre carry one taste, or must the brain read a pattern across many fibres? If each fibre listened only to cells of one taste, it would be a labelled line. Its activity would mean one taste. In anaesthetized mice, Barretto and colleagues imaged geniculate ganglion neurons while tastants flowed over the tongue.
Most responding neurons were strongly activated by only one of the tested tastes. One class did not fit. Some neurons responded to both bitter and sour. Two ideas. Maybe the neuron gets input from both sour and bitter cells. Or it listens only to bitter cells, and acid also activates them. The authors silenced the sour cells. Under each idea, what should happen to the bitter-sour neurons?
Sour-only responses disappeared. But the bitter-sour class was still there. And when bitter responses were blocked instead, the bitter-sour class disappeared. So the authors concluded that acid drives these neurons through bitter cells. For these neurons, the fibre reports the cell, not the chemical. Now the counter-weight. Wu and colleagues compared low and higher concentrations. Tuning broadened as concentration rose. Of the neurons tested at both strengths, most became more broadly tuned at the higher one. So narrow or broad? Imaging usually calls a neuron responsive when its signal crosses a fixed threshold. Picture a neuron with a full input from its main cell type, and a weak one from a second.
Each input saturates as concentration rises. These numbers are made up, to show the logic. At low strength, does the weak input cross the threshold? And at high strength? At low strength, the main input crosses, and the weak one stays below. The neuron looks narrow. At high strength, the weak input climbs past the line. The same neuron now looks broad.
In this model, a weak input of weight 0.2 never reaches the threshold of 0.25. Whenever the main response crosses that threshold, the neuron responds to one taste in this panel only. So in the model, neurons with different weak inputs differ. Some broaden and some do not. Wu found most broadened, but not all. Those data fit the model, but they do not show which neurons have weak inputs.
If responses were counted against the neuron's own best, and all inputs rose alike, breadth would not change. So narrow depends on the panel, the concentration and the criterion. The two laboratories' results need not conflict.
From the film
- In anaesthetized mice, most responding geniculate neurons were strongly activated by only one of the tested tastes.
- For the bitter-sour class of fibre, acid drives the neuron through bitter cells, so the fibre reports the cell population and not the chemical.
- Tuning broadened as concentration rose in most neurons tested at both strengths, though not all.
- Whether a neuron looks narrow or broad depends on the panel, the concentration and the criterion for a response.
Taste cells fall mostly into one-quality populations, as the first section showed. The question now is whether the fibres keep them apart. If each fibre listened only to the cells of one quality, it would be a labelled line: activity in that fibre would mean one taste. If fibres listened to cells of several qualities, one fibre’s activity would be ambiguous, and the brain would have to read taste from the pattern across fibres or from the timing of their activity.
The first place to look is the geniculate ganglion. Barretto and colleagues (Nature, 2015) put a GRIN microendoscope (a thin lens that relays light from deep tissue) over it in anaesthetized mice. They recorded each neuron’s calcium signal, through the indicator GCaMP, while tastants flowed over the tongue. Most responding neurons were strongly activated by only one of the tested qualities. Neurons that preferred the same quality showed no obvious spatial clustering in the ganglion.
One class did not fit. Some neurons responded to both bitter and sour. That could mean two things.
- Convergence. The neuron gets input from both the sour cells and the bitter cells.
- One cell, two chemicals. The neuron listens only to bitter cells, and acid also activates bitter cells.
Predict. The authors silenced the sour cells, the ones marked by PKD2L1. In a separate test they blocked bitter responses. Under each hypothesis, what should happen to the bitter-sour neurons in each test?
Check your prediction
| Silence the sour (PKD2L1) cells | Block bitter responses | |
|---|---|---|
| If convergence | the acid response disappears, the bitter response stays, so the class disappears | the bitter response disappears, so the class disappears |
| If one cell, two chemicals | both responses stay, so the class stays | both responses disappear, so the class disappears |
| What they saw | sour-only responses disappeared, but the bitter-sour class was still there | the bitter-sour class disappeared |
The first column decides between the two ideas, provided the silencing worked: convergence predicted the loss of these neurons’ acid response, and the class survived. The second column does not separate the ideas, because both predict it; it confirms that the class depends on bitter signalling. The authors concluded that these neurons are driven by bitter-sensing cells that acid also activates, not by convergent sour input. For these bitter-sour neurons, then, the fibre reports which taste-cell population is active, not which chemical is on the tongue, and the authors read this as support for labelled lines.
Now the counter-weight. Wu, Dvoryanchikov, Pereira, Chaudhari and Roper (Nature Communications, 2015) also imaged geniculate neurons in anaesthetized mice, and compared panels of tastants at low and higher concentrations. Tuning broadened as concentration rose. Up to 69 percent of the neurons they recorded responded to more than one tastant, depending on the panel; the counts for their low and mid-range panels are in the worked problem below. Those are fractions of whole samples. A sharper test followed the same neurons: when they were tested at both concentrations, 35 of 41 became more broadly tuned at the higher one. The authors read this as a challenge to strict labelled-line coding.
So is a taste neuron narrow or broad? Both can be true, and simple arithmetic shows how. Imaging studies usually call a neuron responsive when its signal crosses a fixed threshold above the noise. Picture a neuron with a full-weight input from its main cell type and a weak input, weight 0.4, from a second cell type. Set the threshold at 0.25. Let each cell type’s activation rise and saturate with concentration, reaching 0.33 at a low concentration and 0.89 at a high one. (These numbers are made up to show the logic, not taken from the data.)
Predict. Does this neuron respond to the second taste at the low concentration? At the high one?
Check your prediction
At low strength the main input gives 1 × 0.33 = 0.33, which crosses the threshold, and the second gives 0.4 × 0.33 = 0.13, which does not. The neuron looks narrow. At high strength the second input gives 0.4 × 0.89 = 0.36, which crosses, so the same neuron now looks broad. Nothing about this neuron’s wiring changed; the stimulus did, measured against a fixed threshold.
Now give a neuron a second input of weight 0.2. That input never crosses the threshold: even at full activation it contributes only 0.2, below 0.25. Whenever the main response crosses, this model neuron looks singly responsive to the two-taste panel. So if neurons differ in how strong their weaker inputs are, some will broaden and some will not. That fits Wu and colleagues’ within-neuron result: most broadened, but not all. It is one way to get their result; the data do not show which neurons have weak inputs.
The threshold matters as much as the stimulus. Suppose a response were instead counted relative to the neuron’s own best response, and every input rose with concentration in the same way. In the example, the weak response stays 0.4 of the main one at both strengths, so breadth would not change. So “narrow” is a statement about three things: the stimulus panel, the concentration range and the criterion for calling a response. It is not a statement about the neuron alone, so the two laboratories’ results need not conflict, though what explains their differences is not settled. The wider labelled-line against population argument is in sensory coding.
Worked problem: does a broader population mean broader neurons? In the data of Wu and colleagues, 28 of 101 recorded geniculate neurons responded to more than one taste at the low concentration panel, and 79 of 155 did so at the mid-range panel; call these multiply responsive.
Step 1, fractions. Low: 28 / 101 = 0.277, or 27.7 percent. Mid-range: 79 / 155 = 0.510, or 51.0 percent.
Step 2, what the numbers cannot say. These are two sampled cohorts. The arithmetic shows that the population looked broader, not that any single neuron broadened, and neurons from a few animals are not independent replicates. Only a within-neuron comparison at low and high concentration tests that, which is the design behind Wu and colleagues’ 35 of 41.
What cortex does with a taste
Read the transcript of “Opening the Package”
Film transcript: Opening the Package
Does a taste field in cortex do anything? And can a mouse know a taste, but stop wanting it? In anaesthetized mice, one study reported separate fields for sweet, bitter, umami and sodium. Fields would matter more if they did something. Peng and colleagues made the fields respond to light, in awake mice. Light on the sweet field drove attraction. Light on the bitter field drove aversion. That is the value half. To test identity, they trained mice to respond to bitter, and to hold back for sweet. Why set the task against the mouse's own preference?
So the mouse cannot just follow its liking. But it could still learn a rule, such as respond to the unpleasant one. So the team added controls. Trained mice judged new sweet and bitter chemicals with similar accuracy. In one version, low salt, which mice like, shared the bitter answer. Liking alone could not solve that. Blocking either field impaired recognition of its taste. Recognition recovered after the drug washed out. Is there a tidy map, then? That is disputed. In alert, licking mice, another study found distributed responses. Next, Wang and colleagues traced the two fields to different parts of the amygdala. Then they silenced the amygdala.
What survives: recognizing the taste, or the pull toward the sweet field? Recognition stayed. The mice still reported sweet and bitter correctly. But the attraction to sweet-field light was abolished. So identity and value can be pulled apart, in these assays and with this silencing method. The pattern is simple. Manipulate one stage, measure two behaviours, and see which one moves. Value also changes with need. A sodium-depleted animal drinks salt concentrations it would normally reject. The salt is the same. What changes, in these assays, is how much the animal wants it.
Keep the scope. These are mouse assays. They do not show that value is computed only in the amygdala. In decerebrate rats, brainstem circuits still support innate acceptance and rejection. And learning shapes value too. In these mouse experiments, silencing the amygdala removed the attraction and spared trained recognition.
From the film
- In mice, driving the sweet cortical field drew animals in and driving the bitter field made them turn away.
- Blocking either field impaired recognition of its taste.
- Silencing the amygdala in mice spared trained recognition but abolished the attraction to sweet-field light.
- Value shifts with need: a sodium-depleted animal drinks salt concentrations it would normally reject, in these assays.
Chen, Gabitto, Peng, Ryba and Zuker (Science, 2011) imaged the insular cortex of anaesthetized mice and reported separate fields for sweet, bitter, umami and sodium, and did not locate a sour field. That is a gustotopic (taste-quality-ordered) map, in anaesthetized mice, within the regions sampled; whether cortex keeps a tidy map is disputed (below).
Fields would matter more if they did something. Peng and colleagues (Nature, 2015) expressed channelrhodopsin, a light-gated ion channel, in the sweet or bitter field in awake mice. Light on the sweet field drove attraction and light on the bitter field drove aversion in the behavioural assays used. That is the value half.
To test identity, they trained mice to treat bitter as go (respond) and sweet as no-go (withhold the response). Mice learned this mapping and also the reverse one, so they can attach either response to either taste.
Predict. Why train the mice on a mapping that opposes their innate preference, in which the taste they dislike is the one that earns the response?
Check your prediction
Because then a correct response cannot simply follow the pull of the taste. The reversed mapping rules that out, but on its own it leaves a loophole: a mouse could learn the rule “respond to the unpleasant one”. So Peng and colleagues added controls. Trained mice judged sweet and bitter chemicals not used in training with similar accuracy. And in one version low salt, which mice find attractive, shared the go branch with bitter, so liking alone could not solve the task.
Light on a field could also stand in for a taste: trained mice treated light on the sweet field as a sweet stimulus, and the authors report the equivalent result for the bitter field. In trained mice, silencing the bitter field with a glutamate-receptor blocker, which blocks the field’s excitatory synaptic input, impaired bitter recognition, and silencing the sweet field impaired sweet recognition; both recovered after the drug washed out. So the driven fields were sufficient for attraction or aversion, and needed for recognition in this task. They do not show that the animal “experiences” sweetness, and they do not show that cortex is the only place taste is represented.
Now the dispute over the map. Chen, Kogan and Fontanini (Current Biology, 2021) imaged alert, licking mice and found distributed taste responses. The two results differ in state and sampling, so they do not simply contradict each other, but a tidy field diagram should not be taught as settled (a third study, under Going deeper, shows that sampling matters as well as state).
Identity and value can be pulled apart
In the cortex experiments, the fields bore on both readouts. Wang and colleagues (Nature, 2018) asked whether a later stage could separate them. They traced the two fields in male mice. Sweet cortex projected to the anterior basolateral amygdala; bitter cortex projected predominantly to the central amygdala, with some terminals in the posterior basolateral amygdala. Then they silenced the amygdala.
The cortex and amygdala experiments, readout by readout:
| Manipulation (mouse) | Trained recognition (go/no-go) | Attraction or aversion |
|---|---|---|
| Light on the sweet cortical field | trained mice treated the light as sweet | attraction |
| Light on the bitter cortical field | equivalent result reported for bitter | aversion |
| Block the bitter or the sweet field (glutamate-receptor blocker) | recognition of that taste impaired; recovers on washout | not reported here |
| Silence the amygdala | ? | ? (attraction to light on the sweet field) |
Predict. Fill in the last row. If the amygdala were needed for recognizing a taste, what would you see? If it is needed for the pull but not for recognition, what would you see?
Check your prediction
The second. With the amygdala silenced, the attraction elicited by stimulating sweet cortex was abolished, while the mice still reported sweet and bitter correctly in the trained recognition tasks. Recognition stayed; the pull went.
Read that at its scope: these assays and this silencing method. It does not show that the amygdala handles all learning about taste, or that taste identity lives in cortex alone. It does give you a clean experimental pattern: manipulate one stage, then measure two different behaviours, and see which one moves. That pattern is how motivation and reward are separated from perception throughout the nervous system.
Value that moves with need
A fixed value for each taste would be neat, and it is not what the data show. The classic case is sodium appetite: a sodium-depleted animal drinks salt concentrations it would normally reject. The salt is the same; what changes, in these behavioural assays, is how much the animal wants it. Behaviour alone does not show that the salt’s taste signal is unchanged.
Lee and colleagues (Nature, 2019) looked at the circuit side in sodium-depleted mice. They studied a group of brainstem neurons, the pre-locus-coeruleus prodynorphin neurons; inhibiting them reduced sodium intake. Salt in the mouth rapidly suppressed their activity, while infusing NaCl into the stomach did not in the same acute comparison. GABAergic neurons of the bed nucleus of the stria terminalis partly mediated the suppression. The gastric comparison covers only a short window and does not exclude slower feedback from the gut. For how the hypothalamus reads body state, see hypothalamus and autonomic control.
Tongue chemistry also is not the whole of sweetness. Tan and colleagues (Nature, 2020) found that silencing a gut-to-brain circuit in mice prevented the development of sugar preference; Buchanan and colleagues (Nature Neuroscience, 2022) reported glutamatergic signalling for sugar and purinergic signalling for sweetener in CCK-labelled duodenal neuropod cells. Those circuits are taught in gut-brain sensing and vagal sensory neurons.
So a cortical field bears on both readouts, amygdala silencing separates them, and value changes with need and with learning. Forward, the next unit asks how senses combine in multisensory integration and prediction.
Design problem
A drug makes mice drink less sucrose. Design experiments to tell whether it changed what sucrose tastes like (identity) or how much the mice want it (value). Say what each outcome would and would not show.
Saved in this browser only.
One way to do it
Measure the two readouts separately. Train mice on a sweet-against-bitter go/no-go task, with the mapping set against innate preference and with Peng and colleagues’ controls, so that liking alone cannot solve it. In other sessions, measure brief-access licking for sucrose, which reads out the pull. Give the drug and vehicle to the same animals, so each mouse is its own control.
Read the pattern. If recognition stays intact and licking for sucrose falls, the result is consistent with a change in expressed value rather than identity, in these assays. It does not show a change in what the animal “experiences”, or where in the pathway the drug acted. That is the amygdala pattern above. If recognition fails, the drug may have changed identity, or it may have impaired detection, attention, motivation or the ability to do the task. If both fall, the experiment cannot yet separate them.
Narrow down a recognition failure. A matched go/no-go task on two tones checks for some general deficits in attention, motivation or responding, but it cannot tell a taste-detection deficit from a changed taste quality. So also measure sucrose-against-water detection across concentrations, quality discrimination with concentration varied so that intensity cannot serve as a cue, and trial omissions. A drug that weakens the signal might impair recognition at low concentrations and spare it at high ones, because what the fibres report depends on strength. Read the combined results as constraints on these explanations, not as a unique diagnosis of changed identity.
Check the need state. Test whether the drug also blocks a need-driven change in value, such as the rise in salt intake after sodium depletion. And check that the drug does not simply reduce licking for everything, by testing licking for water.
Going deeper
Animals, sampling and the arithmetic of the tuning data
Barretto and colleagues imaged anaesthetized mice of both sexes aged 2 to 12 months. For the worked problem above, two further steps. Difference: subtracting the unrounded fractions gives 23.2 percentage points (subtracting the rounded values, 51.0 minus 27.7, gives 23.3, a rounding effect). Ratio: 0.510 / 0.277 = 1.84, so the multiply responsive proportion was about 1.84 times as high (the raw counts differ by 79 / 28 = 2.8, but the cohorts are different sizes).
Microscopy and mitochondria
Romanov and colleagues (Science Signaling, 2018) reconstructed the type II contact in three dimensions with serial block-face scanning electron microscopy. They reported that CALHM1 channels in mouse type II cells cluster in membrane patches facing nerve fibres that carry the ATP receptor P2X2, with atypical mitochondria pressed against the cell membrane beside them, and they proposed that the mitochondria supply ATP locally. The images show geometry. The case for a mitochondrial ATP source rests on indirect pharmacology: oligomycin eliminated depolarization-evoked ATP release.
Cortical maps in detail
Chen and colleagues (2011) bulk-loaded a calcium dye into the insular cortex of anaesthetized mice and imaged it with two-photon microscopy. Chen, Kogan and Fontanini (2021) imaged superficial insular cortex in alert, licking mice with two-photon and widefield calcium imaging. Fletcher and colleagues (Journal of Neuroscience, 2017) defined gustatory cortex by its input from the taste thalamus and imaged more than 780 neurons there. Taste quality was carried in the cells’ activity, but with no apparent spatial organization of qualities. So state alone does not explain the dispute; where and how cortex is sampled matters too.
A disputed thirst experiment
Zocchi, Wennemuth and Oka (Nature Neuroscience, 2017) reported that silencing acid-sensing taste cells removed water-evoked taste-nerve responses in mice, and that water-deprived mice licked for light activation of those cells even when no water was delivered. This did not happen with food deprivation or salt depletion.
A second study (Wilson, Vandenbeuch and Kinnamon, eNeuro, 2019) stimulated cells in a PKD2L1-IRES-Cre line crossed to a channelrhodopsin reporter and did not see sustained light-directed drinking. Light did evoke chorda tympani and glossopharyngeal nerve responses, and it produced a slight but significant aversion in two-bottle tests in both sexes. Their line drove channelrhodopsin in only about half of PKD2L1-labelled cells. The two papers differ in driver line (a BAC transgene in one, an IRES-Cre knock-in in the other), which may change how strongly and in which cells the channel is expressed.
A second design problem: settle the thirst result
This is practice in experimental design on a contested result, not one of the lesson’s main findings. Design the experiment that would settle the two results above, and say what each outcome would and would not show.
One way to do it
Match the tools. Use the same driver and reporter in both laboratories, or compare both lines side by side in one study. Count how many cells of which type are targeted in each line, since a driver labels cells that expressed it at some time, not a pure type. The two results may differ because different cells were reached.
Match the conditions. Use the same light parameters and the same deprivation state, and include a within-animal comparison of light-triggered licking against licking for water, so each mouse acts as its own control. Compare water deprivation, food deprivation and salt depletion, plus a fully replete condition.
Measure behaviour, then nerve, in the same animals. Measure licking first, including two-bottle tests that could show a mild preference or aversion. Then, in a terminal experiment, record the taste-nerve response to the light to confirm that the cells in those animals were driven.
Read the result at its scope. If light-directed licking appears only under thirst in matched lines, the manipulation shows that activating those cells can direct licking in thirsty mice. It does not show a sixth human taste, and it does not show that the animal was rehydrated, since light delivers no water. If it does not appear, the first result may reflect a different driver population.
Your notes
Select any text in the lesson to highlight it or add a note to it. Your highlights and notes are saved in this browser and collected in your notebook.
This browser is not letting the site save anything (a private window or strict privacy settings), so highlights and notes will be lost when you leave the page.
How we measure it
GRIN microendoscope and confocal calcium imaging
A thin gradient-index lens relays fluorescence from deep tissue, or a confocal microscope images exposed tissue, while a genetically encoded calcium indicator such as GCaMP reports neuronal activity. It records dozens of geniculate neurons at once, but responses depend on the stimulus panel, concentration and the criterion for calling a cell responsive.
Optogenetic stimulation with behavioural assays
Light-gated channels are expressed in a chosen cell population and activated by light while the animal licks, moves or performs a trained task. It tests whether driving those cells is enough to change a behaviour in that assay, and trained go and no-go tasks help separate recognition from preference.
Whole-cell voltage clamp and ATP release assays
A cell's membrane potential is held fixed while its channel currents are recorded, and a luciferin-luciferase assay reads out ATP released into the bath. Together they link a channel subunit to gating kinetics and to transmitter release.
Serial block-face scanning electron microscopy
A block of tissue is imaged and shaved in repeated thin steps to reconstruct cell contacts in three dimensions. It shows the arrangement of a contact and its organelles but does not by itself measure how much transmitter crosses it.
Practice questions on this lesson (3) → MCAT-style, original, each with an explanation
Where this lesson fits
Before thisReview first
- Smell and TasteNeuroscience · College: going further
It gives the taste cells and receptors whose handoff to nerve fibres this lesson follows.
- Principles of Sensory CodingNeuroscience · College: going further
It teaches labelled-line versus population coding, which the tuning-breadth argument here tests.
- Sensory Neurons by Their Genes: the Atlas EraThis course · Lesson 3
You need to know how neurons are sorted by genes and tuning before judging narrow versus broad fibres.
After thisStudy next
- Combining Senses and Predicting ThemThis course · Lesson 29
It takes the idea further by asking how separate senses, and signals caused by your own movement, are combined.
Elsewhere on the siteFilms, simulations and method films in other courses
- Received Minus PredictedFilm · Neuroscience
It shows how the brain signals how much an animal wants something, the value signal separated from identity here.
- Correction, Threshold and GainFilm · Neuroscience
It shows how a body need changes a drive, as sodium need changes how much an animal wants salt.
Suggested by an AI model from the lessons themselves, then checked. How we use AI
Finish line
Test yourself
8 questions
Practice and MCAT-style, with explained answers.
Next · Lesson 29
Combining Senses and Predicting Them
Your senses disagree, and some of what they report is only the result of your own movement. How does a nervous system decide which sense to trust, and what to subtract? Subtracting self-generated input is one candidate explanation for why you can hardly tickle yourself, though the full answer is not settled.
Continue →