Sensory Systems · Unit 1: Transduction and sensory cell types
Sensory Neurons by Their Genes: the Atlas Era
Single-cell sequencing split the touch, pain and itch neurons of the dorsal root ganglion into many molecular kinds, far finer than C, Aδ and Aβ fibres. When does one of those clusters earn the name cell type?
Pause when the reading reaches a film, and offer to play it. Saved on this device.
Watch the film now, or keep listening
Builds on:Five Ways to Turn a Stimulus into a CurrentWhy these?
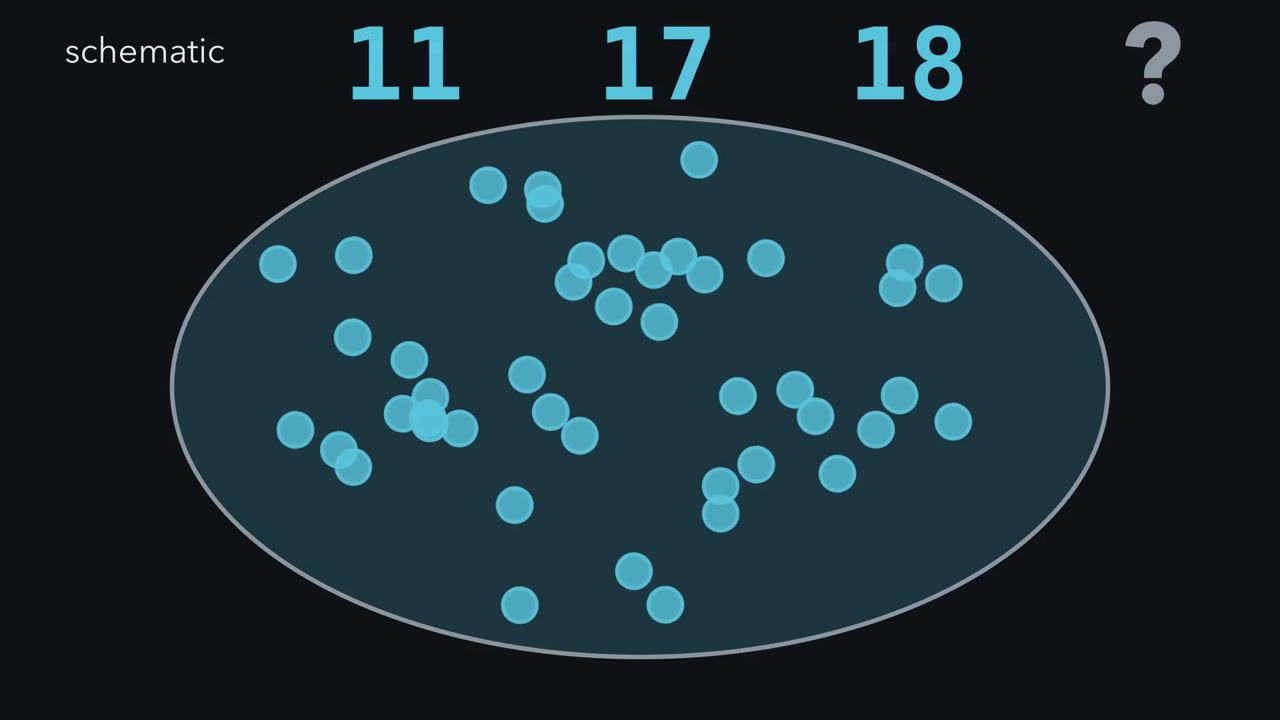 ▶ Watch From Cluster to Cell Type · 3:29
Read the transcript of “From Cluster to Cell Type”
Film transcript: From Cluster to Cell Type
Three sensory-neuron atlases report eleven, seventeen and eighteen groups. Which count should you trust? Watch the same question change as the evidence changes. Each dot is one mouse dorsal root ganglion neuron. Its measured RNA becomes a teal barcode. A clustering method groups similar barcodes. Similar barcodes suggest similar molecular programs, but they do not reveal a job by themselves. The result is a map of this sample, not a finished catalogue of nature. Now keep every neuron and every RNA count unchanged. Turn the clustering resolution higher. Will the tree gain neurons, lose neurons, or split existing branches?
It splits branches. No new neuron appeared. That simple dial shows how resolution can change a count. In real atlases, one mouse data set resolved eleven classes, and a larger census resolved seventeen. A cross-species integration later reported eighteen dorsal root ganglion subtypes. Those counts also differ in sample and method. Resolution is only one control.
Whole cells and nuclei capture different RNA, so preparation can hide a branch. A sample can also miss rare cells before clustering even begins. Injury can pull several established types into one red transcriptional state. Neither change is simply extra zoom. A transcriptomic cluster is therefore a candidate type. It earns a functional type claim when it recurs and an independent measurement anchors it. Its count and boundary still depend on resolution, preparation and state. Genetic access supplies that test in mice. A marker from the teal RNA profile drives a gold label in the candidate cells. If one marker is too broad, requiring two expression histories narrows the label to their intersection.
Researchers can follow those labelled endings into skin, then stimulate the skin while imaging the ganglion. In one toolkit, labelled subtypes covered different tested ranges of force and temperature. A distinct ending or response range is independent of the clustering settings. It strengthens the type claim without making every cell identical. The test still has limits. A driver records marker expression, sometimes during a chosen time window. Calcium signals do not count every spike. The result supports a functional type only within the preparation, stimuli and cells actually tested. So do not ask which atlas won. Ask what produced each boundary, then ask whether another measurement reaches the same group. That turns a cluster from a pattern into a testable biological claim.
From the film
- Atlas cluster counts depend on the data set, resolution, preparation and cell state.
- A transcriptomic cluster is a candidate type, not a functional conclusion.
- Genetic access lets researchers connect a candidate cluster to anatomy or physiology.
- An independent anchor strengthens a cluster's claim to be a functional type.
The practical rule needs a scope before we use it.
Guiding idea. For sensory-neuron atlases, treat a transcriptomic cluster as a candidate type: it earns a functional type claim when it recurs and an independent measurement anchors it, while its count and boundaries remain conditional on resolution, preparation and state.
This is a rule for interpreting sensory-neuron atlas claims, not a universal definition of cell type. An independent anchor can be an ending, physiology, target or behaviour after manipulation. A molecular class remains useful before that test; it simply supports a narrower claim.
Touch and pain introduced Aβ, Aδ and C fibres, and sensory coding compared labelled lines with population codes. Sequencing and genomes and recording many neurons cover the sequencing and atlas methods. Here, a cluster is a group of cells with similar measured RNA profiles; a state is a condition an existing cell can enter and leave.
What each atlas actually counted
The dorsal root ganglion (DRG) holds cell bodies of neurons innervating skin, muscle and viscera. Usoskin, Ernfors and colleagues (2015) dissociated mouse lumbar DRGs and let an unsupervised method group the single-neuron transcriptomes into eleven classes. NP3, one non-peptidergic class, was linked by the authors to itch. That expression pattern suggested a function; it did not prove one (itch supplies the later evidence).
Zeisel and colleagues (2018) profiled a much larger census across the mouse nervous system. Within peripheral sensory neurons, their hierarchical taxonomy resolved eight peptidergic, six non-peptidergic and three neurofilament types: seventeen. Broad classes and fine subtypes occupy different levels of the same tree. More cells, deeper sequencing or a finer clustering setting can split a branch, whereas a preparation can hide RNA or cells rather than merely changing the zoom.
Bhuiyan, Renthal and colleagues (2024) integrated 31 DRG and trigeminal data sets from human, mouse, rat, guinea pig and two macaque species. Their reference contained eighteen DRG and fourteen trigeminal neuronal subtypes. The authors stressed that preparation, sequencing depth and analysis affect what is resolved. One DRG group was defined by injury-induced transcription factors: the Atf3 group. It warns that an atlas can contain a state alongside types. They also cautioned that one molecular subtype can behave differently at different innervation targets.
Do not turn fibre labels into transcriptomic clusters. Among low-threshold mechanoreceptors (LTMRs), neurons activated by innocuous touch, C, Aδ and Aβ mean unmyelinated, lightly myelinated and heavily myelinated axons (Li and colleagues, 2011). C does not mean nociceptor: adult mouse tyrosine-hydroxylase-positive neurons were identified as C-fibre LTMRs. The LTMR lesson builds the full class table.
From a candidate cluster to a functional test
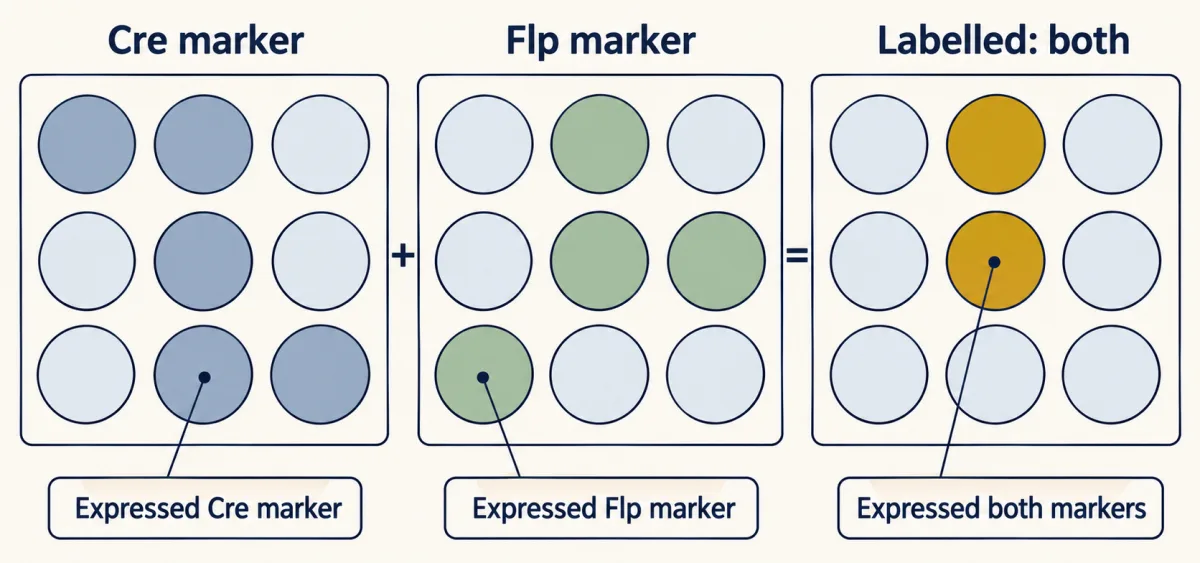
The usual bridge is genetic access. A Cre driver expresses Cre recombinase under a marker gene’s regulatory sequences, either from the gene’s locus or a transgene. A reporter then marks cells that expressed that marker. CreER adds a tamoxifen-controlled time window. An intersectional strategy requires Cre and Flp, restricting the label to cells that expressed both markers (tools for development covers the genetics).
Every line has two separate quality numbers:
specificity = labelled and marker-positive cells / all labelled cells
efficiency = labelled and marker-positive cells / all marker-positive cells
Predict. A made-up line labels 200 neurons. Of those, 180 express the target marker, while the sections contain 300 marker-positive neurons altogether. Can the line be highly specific but only moderately efficient?
Check your prediction
Yes. Specificity is 180 / 200 = 90%, because most labelled cells are on target. Efficiency is 180 / 300 = 60%, because 40% of the target population was missed. The line can isolate the right cells for imaging, but a negative ablation result is weak: killing 60% and seeing no deficit does not show the population is unneeded.
- Specificity = labelled and marker-positive / all labelled
- 180 / 200 = 90%
- Efficiency = labelled and marker-positive / all marker-positive
- 180 / 300 = 60%
Reading: a line can be good for imaging the right cells and weak for an ablation, because losing part of a population (60% in the lesson’s example) and seeing no deficit does not show the population is unneeded. A CreER label records expression at the time of induction, so the same driver induced at two ages can capture two populations (TrkC-CreER at E12.5 versus P5, Bai et al., 2015).
In this sketch: made-up counts of cells in sections, with in situ hybridization as the reference for “marker-positive”; these are not cells in an animal, and no cluster count and no physiology follows from these two numbers.
Specificity and efficiency share the same numerator, the labelled and marker-positive cells, but divide by different totals, so a line can score high on one and low on the other.
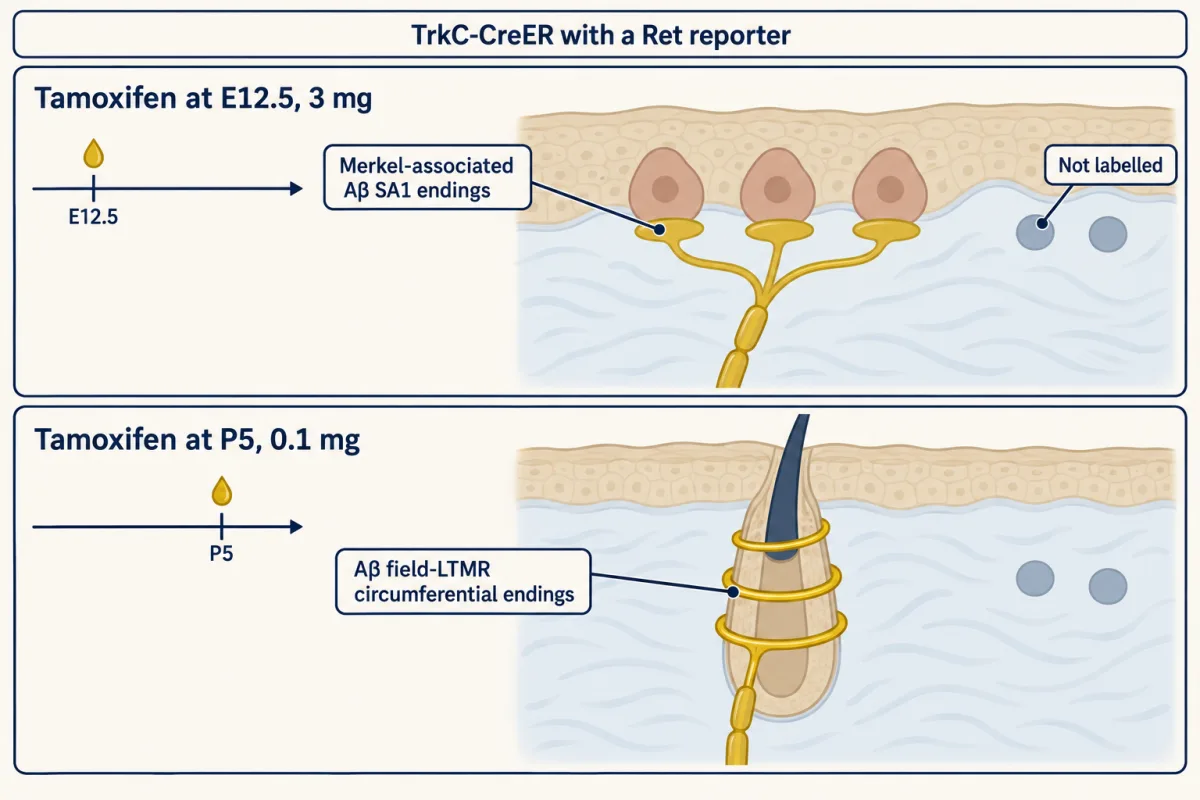
Timing is part of the label. With TrkC-CreER intersected with a Ret reporter, Ret-f(CFP), Bai and colleagues (2015) used 3 mg tamoxifen at E12.5 and labelled Merkel-associated Aβ SA1 endings. With 0.1 mg at P5, the label favoured Aβ field-LTMR circumferential endings.
Predict. Can the difference be attributed to induction age alone when both age and tamoxifen dose changed?
Check your prediction
No. Age and dose changed together, so the experiment does not isolate an effect of age. It shows that induction conditions change which expression history is captured. Nor did it track the same neurons changing class, so a CreER label is not evidence that SA1 neurons turn into field-LTMRs.
Qi, Iskols, Sharma, Ginty and colleagues (2024) turned such access into a functional test. One intersection, Smr2-Cre with Calca-FlpE, restricted labelling to an SMR2- and CGRP-positive population with free endings. The team exposed the L4 dorsal root ganglion (DRG) in anaesthetized young mice and imaged calcium while indenting skin with forces from 1 to 75 mN, heating it or cooling it.
The authors reported that each genetically defined subtype had its own threshold and response range within the mechanical or thermal stimuli tested. Together the subtypes tiled those tested ranges, recruiting more subtypes as a stimulus grew stronger. Variation remained within a group: Transient receptor potential melastatin 8 (TRPM8) neurons showed three kinds of cooling response. The independent physiology therefore strengthened the candidate clusters’ claim to be functional types without making every member identical.
Calcium imaging sets a limit on that inference. In adult mouse DRG imaged in vivo, GCaMP6 rises and decays slowly compared with an action potential (Chisholm and colleagues, 2018). It detected single action potentials in most cases, but nearby spikes summate, so one transient does not give an exact spike count and amplitude tracks firing rate only roughly. Patch-seq makes the bridge more direct: record a neuron with a patch electrode, then aspirate and sequence that same cell. Cadwell and colleagues (2016) demonstrated it in mouse neocortex; Parpaite and colleagues (2021) used it in mouse DRG, matching mechanically activated currents to transcriptomic populations.
Adult atlases freeze one moment; the second film follows identity through development, injury and a change of species.
Read the transcript of “When Identity Changes”
Film transcript: When Identity Changes
Chapter one treated each cluster as a candidate type. But can the same sensory neuron leave its cluster and later return? Follow its identity through development, injury and another species. Mouse sensory neurons begin subtype specialization after they have become neurons. Early cells coexpress several transcription factors. The cells are not blank; specialization here refers only to subtype identity. Over development, those teal badges narrow into subtype-restricted combinations. The broad starting population resolves into distinct blue branches. Signals from targets contribute to that narrowing. Removing nerve growth factor changed subtype-restricted expression in mouse dorsal root ganglia. Fewer distinct populations remained when nerve growth factor was absent. Keeping the affected neurons alive separated altered identity from selective death. The signal contributes; it does not set every fate alone.
Now cut the peripheral axons. Several blue types lose their subtype markers and gather in one red Atf3-rich cluster. Is that cluster a new permanent type, or a shared state? It behaves as a shared injury state. Existing neurons from many subtypes enter it. The red program promotes regeneration while suppressing the usual subtype signatures. As axons regrow over time, subtype expression reappears and the neurons separate toward their earlier branches. Their fixed gold outlines reveal continuity beneath the changing RNA. The timing is associated with target reinnervation, but timing alone cannot prove cause. Tracing injured neurons argues against selective death.
It still does not show that contact with the target restores identity. Keep the causal arrow dashed. Species adds another boundary. In mouse, Tafa4 is mainly associated with one blue C-fibre touch branch. In human tissue, TAFA4 was strongest in an Aδ touch population. It also appeared in cold-sensing and C-fibre touch populations. The same marker does not guarantee the same type. A missing cross-species match may also come from method. Whole cells and nuclei capture different RNA. A missing group can reflect what the preparation captures, not biological absence. Integration methods are built to align data sets and can merge real differences.
Match preparations, validate markers in tissue and seek independent function. An atlas is a snapshot of cells, methods and conditions. Follow cells through time before calling a cluster permanent. Cross species boundaries only after matching the view. Identity is biological, but every atlas samples it.
From the film
- Subtype identity emerges as broad transcription factor expression narrows during mouse development.
- After peripheral nerve injury, mouse sensory neurons can suppress subtype markers and enter a shared injury state.
- Subtype expression returns over a time course associated with axonal regrowth; timing alone does not prove cause.
- Mouse markers and cell classes do not automatically transfer to human sensory neurons.
The causal tests behind changing identity
The chapter showed the trajectories; the experiments below supply the controls. Dorsal root ganglion (DRG) neurons arise from neural crest (the neural crest). Sharma, Ginty and colleagues (2020) sequenced mouse DRG neurons from embryonic stages to adulthood. The early cells were already post-mitotic sensory neurons. “Unspecialized” refers only to subtype identity: they coexpressed transcription factors that later became restricted to particular subtype combinations over weeks.
The target-derived signal nerve growth factor (NGF) keeps TrkA-expressing neurons alive (Trk and p75). An Ngf knockout alone would remove cells, making altered identity impossible to separate from selective survival.
Predict. Which littermate control matches the block of apoptosis in Ngf-null;Bax-null mice: wild type or Bax-null?
Check your prediction
Bax-null is the matched control. Bax is needed for these neurons to die by apoptosis, so removing it in both groups keeps neurons available for profiling and lets the comparison ask about NGF-dependent identity rather than cell loss. At P0, the double mutants had fewer transcriptionally distinct populations. NGF therefore contributes to subtype specialization; the mouse experiment does not show that NGF alone sets every fate.
Renthal and colleagues (2020) cut or crushed peripheral nerves in adult mice and sequenced single DRG nuclei. Injury suppressed subtype-marker expression, and Atf3 was required for the full injury reprogramming. Subtype identity re-emerged over a time course associated with axons regrowing to their targets.
“Associated with” matters. Timing alone does not show that reinnervation restores identity, and apparent recovery could reflect which neurons survived or were sampled. The study therefore traced injured neurons: the share labelled by an Atf3 injury reporter was unchanged from one week to two months, arguing against selective death, and Mrgprd reporter tracing fit retained identity.
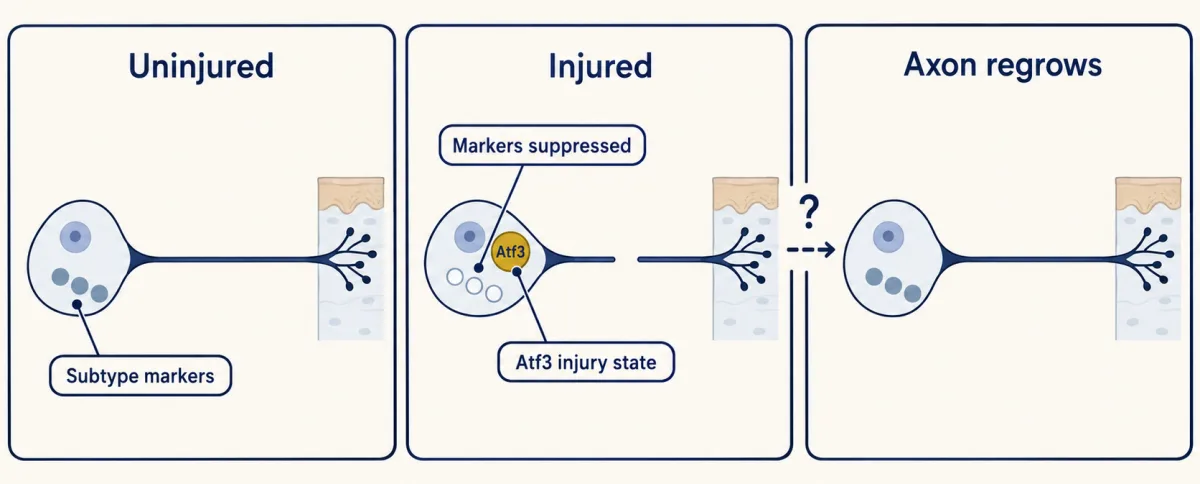
An injured, inflamed or diseased ganglion can therefore contain states. An Atf3-rich cluster is a condition existing neurons enter and leave, not a new permanent type, a distinction that matters in chronic pain.
Human atlases: methods, markers and denominators
Keep the rule in view: each group must be read with its resolution, preparation and state. Human dorsal root ganglion (DRG) atlases often use nuclei or tissue sections because donor tissue is often frozen and large human neurons are hard to dissociate intact.
Nguyen and colleagues (2021) sequenced 1,837 neuronal nuclei from lumbar DRGs of donors aged 34 to 55. Several classes lacked a clear mouse equivalent in their comparison. H9 coexpressed transient receptor potential melastatin 8 (TRPM8) and PIEZO2 transcripts, suggesting sensitivity to cold and touch but not demonstrating it. MRGPRX1, although not strongly expressed, localized selectively to H10. Primate MRGPRX genes have no one-to-one mouse counterparts, so a mouse Mrgpr population should not simply be renamed with a human gene.
The 2024 atlas linked mouse groups to function using rodent genetics: Mrgprd neurons to nociception; Mrgpra3 and Trpv1 coexpressing neurons to itch; and Mrgpra3 and Mrgprb4 coexpressing neurons to C-LTMR physiology. Those links do not by themselves assign human function.
Spatial data preserve anatomy but change the denominator. Tavares-Ferreira and colleagues (2022) used Visium spots 55 µm across on lumbar DRG sections from eight organ donors, four women and four men, then validated markers by RNAscope in situ hybridization. They selected 4,356 spots overlapping single neurons, retained 3,952 after filtering and curated twelve neuronal clusters, five called C nociceptors.
Predict. A student divides five C-nociceptor cluster labels by twelve labels and reports that 41.67% of human DRG neurons are C nociceptors. What did that denominator count?
Check your prediction
It counted category labels, not neurons. The valid calculations are:
- Retention = 3,952 / 4,356 = 0.9073, or 90.73%. Check: 4,356 × 0.9073 = 3,952.2, which rounds to 3,952.
- Five / twelve = 0.4167, or 41.67% of cluster labels. Clusters need not be equally large.
Per-cluster spot counts come closer to an abundance estimate because each kept spot was selected to overlap one neuron. They still describe sampled sections, not all human DRG neurons. Spots also collect RNA from satellite glia and neighbours, affecting assignment, and a few neurons lay under more than one spot.
The same study found TAC1 and CALCA, encoding substance P and CGRP, broadly expressed across human nociceptor clusters. The authors therefore suggested that the mouse peptidergic/non-peptidergic split may not transfer as a clean binary. Jung and colleagues (2023) used one workflow across mouse, guinea pig, macaque and human DRG. Tafa4 was mainly in mouse C-LTMRs, whereas human TAFA4 was strongest in NTRK2- and SCN5A-positive Aδ-LTMRs, confirmed by in situ hybridization. A mouse mechanism tied to a marker needs a human check of which cells carry it. Nociceptors and sodium channels meets the same drug-target problem.
Design problem: is a proposed human-only class real?
Nguyen and colleagues (2021) reported human classes without clear mouse equivalents using single-nucleus sequencing. Yu and colleagues (2024), deeply sequencing single human DRG somata, also reported likely human-specific types. The 2024 integration found no human-specific neuronal clusters, but an integration is built to align data sets and can merge real differences.
Predict. Why should tissue validation test two or three defining markers in the same neurons rather than one marker alone?
Check your prediction
A cluster is defined by a combination of expression, and one marker may be shared with other groups. Coexpression of two or three defining markers in the same cells tests whether the proposed population exists in tissue rather than merely whether one gene is present. It should recur across donors.
Nguyen and colleagues noted a separate preparation warning: mouse whole-cell data contained a Trpa1-rich group that a compared mouse nuclear data set missed. If a proposed human-only group gains a mouse partner only after nuclei are compared with nuclei, a preparation difference becomes the leading explanation, provided the integration did not simply force unlike groups together.
To test the claim fully:
- Match preparation. Compare nuclei with nuclei and, where possible, whole cells with whole cells, at similar depth and with the same pipeline and clustering resolution.
- Test robustness. Require the class in several donors and across several clustering resolutions and integration methods. A class carried by one donor or setting is fragile.
- Validate in tissue. Use multiplex in situ hybridization for two or three defining markers in human and orthologous mouse genes, counting coexpressing neurons and measuring soma size. A coexpressing population present in human sections but absent from mouse sections supports a real expression difference.
- Anchor function. Record human DRG neurons in culture or by Patch-seq, or use microneurography where an afferent class can be matched, and ask whether the marker-defined cells share physiology.
If the class disappears when methods are matched, and integration did not force unlike groups together, it was probably a preparation artefact. If it survives matched methods and tissue validation but lacks distinct physiology, it is a molecular difference of unknown function. All four steps support a functional human-mouse difference; calling it human-specific also requires comparison with another species such as macaque.
Going deeper
Class lists, sample sizes and toolkit lines
Usoskin and colleagues sequenced 622 single neurons from dissociated lumbar dorsal root ganglions (DRGs). Their eleven classes were five neurofilament-rich groups (NF1 to NF5) with myelinated profiles, three non-peptidergic groups (NP1 to NP3), two peptidergic groups (PEP1 and PEP2), and one marked by tyrosine hydroxylase.
Zeisel and colleagues profiled roughly half a million cells across the mouse nervous system. That is the whole census, not a DRG-neuron count.
In adult mouse, TH-positive neurons were identified as C-fibre low-threshold mechanoreceptors (LTMRs), with mean conduction velocity 0.58 m/s in ex vivo skin-nerve recordings from five neurons.
The Qi toolkit included Th2A-CreER for C-LTMRs, TrkB-CreER for Aδ-LTMRs, Ret-CreER for Aβ rapidly adapting LTMRs and new knock-ins such as Trpm8-T2a-FlpO.
Calcium-indicator constants
In adult mouse DRG imaged in vivo under urethane, GCaMP6 had a typical rise of about 200 ms and a decay time constant of about 700 ms (Chisholm and colleagues, 2018).
Sampling schedule and cohort details
Sharma, Ginty and colleagues sampled mouse DRG neurons at E11.5, E12.5, E15.5, P0, P5 and P28 to 42. Renthal and colleagues injured peripheral nerves in mice, mostly males aged 8 to 12 weeks.
Your notes
Select any text in the lesson to highlight it or add a note to it. Your highlights and notes are saved in this browser and collected in your notebook.
This browser is not letting the site save anything (a private window or strict privacy settings), so highlights and notes will be lost when you leave the page.
How we measure it
Single-cell and single-nucleus RNA sequencing
Dissociated cells, or nuclei isolated from frozen tissue, are each given a barcode so that their RNA can be sequenced and counted one cell at a time, then grouped by similarity. Whole cells and nuclei capture different RNA, so the method of preparation can change which groups appear.
Cre, CreER and Cre/Flp intersectional genetics
A recombinase expressed under a marker gene's regulatory sequences switches on a reporter or an actuator in cells that expressed that marker at some time; CreER adds a tamoxifen-timed window, and requiring both Cre and Flp restricts the label to cells that expressed two markers. Each line is validated by its specificity and its efficiency.
In vivo DRG calcium imaging
A genetically encoded calcium indicator such as GCaMP is expressed in sensory neurons, the ganglion is exposed in an anaesthetized mouse, and hundreds of cell bodies are imaged while the skin is stimulated. It reports which neurons respond, but the slow signal does not count spikes.
Spatial transcriptomics with in situ hybridization
RNA from a tissue section is captured on an array of barcoded spots (55 µm across on the Visium platform), so expression keeps its position; single-molecule in situ hybridization then checks a marker in individual cells. A spot over a large neuron still mixes in RNA from neighbouring cells.
Practice questions on this lesson (3) → MCAT-style, original, each with an explanation
Where this lesson fits
Before thisReview first
- Five Ways to Turn a Stimulus into a CurrentThis course · Lesson 1
It explains how different sensory neurons turn a stimulus into current, which the molecular subtypes here are sorted around.
After thisStudy next
- The Low-Threshold Mechanoreceptors: One Touch, Several SignalsThis course · Lesson 4
It builds the full touch-neuron class table that this lesson only points to, using genetic access to separate the classes.
- Nociceptors and the Sodium Channels of PainThis course · Lesson 11
It applies the mouse-to-human marker problem to pain neurons and the drug targets they carry.
- Itch: A Sense of Its OwnThis course · Lesson 13
It follows the itch-linked clusters, such as NP3 and Mrgpra3 neurons, into tests of function.
Suggested by an AI model from the lessons themselves, then checked. How we use AI
Finish line
Test yourself
8 questions
Practice and MCAT-style, with explained answers.
Next · Lesson 4
The Low-Threshold Mechanoreceptors: One Touch, Several Signals
A light stroke on your skin is not one signal. Different kinds of touch neuron are most sensitive to different parts of it: the motion, the steady press, the vibration, the slow stroke. On a mouse's back, three of these kinds can even share a single hair. Why build a sense that way?
Continue →