Cell Biology · Unit 2: Membranes and compartments
Protein Quality Control and Organelle Turnover
Rewritten on : new text, flashcards and film. Your notes and highlights stay, but the text around them may have moved.
When material piles up in a cell, is more arriving or less leaving, and how can you tell?
Pause when the reading reaches a film, and offer to play it. Saved on this device.
Watch the film now, or keep listening
Builds on:Protein Sorting into CompartmentsOrganelles as Distinct EnvironmentsWhy these?
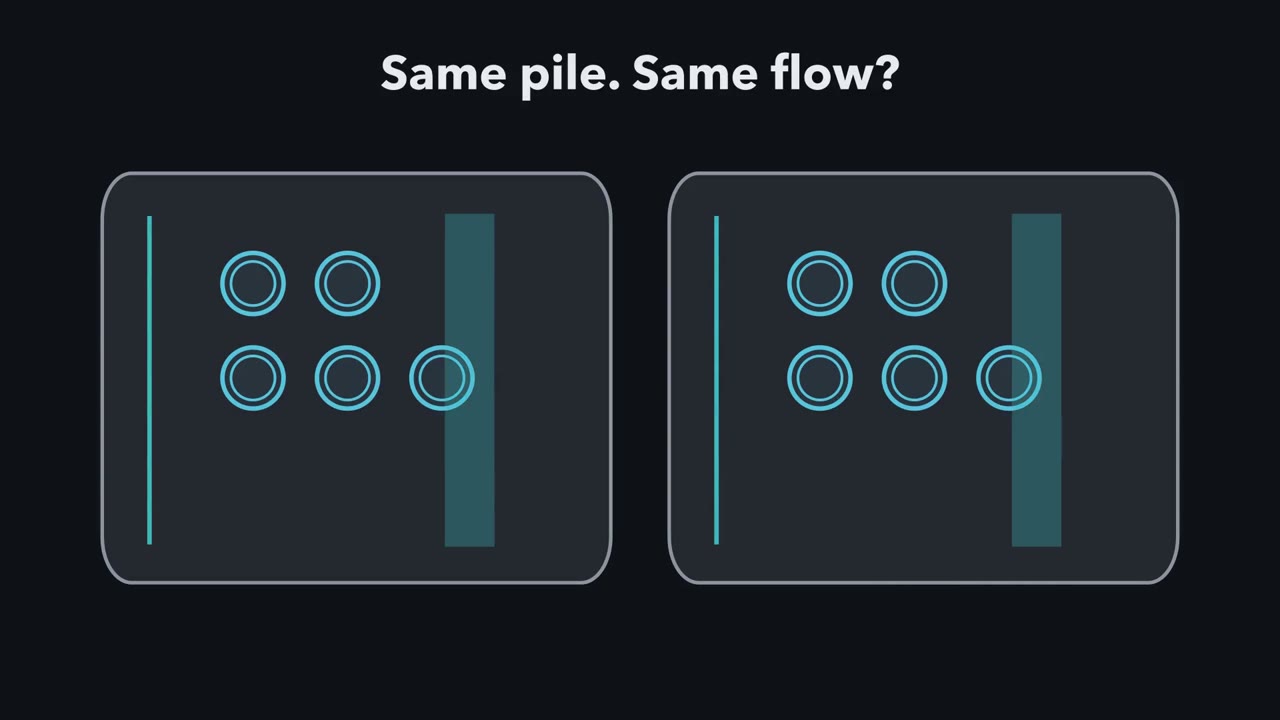 ▶ Watch Follow the Flow, Not the Pile · 4:03
Read the transcript of “Follow the Flow, Not the Pile”
Film transcript: Follow the Flow, Not the Pile
Autophagy wraps cell material in carriers and sends it to lysosomes for recycling. Those carriers are autophagosomes. Yet two cells can hold the same large pile. Is autophagy faster in both? One makes and clears them quickly. The other makes them slowly, but its exit is blocked. A still picture cannot distinguish those stories.
The endoplasmic reticulum, or ER, uses helpers to retry proteins that have not reached their working shape. This is a first picture. In the ER, many failed proteins are returned to the cytosol, tagged with ubiquitin, and destroyed by the proteasome. Ubiquitin is that small protein tag. The proteasome is a capped barrel that unfolds and destroys tagged individual proteins. Now a damaged mitochondrion reaches the same station. It cannot enter the proteasome's narrow barrel. Macroautophagy uses a different physical solution. A blue membrane cup grows around the cargo and closes into an autophagosome. In macroautophagy, autophagosomes carry bulk cytoplasm and whole organelles to lysosomes. The carrier fuses with a lysosome, whose acidic interior digests the cargo into reusable blocks.
Starvation reduces building blocks arriving from outside the cell, so the reuse bin begins to empty. More cytoplasm now enters autophagosomes and reaches lysosomes. Digestion sends recovered blocks back into the bin. During starvation, autophagy recycles cell material into reusable building blocks. That recycling may be one reason autophagy-defective yeast lose viability faster during nitrogen starvation. Now watch the carrier pool between its two gates. For a defined cellular pool, change equals arrival minus clearance over the interval. Matching rates keep the pool level. Faster arrival makes it grow.
Slower clearance does too. For a defined cellular pool, a larger pool can mean faster arrival or slower clearance. We need an experiment that separates those possibilities. LC3-II is a protein form attached to autophagosome membranes, so it marks the carriers. Bafilomycin blocks lysosomal acidification, closing the exit during this short assay. Now two LC3-II pools start equally high. After bafilomycin, which pool rises more: the one with fast arrival or slow arrival?
The fast-arrival pool rises more after clearance stops. Its purple gauge climbs steeply while the slow-arrival gauge barely moves. Under a complete lysosomal block that leaves carrier formation unchanged, the extra LC3-II estimates lysosomal turnover over the interval. The equal starting amounts could not reveal that difference. Return to the two cells with equal carrier piles. Their visible amounts matched, but their flows did not. Closing the exit exposed the difference in arrival. The same question works across the recycling map, even when the cargo and route change. Wherever material piles up, ask two questions. How fast does it arrive? How fast does it leave?
From the film
- For a defined cellular pool, a larger pool can mean faster arrival or slower clearance.
- In the ER, many failed proteins are returned to the cytosol, tagged with ubiquitin, and destroyed by the proteasome.
- In macroautophagy, autophagosomes carry bulk cytoplasm and whole organelles to lysosomes.
- During starvation, autophagy recycles cell material into reusable building blocks.
- Under a complete lysosomal block that leaves carrier formation unchanged, the extra LC3-II estimates lysosomal turnover.
Starve a yeast cell of nitrogen and it starts to digest pieces of its own cytoplasm. A mutant that cannot do this loses viability faster than normal yeast during the starvation. Why?
The first film followed cargo to two exits and ended on two questions: how fast does material arrive, and how fast does it leave? What it left out is how to measure those rates, which the worked problem below does with numbers, and how the ER and a damaged mitochondrion are handled, which come after.
In 1993, Miki Tsukada and Yoshinori Ohsumi found that the autophagy-defective yeast mutant apg1 failed to induce protein degradation in the vacuole, the yeast counterpart of a lysosome, and lost viability faster during nitrogen starvation. The experiment supports a role in survival without establishing a sole cause.
The one idea to carry through this lesson. For a defined cellular pool over a defined interval, its change equals arrival minus clearance. A high level measured at one time therefore cannot tell whether arrival increased or clearance slowed. Temporarily blocking a clearance route and measuring the additional accumulation can estimate flux through that route, if the block is complete and does not itself change arrival over that interval.
Physical constraints on the two exits
The two exits have different physical jobs because they admit cargo differently. The 26S proteasome, found in the cytosol and nucleus, has a hollow 20S core whose active sites face inward. Its regulatory caps recognise ubiquitin chains, remove ubiquitin for reuse, and use ATP to unfold and thread an engaged protein into the core. The tagging system is covered in ubiquitin and proteolysis, and the chemistry in protein turnover.
In a lysosome, a V-ATPase—an ATP-powered proton pump—acidifies the lumen so digestive enzymes called hydrolases work well (see organelles as environments). Material also arrives from outside by endocytosis. In macroautophagy, the main form of autophagy, a cup-shaped membrane grows around a portion of cytoplasm and closes into an autophagosome bounded by two membranes. The autophagosome fuses with a lysosome, and the inner membrane and its contents are digested; the building blocks return to the cytosol. Starvation can raise this through nutrient-sensing kinases such as mTOR (see mTOR and AMPK). Ohsumi’s yeast genes, later renamed ATG genes, encode much of the machinery, including a system that attaches LC3 (Atg8 in yeast) to phosphatidylethanolamine; this lipid-linked LC3-II coats autophagosome membranes, and inner-membrane copies are destroyed in the lysosome.
The first film used the simplest case, single proteins to one exit and bulk cargo to the other; cargo size alone does not decide fate, and Going deeper gives the overlap.
Read a flow, not a still picture
Arrival minus clearance becomes useful when an experiment turns one of those rates down. Counting LC3 dots or measuring one LC3-II band still cannot distinguish faster carrier formation from slower destruction.
Worked problem: autophagic flux. Cultured cells are immunoblotted for LC3-II, with each band normalized to actin and control set to 1.0. Bafilomycin A1 inhibits the V-ATPase, suppressing lysosomal degradation under these assay conditions. It is added for the last few hours. Assume a saturating dose, high enough for a complete block, plus linear LC3-II accumulation and no change in carrier formation over that interval.
| Condition | Without bafilomycin | With bafilomycin |
|---|---|---|
| Control | 1.0 | 2.0 |
| Starved | 1.5 | 4.5 |
| Drug D | 3.0 | 3.2 |
flux over the interval = LC3-II with bafilomycin − LC3-II without bafilomycin
Predict. Drug D has the highest LC3-II level without bafilomycin. Does it also have the highest flux? Calculate all three differences before opening the answer.
Check your prediction
No. Control lysosome-dependent turnover is 2.0 − 1.0 = 1.0. Starved turnover is 4.5 − 1.5 = 3.0. Drug D turnover is 3.2 − 3.0 = 0.2. Drug D builds the largest pool before inhibitor but clears only one fifth as much LC3-II as control over the interval. Its pattern points to a block at fusion or degradation, not induction; these lanes cannot say which step fails. Starvation gives three times the control increment, which fits more autophagosomes being made.
Keep this rule: a high LC3-II band on its own can mean more made or less destroyed, so only the LC3-II saved by bafilomycin, the flux, shows which. In this sketch the inhibitor is assumed saturating, the numbers are made up, and the ‘without’ band is simply the made amount × (1 − share destroyed); the 1.25× and 0.75× cut-offs for ‘up’ and ‘down’ are arbitrary, so the picture shows the logic, not a real blot.
LC3-II marks the carrier, not its cargo, so confirm the interpretation with cargo. p62, a receptor destroyed with its cargo, often falls during short starvation and should build up with Drug D. Its level also depends on production, and long starvation can raise p62 production, so read it alongside LC3-II. A tandem red-and-green LC3 reporter adds location: lysosomal acidity quenches green fluorescence, so normal delivery gives red-only dots, while a block before fusion leaves red-and-green dots.
For a real LC3-II turnover assay, use the inhibitor at a saturating dose for a short enough time that accumulation stays in its linear range and secondary effects are limited. The estimate remains conditional on the inhibitor not changing carrier formation; Going deeper gives one way that assumption can fail.
The same two questions apply upstream, where proteins are made rather than destroyed. The second film picks up here: what the ER does when unfinished proteins arrive faster than it can fold or remove them.
Read the transcript of “When the ER Falls Behind”
Film transcript: When the ER Falls Behind
Chapter 1 asked of any pile: how fast does it arrive, and how fast does it leave? Now ask that inside the ER. What happens when unfinished proteins arrive faster than the ER can fold or remove them? Many secreted and membrane protein chains enter the ER through a channel called the translocon. Chaperones then help them fold. BiP grips exposed hydrophobic stretches.
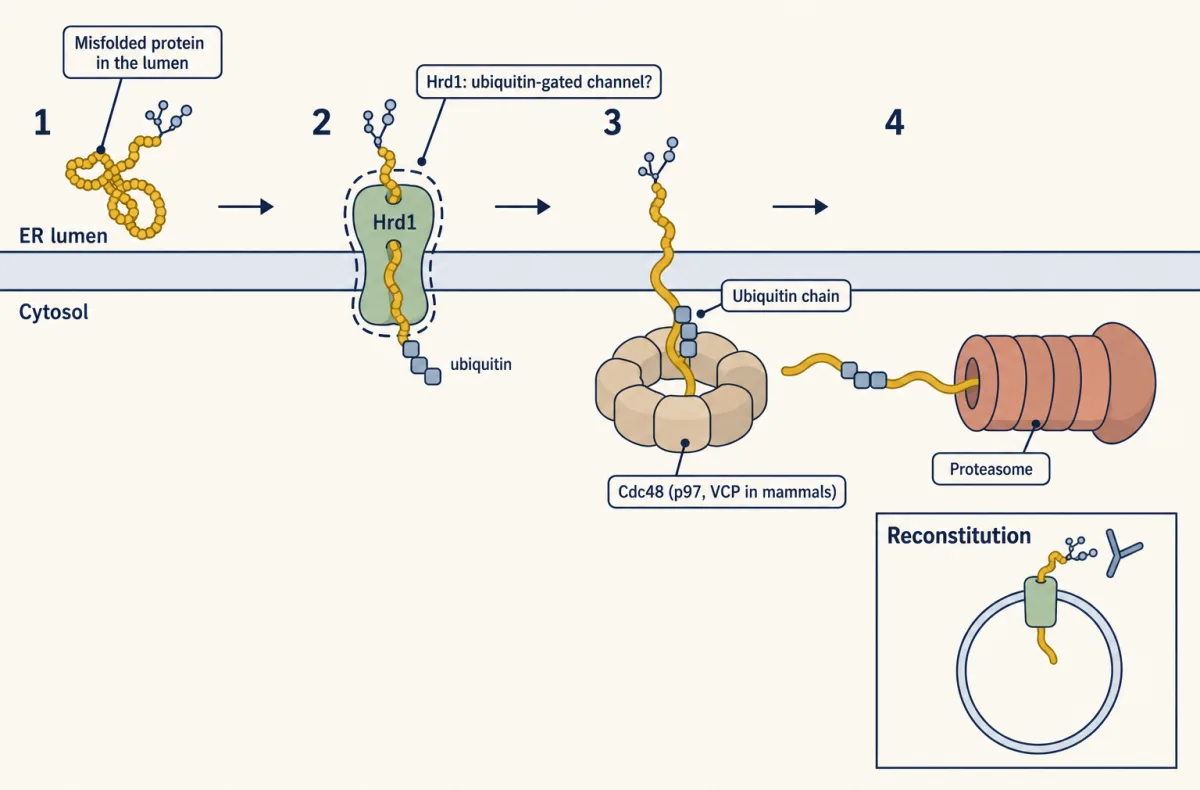
Lectin chaperones read sugar tags on many glycoproteins, supporting repeated folding attempts. Folded clients can leave for the Golgi. Some persistently misfolded clients enter ER-associated degradation, or ERAD. During return toward the cytosol, yeast Hrd1 adds a ubiquitin chain.
Cdc48 extracts the tagged client for destruction by the proteasome. Now count the flows. Arrival is ER-destined chains entering. Clearance is folding and export, plus removal by ERAD. When chains arrive faster than both exits can take them, unfolded proteins build up. The ER senses that stress and raises an alarm. This alarm is the unfolded protein response. Look at the equation. Which flows could the response change to bring the load down?
It can change both sides. In mammals, a sensor called PERK slows the making of most new proteins, so less arrives. The response also increases folding helpers and removal machinery. Less in and more out let the load fall. Mammals have three branches.
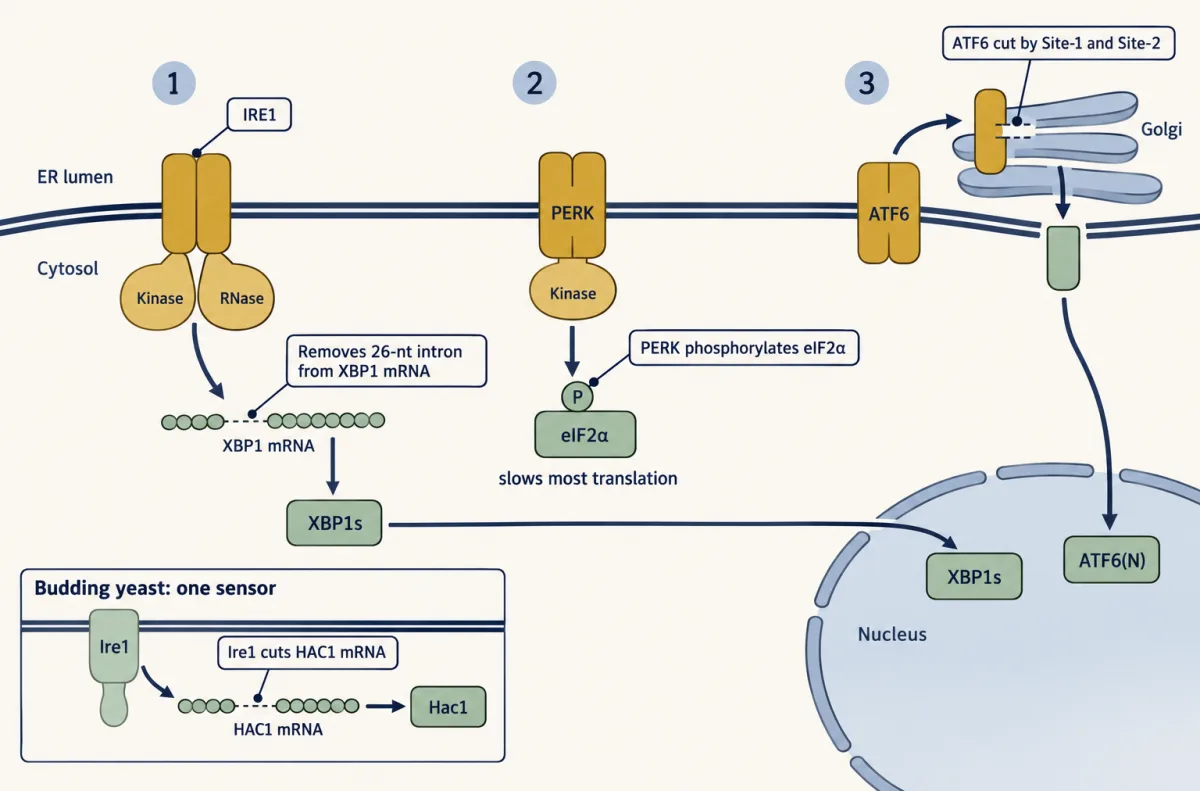
IRE1 splices the XBP1 message. PERK slows translation. ATF6 travels to the Golgi, where proteases release its transcription factor domain. Yeast relies on one ER-stress sensor, Ire1. The response buys time, but has limits. Persistent stress can also drive cell death. The ER can retry clients, remove them, slow arrival, or raise capacity. These moves rebalance arrival and clearance. When folding falls behind, reduce arrival and expand capacity.
From the film
- Many secreted and membrane protein chains enter the ER and fold with chaperones such as BiP; folded clients can leave for the Golgi.
- A persistently misfolded client can enter ERAD: it is moved toward the cytosol, ubiquitinated, extracted and destroyed by the proteasome.
- When unfolded proteins arrive faster than the ER can clear them, the unfolded protein response slows arrival and raises capacity.
- Mammals have three UPR branches, IRE1, PERK and ATF6; budding yeast relies on one ER-stress sensor, Ire1.
- If ER stress is not relieved, the response can also drive cell death.
The ER: retry, remove, raise capacity
The same moving-pool logic applies upstream: the ER can retry a folding client, remove it, slow new arrival or raise capacity. Its lumen is the folding compartment for secreted and membrane proteins (see protein sorting). A new chain enters through the translocon, a protein-conducting channel. BiP, an Hsp70-family chaperone, binds exposed hydrophobic stretches and helps it fold. What the second film left out is the sugar code its other chaperones read. Many entering proteins receive an N-linked glycan, a branched sugar tree attached to asparagine with three glucose residues at its tip. Glucosidases remove two. When one remains, the lectin chaperones calnexin, which is membrane-bound, and calreticulin, which is soluble, bind that sugar and hold the client for another folding attempt. Glucosidase II removes the last glucose and releases the protein.
Now comes the test. UGGT recognizes features of a still-non-native client and adds one glucose back. That glucose is not a permanent label for a bad protein; it is a ticket for another round with calnexin or calreticulin. A client that has reached its native state is not reglucosylated and can leave for the Golgi.
Predict. A client is released from calnexin but still exposes non-native features. What happens to its glycan, and where does the client go next?
Check your prediction
UGGT adds one glucose back. The client can bind calnexin or calreticulin again and remains in the ER for another folding attempt. The glucose does not send it directly to the proteasome.
A client that cycles too long can be diverted to ER-associated degradation (ERAD). In the standard account, trimming mannose residues from its glycan helps mark it. ERAD must move the failed client from the ER lumen toward a proteasome in the cytosol. The return trip across the ER membrane is called retrotranslocation. Hrd1 is a yeast ER-membrane E3 ligase that adds a ubiquitin chain as the client moves toward the cytosol. The ATP-powered extraction machine Cdc48—p97 or VCP in mammals—pulls out the ubiquitinated client for delivery to the proteasome. The exact channel and the limits of the yeast reconstitution are in Going deeper.
Predict. In a cycloheximide chase, the drug cycloheximide stops protein synthesis so disappearance of an existing protein can be followed. An ERAD substrate falls by half every 20 minutes in wild-type yeast. What remains after 60 minutes, and what should happen if Hrd1 is required for its degradation?
Check your prediction
Three half-lives leave one eighth, or 12.5%, in wild type. If Hrd1 is required for degradation, the band should fade much more slowly in the mutant. The stable band does not show that folding improved; a chase measures disappearance after synthesis stops.
When failures arrive faster than the ER can handle them, the unfolded protein response (UPR) raises folding and disposal machinery and, through PERK in mammals, slows the incoming load of new proteins. If stress is not relieved, the response can also drive cell death; how it does so is covered in cell death. In budding yeast, the single ER-stress sensor Ire1 cuts an intron from HAC1 mRNA so the Hac1 transcription factor can be made. The three mammalian branches:
- IRE1 removes a 26-nucleotide intron from XBP1 mRNA, as shown for mouse XBP1, producing the active transcription factor XBP1s.
- PERK phosphorylates eIF2α on serine 51, slowing most translation while permitting preferential translation of ATF4 (see stress signals).
- ATF6 travels to the Golgi, where Site-1 and Site-2 proteases cut it to release a transcription factor.
Selective autophagy: choosing a mitochondrion
The first film wrapped a damaged mitochondrion without asking how it was picked; selective autophagy is how that cargo is chosen. In selective autophagy, receptors link chosen cargo to the LC3 family. Mitophagy is selective autophagy of mitochondria.
One well-tested route begins when a mitochondrion loses its membrane potential, the voltage across its inner membrane. In cultured cells, the kinase PINK1 is broken down on healthy, polarized mitochondria but builds up on depolarized ones and recruits Parkin, a ubiquitin ligase. Parkin adds ubiquitin to outer-membrane proteins, and ubiquitin-binding receptors recruit the autophagy machinery that engulfs the mitochondrion.
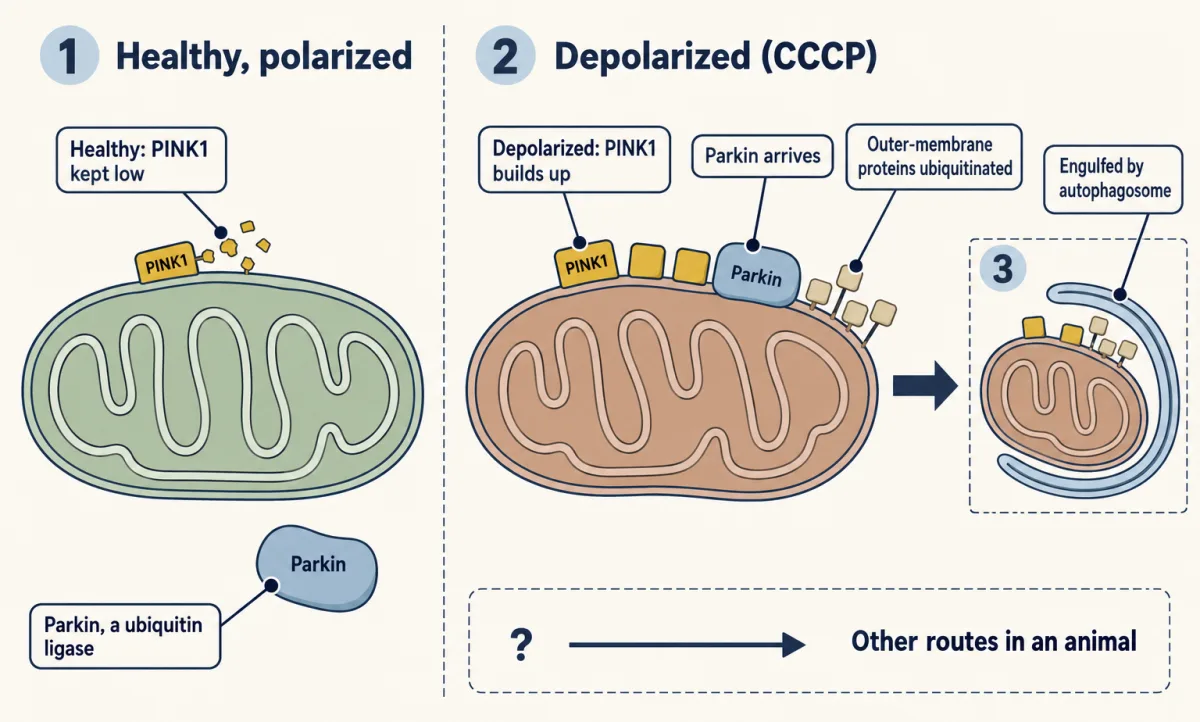
Predict. In mouse fibroblasts lacking Atg5, a protein needed for conventional autophagosome building, Parkin still gathers on depolarized mitochondria, but the mitochondria remain. Which step needs Atg5: Parkin recruitment, mitochondrial clearance, or both?
Check your prediction
Clearance needs Atg5, but recruitment does not. Parkin still arrives, so tagging is upstream of conventional autophagosome building. The mitochondria remain, so a tag alone does not remove the cargo.
PINK1 and Parkin are a well-proven route for damaged mitochondria in cultured cells, not the only route in an animal. Going deeper adds the amplification step and the experimental limits behind that conclusion.
Design problem
The ER’s two systems from the second film, a disposal route and a stress alarm, can fail separately, and telling which one broke is a design problem.
A mutant yeast strain accumulates a misfolded ER membrane protein. Is ER-associated degradation (ERAD) blocked, or is the unfolded protein response (UPR) broken? Design experiments that tell the two apart, and write down what each model predicts before you run them.
Predict. The substrate is stable in a cycloheximide chase, but tunicamycin, which blocks N-glycosylation, still triggers normal HAC1 mRNA splicing, a yeast UPR readout. Which model is favoured, and why?
Saved in this browser only.
Check your prediction
An ERAD block is favoured. The stable substrate shows slow destruction, while normal HAC1 splicing shows that the Ire1 step of the UPR can still signal. The pair of results is stronger than either alone.
One way to do it
An ERAD defect predicts normal synthesis, slow destruction and an intact UPR that may already be active. A UPR defect cannot raise folding and disposal capacity, so buildup may emerge mainly under stress while the alarm stays silent.
- Cycloheximide chase. Stop synthesis and blot for the substrate at 0, 30, 60 and 90 minutes. A stable band in unstressed cells points to an ERAD block. Near-normal decay that slows only under stress points to the UPR. The chase alone cannot settle it: yeast need an intact UPR for efficient ERAD, so a UPR mutant can also degrade the substrate slowly. Step 3 decides.
- Ubiquitination. Immunoprecipitate the substrate and blot for ubiquitin. No ubiquitin suggests a defect at or before tagging, such as loss of the E3 (Hrd1); ubiquitinated substrate stuck in membranes suggests a later step, such as extraction by Cdc48.
- UPR reporter. Treat with tunicamycin and measure HAC1 mRNA splicing by RT-PCR, or use a reporter that produces a measurable signal when a UPR regulatory element turns on. No splicing means the UPR is broken; normal splicing means at least the Ire1 step works.
- Complementation and rescue. Transform the mutant with plasmids carrying candidate genes such as HRD1 or IRE1. The gene that restores normal degradation (or normal splicing) is the lead candidate. Rescue alone is not proof, because extra copies of one gene can suppress a defect in another: overexpressed APG1 rescues an apg13 mutant. Sequencing the mutant allele, or remaking the mutation in a clean strain, shows that this mutation, not a second hit elsewhere, causes the phenotype.
If the chase, the ubiquitin blot and the rescue all point to HRD1, and splicing is normal, ERAD is blocked. If splicing fails and IRE1 rescues, the UPR is broken.
Going deeper
These refinements show where the picture is client-dependent, where routes overlap and where an assay can mislead.
UPR discovery and branch overlap
Jeffery Cox, Caroline Shamu and Peter Walter reported budding yeast Ire1 in 1993, in parallel with Kazutoshi Mori and colleagues. Ire1 spans the ER membrane and carries a kinase and a ribonuclease (RNase) on its cytosolic side; its cut in HAC1 mRNA occurs outside the spliceosome.
Mammalian branches overlap but can be separated experimentally. In mouse fibroblasts lacking IRE1α, ATF6 was still cleaved, and tunicamycin, which blocks N-glycosylation, still induced BiP mRNA. One broken branch does not silence the response.
The glycan cycle is client-dependent
The calnexin and calreticulin cycle has been followed in detail for particular clients. In HEK293-derived cells it was followed for the IGF-1 receptor, and the two human UGGT enzymes preferred different substrates. The retry loop is therefore a useful core model, not a claim that every client or UGGT behaves identically.
Route overlap and flux limits
The proteasome cannot admit an intact organelle or large aggregate through its narrow pore; an individual substrate must be engaged and unfolded. Lysosomal routes can accept bulk cytoplasm and organelles, but cargo is not assigned by size alone, and a single protein does not automatically imply proteasomal degradation.
A lysosomal inhibitor can itself change carrier formation, for example by altering lysosomal mTORC1 signalling. That would break the worked problem’s assumption that arrival remains unchanged during the block.
The Hrd1 channel: reconstitution and structure
In 2016 Ryan Baldridge and Tom Rapoport put purified yeast Hrd1 and a membrane-anchored misfolded substrate into synthetic lipid vesicles. Hrd1 ubiquitinating itself triggered movement of the substrate across the membrane, and the results suggest that Hrd1 forms a ubiquitin-gated channel, with Cdc48 completing extraction. That is a reconstitution with yeast proteins. In 2020 a cryo-EM structure of the full yeast Hrd1 complex, from the same laboratory, refined the picture for luminal substrates: Hrd1 and its partner Der1 each form a half-channel, and the two face each other in a thinned patch of membrane. Whether every ER-associated degradation (ERAD) substrate in every cell crosses this way is not settled.
ER-phagy receptors
ER-phagy, the selective digestion of parts of the ER, uses several receptors. FAM134B, reported in 2015, was the first found in mammals. Another receptor, CCPG1, binds mammalian ATG8-family proteins and the autophagy protein FIP200 through distinct motifs. Mice with reduced Ccpg1 accumulate insoluble protein in the ER of pancreatic acinar cells.
PINK1 and Parkin: amplification and limits
PINK1 phosphorylates ubiquitin, which activates Parkin so that more ubiquitin accumulates on a damaged mitochondrial surface. Receptors such as optineurin and NDP52 bind the tagged mitochondrion and recruit autophagy machinery.
Derek Narendra, Atsushi Tanaka, Der-Fen Suen and Richard Youle reported Parkin movement to depolarized mitochondria in cultured cells in 2008. In 2010 the same laboratory reported that PINK1 was necessary and sufficient for Parkin recruitment in the cells tested. These experiments used uncouplers such as CCCP, which depolarize every mitochondrion at once, and largely overexpressed Parkin. Yet in reporter mice lacking Pink1, basal mitophagy in the sampled tissues was mostly preserved, with pancreatic islets the exception.
Counting mitochondria after Parkin
In HeLa cells exposed to CCCP for 48 hours, electron micrographs showed 0.62 mitochondrial profiles per µm² of cytoplasm without YFP-Parkin and 0.074 with it.
reduction = (0.62 − 0.074) / 0.62 = 0.546 / 0.62 = 0.881, so 88.1% lower
That compares mean two-dimensional densities in two groups of cells at one time. It is not a rate.
Your notes
Select any text in the lesson to highlight it or add a note to it. Your highlights and notes are saved in this browser and collected in your notebook.
This browser is not letting the site save anything (a private window or strict privacy settings), so highlights and notes will be lost when you leave the page.
How we measure it
Cycloheximide chase
Cycloheximide stops new protein synthesis, and samples taken over time are immunoblotted for one protein. The rate at which its band fades gives its degradation rate, separate from its rate of synthesis. A protein that stays stable in a mutant points to a block in its destruction.
LC3-II turnover (flux) assay
LC3-II, the lipid-linked form of LC3 on autophagosome membranes, is measured by immunoblot with and without a lysosomal inhibitor such as bafilomycin A1. The difference between the two shows how much LC3-II the lysosome destroyed in that time, which a single steady-state measurement cannot.
Mutant screen and complementation
Mutagenized cells are screened for a visible failure, such as no autophagic bodies in the vacuole. Crossing mutants and asking which pairs restore the normal phenotype sorts them into complementation groups, each normally corresponding to one gene.
Proteoliposome reconstitution
Purified membrane proteins are inserted into synthetic lipid vesicles, and the reaction is run with defined parts. Leaving out one part at a time, or using an inactive version, shows what each is required for in that minimal system.
Method films · the methods library
- Autophagic flux assay 2:52
- Binding assays: immunoprecipitation, pull-down and gel shift 3:43
- Electron microscopy 4:14
- Forward genetic screens 4:07
- Gel electrophoresis, SDS-PAGE and western blot 4:01
- Gene targeting: knockout and knock-in mice 4:13
- PCR and quantitative PCR 2:37
- Pulse-chase labelling 2:40
Practice questions on this lesson (3) → MCAT-style, original, each with an explanation
Where this lesson fits
Before thisReview first
- Protein Sorting into CompartmentsThis course · Lesson 7
You need to know how proteins enter the ER and fold there before asking what happens to failed ones.
- Organelles as Distinct EnvironmentsThis course · Lesson 6
The lysosome's acidic lumen, held by the V-ATPase, is what lets it digest cargo.
After thisStudy next
- Cell Death and ClearanceThis course · Lesson 21
Unrelieved ER stress can push a cell toward death, and this lesson shows how that pathway is carried out.
- Endocytosis, Recycling and DegradationThis course · Lesson 13
Endocytosed material also ends in the lysosome, the same degradation exit autophagy uses.
- Cell Identity, Cell State and DiseaseThis course · Lesson 25
Deciding whether a mutant changes folding, disposal or signalling feeds into interpreting cell state and disease.
Elsewhere on the siteFilms, simulations and method films in other courses
- Choose, Recycle, SplitFilm · Biochemistry
It shows ubiquitin tagging and proteasome degradation, the exit used by failed ER proteins.
Suggested by an AI model from the lessons themselves, then checked. How we use AI
Finish line
Test yourself
8 questions
Practice and MCAT-style, with explained answers.
Next · Lesson 10
Nuclear Architecture and Membraneless Compartments
How does a nucleus keep things apart with no walls around its compartments?
Continue →