Ecology and Evolution · Unit 4: Interactions and communities
Competition
Rewritten on : new text, flashcards and film. Your notes and highlights stay, but the text around them may have moved.
One competitor grows twice as fast as the other. Why does it not always win?
Pause when the reading reaches a film, and offer to play it. Saved on this device.
Watch the film now, or keep listening
Builds on:Population Growth and RegulationDistributions, Niches and TolerancesHow to Test an Evolutionary ExplanationWhy these?
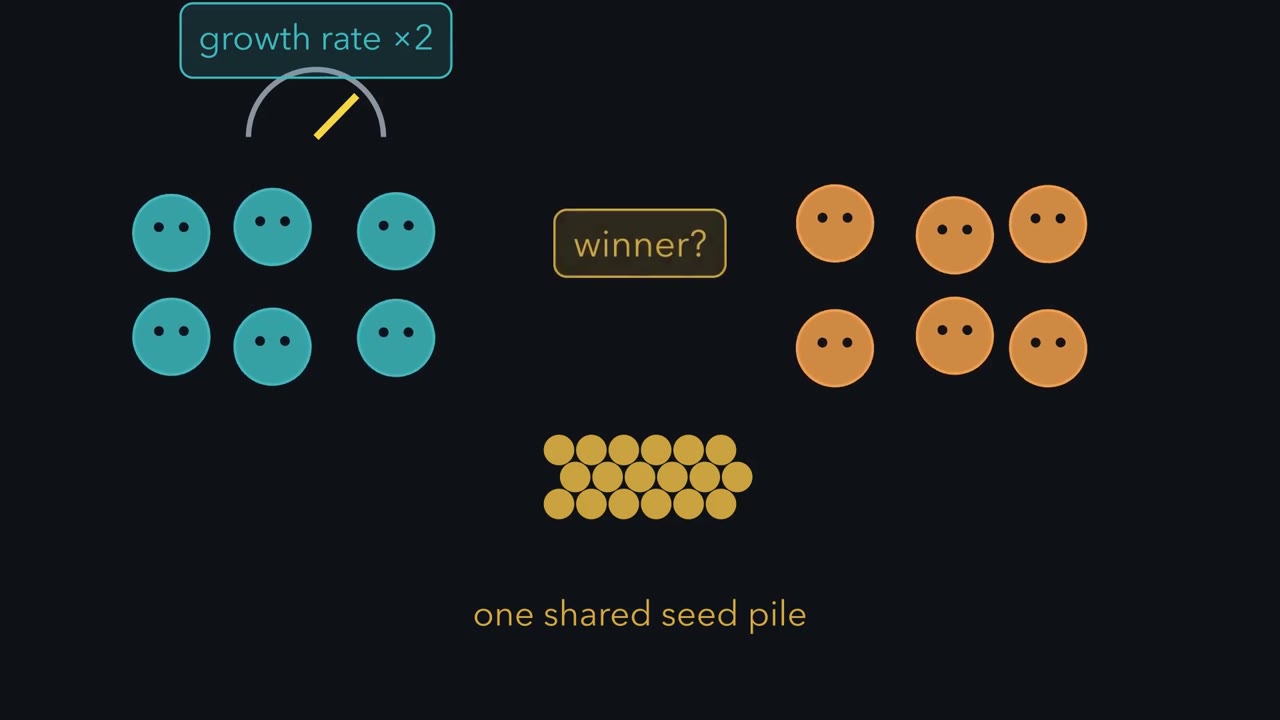 ▶ Watch Can It Grow When Rare? · 3:26
Read the transcript of “Can It Grow When Rare?”
Film transcript: Can It Grow When Rare?
Two species eat the same limited food, and one grows twice as fast. Must the faster one win? This film builds the test that decides. Start with the teal species alone. Its numbers rise toward its carrying capacity, Big K, the size it settles at alone. Picture that capacity as a bar of room that fills up. As the room fills, growth per individual slows. That is the per-capita growth rate, and it reaches zero when the bar is full. Now bring back orange. Each orange individual takes some of teal's room too. A number called alpha says how much, counted in teal individuals. Read the two numbers after alpha as on, then from. alpha12 is the effect on species 1, from species 2.
Orange has its own room bar, filled the same way. Now plot both species at once. Teal numbers run across, and orange numbers run up. The teal line marks every mix where teal stops growing. On one side teal grows; on the other it shrinks. That line is teal's isocline, its zero-growth line. Orange gets one too. Where the two isoclines cross, neither species changes. Is that crossing where they end up? Here is the test. Shrink teal to a few individuals, and let orange sit at its own carrying capacity.
Can teal grow? This is the invasion test. Here teal's arrow points away from zero, so rare teal grows. Swap roles, and rare orange grows too. Both pass. Every path that starts with both species present flows into the crossing. They coexist stably. Now make teal hurt orange more, so orange's line tilts. Rare orange, among a full teal population, now shrinks. Teal passes, orange fails, and orange slides to zero. Teal excludes it from this place. Cross the lines the other way, and neither passes. Each species wins from some starts, so the starting numbers decide. Back to the pair that coexist. Now double orange's growth rate, and change nothing else.
Does the ending change? The ending stays put. Orange moves faster and the paths bend, but they still finish at the same crossing. Here, growth rate changes the route, not the outcome. So in this model, the faster grower need not win. In words, each species must limit itself more than it limits the other.
Limits means the share of each room that one individual fills. So the whole verdict comes from one question, asked of each species. Can it grow when rare, beside a competitor at full strength?
From the film
- Competition lowers each species' per-capita growth, and alpha converts the other species into units of one's own kind.
- The invasion test asks whether a species can grow when it is rare and its competitor is at carrying capacity.
- In the model, with both species present: if both pass, they coexist stably; if only one passes, it excludes the other from that place; if neither passes, the start decides.
- The growth rate r is not in the rule, so it changes how fast and by what route the populations move, not which verdict the model gives: the faster grower need not win.
- In this model, both coexist stably when each can grow when rare: each limits itself more than it limits the other.
Two species eat the same limited food, and one grows twice as fast. Must the faster one win?
Not in the model below. The first film built the test that decides; this text puts numbers on it.
The one idea. Two competitors coexist stably when each can grow when it is rare and the other sits at its carrying capacity, the population size it would settle at alone. That is the invasion test, and in the Lotka-Volterra model below it decides the outcome.
Scope: a model of two species in one place, both present at the start, with fixed parameters, an unchanging, well-mixed environment and no other enemies or resources. Exclusion means loss from that one place, not from everywhere. Exact ties, where a rare species’ growth is exactly zero, are knife-edge cases this lesson sets aside.
Kinds of competition
Competition is an interaction in which individuals use a resource in short supply, so that each lowers the survival, growth or reproduction of the others. The resource can be food, water, light, nutrients or space.
Competition within a species, intraspecific competition, is already built into the logistic model in population growth: growth slows as numbers approach the carrying capacity K. Interspecific competition is the same pressure between species that share a resource.
Competition also differs by route. In exploitation competition the effect is indirect: each competitor uses up a resource, leaving less for the other. In interference competition one individual acts directly on another, by fighting, overgrowing, or holding a territory. Think of two flatmates and one fridge: exploitation is eating the food first, interference is a lock on the door.
Lotka-Volterra: the invasion test in numbers
The model named for Alfred Lotka and Vito Volterra extends the logistic to two species, each slowed by its own numbers and by the other’s, converted into its own units:
dN1/dt = r1 N1 [1 - (N1 + alpha12 N2) / K1] dN2/dt = r2 N2 [1 - (N2 + alpha21 N1) / K2]
Here N is a species’ number of individuals, r its maximum per-capita growth rate (growth per individual, per day), and K its carrying capacity (individuals). The competition coefficient alpha12, read on 1, from 2 as in the first film, is the effect of one species 2 individual on species 1, measured in species 1 individuals. If alpha12 = 0.5, two individuals of species 2 crowd species 1 as much as one of its own. Swapping the subscripts is the usual mix-up.
Worked problem. These values are invented for practice. Take r1 = 0.5 per day, r2 = 0.25 per day, K1 = 100 individuals, K2 = 80 individuals, alpha12 = alpha21 = 0.5, and start with N1 = N2 = 20. Assume constant parameters, no age structure (every individual counts the same, whatever its age) and no migration.
- Growth at the start. For species 1, dN1/dt = 0.5 x 20 x [1 - (20 + 0.5 x 20) / 100] = 10 x (1 - 30/100) = 7 individuals per day. For species 2, dN2/dt = 0.25 x 20 x [1 - (20 + 0.5 x 20) / 80] = 5 x (1 - 30/80) = 3.125 individuals per day. Both grow.
- Isoclines. An isocline is the line where a species’ growth is zero. For species 1 it is N1 + 0.5 N2 = 100, running from N1 = 100 on its own axis to N2 = 200. For species 2 it is 0.5 N1 + N2 = 80, running from N2 = 80 to N1 = 160. Substitute N1 = 100 - 0.5 N2 into the second: 50 - 0.25 N2 + N2 = 80, so 0.75 N2 = 30, N2* = 40 and N1* = 80. Check: 80 + 0.5 x 40 = 100 and 0.5 x 80 + 40 = 80.
- The invasion test. Species 1, rare among species 2 at its carrying capacity, grows at 0.5 x (1 - 0.5 x 80/100) = 0.3 per day. Species 2, rare among species 1 at N1 = 100, grows at 0.25 x (1 - 0.5 x 100/80) = 0.094 per day. Both pass. The two coexistence conditions are this same test, rearranged: K1 > alpha12 K2 is 100 > 0.5 x 80 = 40, and K2 > alpha21 K1 is 80 > 0.5 x 100 = 50. The model predicts stable coexistence at 80 and 40.
Predict. Raise alpha21 from 0.5 and change nothing else. How large can alpha21 get before species 2 fails the invasion test?
Check your prediction
Below 0.8. Species 2, rare among species 1 at N1 = 100, grows at 0.25 x (1 - alpha21 x 100/80), which is positive only while alpha21 x 100 is below 80. At alpha21 = 1.0 the rate is 0.25 x (1 - 100/80) = -0.0625 per day: species 2 cannot get started, while species 1 still can, so species 1 excludes species 2.
So species 2 already fails at 0.9, below 1. Comparing each alpha with 1 is a tempting shortcut that ignores how much room each species has.
The rule
The first film sorted the outcomes by who passes. In parameters:
- Both conditions hold: the species settle where the isoclines cross, stable coexistence.
- Only one holds: the species that passes excludes the other from this place.
- Both are reversed, K1 < alpha12 K2 and K2 < alpha21 K1: each species wins from some starts, so the starting numbers decide (Going deeper).
The film’s words, each species limits itself more than it limits the other, say the same thing. Read “limits” as the share of a species’ room that one individual fills. One individual of species 1 fills 1/K1 of its own room and alpha21/K2 of species 2’s room. Species 1 limits itself more when 1/K1 > alpha21/K2; multiply both sides by K1 K2 to get K2 > alpha21 K1, the condition for species 2 to pass.
Since r is not in the conditions, it cannot change the verdict (Going deeper covers where r still matters).
You can also click the plot to set the start point. Fixed: K1 = 100, K2 = 80 individuals; r1 = 0.5, r2 = 0.25 per day.
In this sketch: constant parameters, no age structure, no migration, and the two equations of the lesson are the only rules; the path steps the two equations forward 0.05 day at a time for 400 days, a choice of this sketch.
- Growth at the start, species 1 (individuals per day)
- Growth at the start, species 2 (individuals per day)
- Species 1 rare, species 2 at K2 (per day)
- Species 2 rare, species 1 at K1 (per day)
- Expected from the conditions
- Result of this run in the sketch, day 400
The outcome is set by two conditions, K1 > α12 K2 and K2 > α21 K1: both hold, coexistence; one holds, the other species is excluded; neither holds, the winner depends on the starting numbers. The growth rates r never appear in them. This picture is a sketch of the logic, not a prediction for real species.
Exclusion is a model conclusion
In the 1930s Georgii Gause grew Paramecium species alone, where each grew well, and together, where P. aurelia persisted and P. caudatum declined toward disappearance. Results like this were later summed up as the competitive exclusion principle, a name popularized by Garrett Hardin in 1960: two species limited by exactly the same resource cannot coexist indefinitely.
Treat that as a model conclusion, not a law: it is the case where at least one species fails the invasion test. It follows when there is a single limiting resource, a constant and well-mixed environment, populations that settle to a steady state, and nothing else holding the winner down. Real places often break those conditions with several resources, changing seasons, patchy habitat, or predators that hit the commoner species.
To catch a competitor keeping a species out of a place it could otherwise live, take the competitor away and watch.
Read the transcript of “What Keeps Chthamalus High?”
Film transcript: What Keeps Chthamalus High?
The first film built a test on paper: can a species grow beside its competitor? On a rocky Scottish shore, what keeps one barnacle out of the band just below it? At Millport, adults of the barnacle Chthamalus, in teal, live high on the rock. Another barnacle, Balanus, in orange, covers the rock below. A pattern like that has rival explanations.
Lower down, Chthamalus might not tolerate the longer time underwater. Its predators might be worse there, such as the whelk Thais. Or Balanus might be crowding it out. Joseph Connell tested the crowding explanation by changing it. He mapped patches of Chthamalus and split each map in two. A coin toss chose one half for removal. On that half, he removed every Balanus touching or surrounding a Chthamalus. The other half stayed untouched, with its Balanus in place, at the same height and in the same weather. Then he came back at intervals and recounted the marked barnacles on both halves. The difference he intended between the halves was whether Balanus was there.
Suppose longer time underwater was what killed Chthamalus low on the shore, and Balanus did nothing. What would the cleared half show, compared with the untouched half? If immersion were the cause, both halves would do the same, since both spend the same time underwater. That is not what Connell found. Chthamalus kept free of Balanus survived well, at the shore levels he studied. He also watched how Chthamalus died.
Growing Balanus smothered it, undercut it and crushed it. That is interference competition, one barnacle acting directly on another, much of it for space on the rock. So at Millport, Balanus set the lower limit of Chthamalus. The band where Chthamalus could live reaches lower than the band where it does live. Those are its fundamental and realized niches. Keep the scope. This is one shore, one pair of species and one set of years. It does not say what sets barnacle limits on every coast. Its strength is the design, not the generality.
For a neighbour that stays put, like a barnacle, the design gives a field test. Remove it from a random half, and leave a matched half alone. If survival improves, and proper controls rule out other differences, the neighbour was limiting.
From the film
- At Millport, Chthamalus lives above Balanus, and longer immersion, predators or crowding by Balanus could each explain that boundary.
- Connell removed Balanus from a randomly chosen half of each mapped patch and left the other half untouched as the comparison, so better survival on the cleared half is strong evidence that Balanus limited Chthamalus.
- Chthamalus kept free of Balanus survived well at the levels he studied, and Balanus killed it by smothering, undercutting and crushing it.
- So at Millport, competition from Balanus set the lower limit of Chthamalus, whose fundamental niche reaches lower than its realized niche.
- It is one shore and one pair of species; its strength is the design, not the generality. Randomized, controlled removal: better survival is evidence the neighbour was limiting.
Connell’s barnacles: what the film left out
The second film followed Connell’s split-patch removal at Millport; the cages come in the design problem.
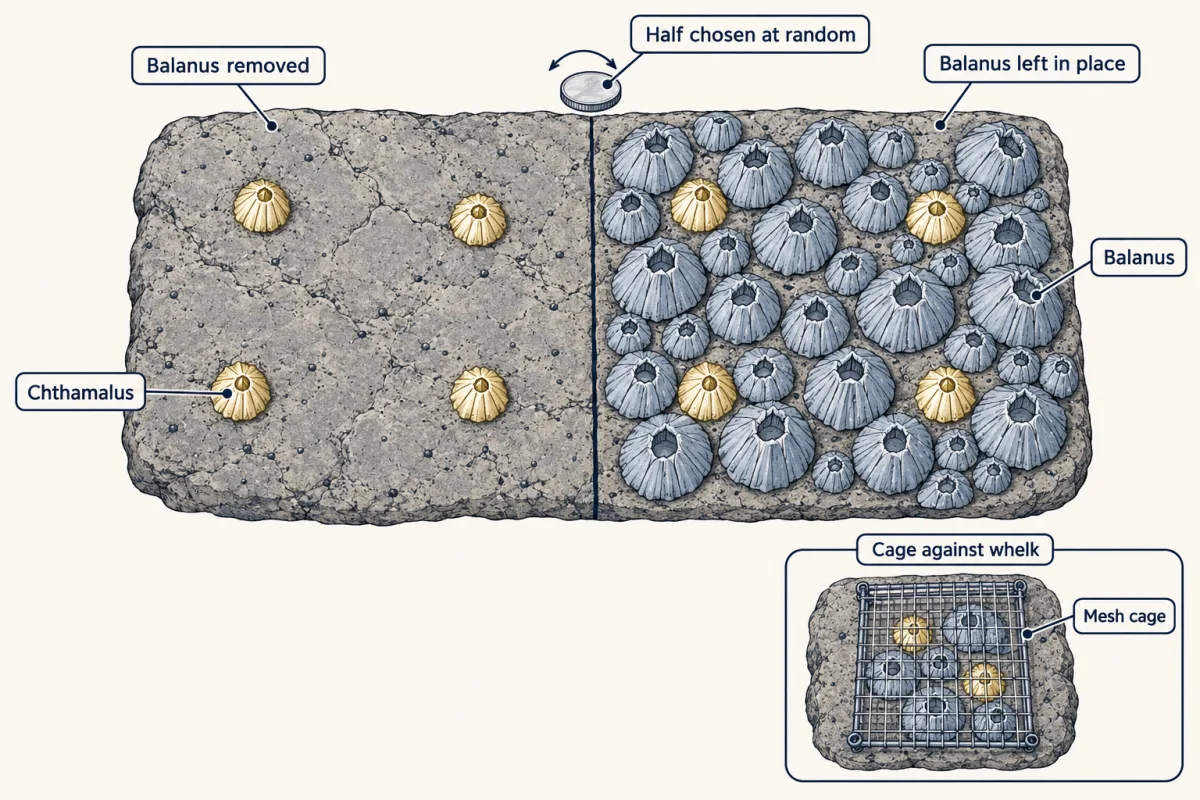
Why a coin. A person choosing by eye might pick the healthiest-looking halves for the removal. Random allocation removes that bias.
The niches. The fundamental niche (niches and distributions) excludes enemies as well as competitors, so Thais belongs in the realized-niche story too, though the cages found it ate few Chthamalus directly. And neighbours that help a species can widen its realized niche.
Partitioning and character displacement
Resource partitioning is the division of resources among species by type, place or time. Less resource overlap can, all else equal, lower the competition coefficients, and in the model lower alphas make it easier for each species to pass the invasion test. Robert MacArthur’s 1958 study of five warbler species in northeastern conifer forests found that they foraged in different parts of the same trees. The study was observational: no species was removed.
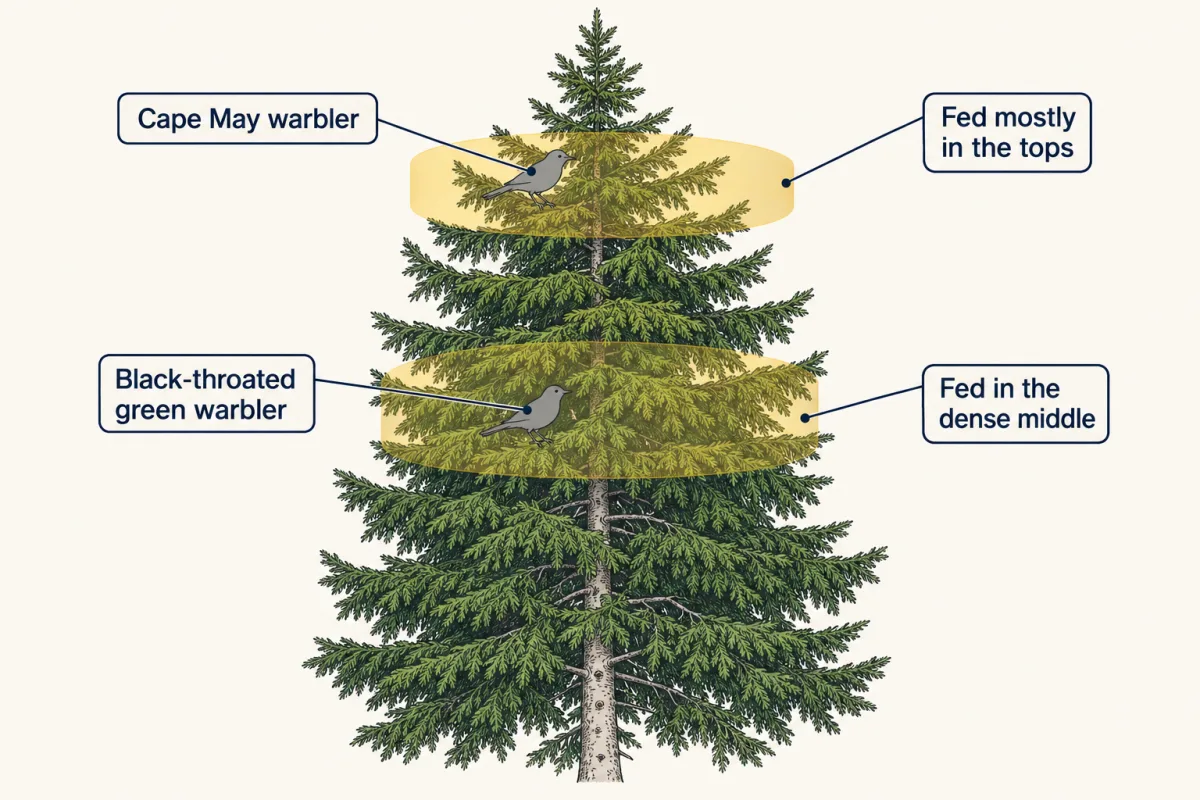
Partitioning has more than one possible cause. Past competition might have driven species apart. Each species might shift its behaviour when the other is present, which is plasticity. Or only species that already differed could settle together, ecological sorting: no species changed; the place admitted only those that differed.
Character displacement is evolutionary divergence between species caused by their interactions. Here it means ecological character displacement: divergence in a trait caused by competition for limited resources. A claim needs four kinds of evidence:
- The trait difference has an inherited basis, not just a response to surroundings. A difference that persists when populations are raised in the same environment, a common garden, supports this; heritability within one population does not by itself show that a difference between populations is genetic. Heritability of a trait like beak size is the subject of complex traits and GWAS.
- The trait affects how the organism gets its resource.
- Sorting is ruled out.
- Competition is the cause, not another change in the environment.
On Daphne Major in the Galapagos, Peter and Rosemary Grant reported that the medium ground finch, Geospiza fortis, diverged in beak size from the large ground finch, G. magnirostris, 22 years after magnirostris arrived, when the two species together severely depleted the food supply. It is a natural experiment: one island, one event, no random assignment, and a drought that coincided with the competition (see testing evolutionary explanations). Against the list: beak size is highly heritable, and the change was close to what that heritability predicted, which supports an evolved change (item 1); large beaks crack the large hard seeds (item 2); sorting is a poor fit, because one resident population changed (item 3). Item 4, competition rather than drought, is the hardest.
Predict. In a drought in 1977, before magnirostris had arrived, which fortis beaks did selection favour? And in 2004, with magnirostris taking the large hard seeds?
Check your prediction
In 1977, large-beaked fortis, which could crack the large hard seeds. In 2004, small-beaked fortis, so fortis beaks shifted smaller, away from magnirostris. That reversal points to competition, not drought alone.
Design problem
Connell also fitted cages over some patches to keep out the whelk Thais, which was present in the open patches. How do you read the caged against the open plots alongside the removal, and what two additions would you make?
Saved in this browser only.
One way to do it
The cages test a second cause. If Thais were eating Chthamalus directly, Chthamalus kept free of Balanus would survive worse in open patches than in caged ones. Connell found little sign of that except at the lowest level. But Thais preferred the larger Balanus, so in open patches at and below mid-tide it thinned the competitor and weakened the competition. Predation and competition interact, so read the cage and removal comparisons together: they still leave Balanus setting Chthamalus’s lower limit at Millport. Cages may not exclude every predator, so any conclusion should say how well the mesh worked.
What to add: a handling control, in which you prod around Chthamalus with the needle without removing anything, would check that disturbance alone does not change survival. That is your improvement, not part of Connell’s design. Then repeat the removal on other shores, with other wave exposure and tidal ranges, before claiming the result holds beyond this one coast.
Going deeper
Mortality and r
Abreu and colleagues (2019) saw a slower grower win in soil-bacteria microcosms at low dilution. Raising the dilution rate, which adds a death rate, reversed the winner. In this model an equal per-capita death rate d, smaller than both growth rates, shrinks each K by the fraction d/r, more for the slow grower; the alphas stay the same, so added mortality favours the faster grower. If d reaches a species’ r, it cannot persist even alone. They also found a coexistence-or-exclusion bistability that the basic model cannot produce.
When neither species passes
The line dividing the starts each species wins from is not equal numbers: with unequal K and alpha, a species can win from behind. This line also moves when the growth rates change, so here r can decide the winner from a given start. A start exactly on the line settles at the unstable crossing; any nudge tips it.
Species names
The Cumbrae Chthamalus stellatus is now identified as C. montagui; Balanus balanoides is now usually called Semibalanus balanoides; Thais is now Nucella lapillus.
Clusters, not spacing
Model work by D’Andrea and colleagues (2019) adds a twist to partitioning: in their simulations, competition for resources sometimes produced clusters of similar species rather than evenly spaced ones.
Your notes
Select any text in the lesson to highlight it or add a note to it. Your highlights and notes are saved in this browser and collected in your notebook.
This browser is not letting the site save anything (a private window or strict privacy settings), so highlights and notes will be lost when you leave the page.
How we measure it
Competitor removal with a randomized, untouched comparison
Remove one species from around marked individuals of another in a portion of each plot, chosen at random, and leave the rest untouched. A difference in survival or growth between the portions measures the effect of the removed competitor at that site.
Predator exclusion cages
Cover plots with mesh that keeps out a predator, and compare caged with open plots. This shows how many deaths the predator causes, provided the cage itself does not change conditions and the mesh actually excludes the predator. Crossing cages with competitor removal also shows whether the predator weakens competition by eating the competitor, as Connell found at Millport.
Monoculture and coculture in laboratory microcosms
Grow each species alone and in mixture under the same conditions, from several starting ratios. A species that persists alone but disappears in mixture is being excluded by its competitor, and different starting ratios show whether the outcome depends on where you start.
Long-term monitoring of a natural experiment
Measure the same wild population for many years, so that an unplanned event such as the arrival of a competitor can be compared with the years before it. It gives a before-and-after comparison without random assignment or replication.
Practice questions on this lesson (3) → MCAT-style, original, each with an explanation
Where this lesson fits
Before thisReview first
- Population Growth and RegulationThis course · Lesson 14
You need the logistic model and carrying capacity K from there, since this model adds a second species to it.
- Distributions, Niches and TolerancesThis course · Lesson 12
You need fundamental versus realized niche from there to read what Connell's barnacle removals show.
- How to Test an Evolutionary ExplanationThis course · Lesson 1
Its tests of evolutionary claims are used here to judge the evidence for character displacement in Grants' finches.
After thisStudy next
- Predation and Community EffectsThis course · Lesson 17
It extends the same two-species phase-plane approach to predators and prey, where one species' loss is the other's gain.
- Diversity, Disturbance and SuccessionThis course · Lesson 19
It uses competition and the coexistence conditions to explain how many species can share a place after disturbance.
- Mutualism, Parasitism and CoevolutionThis course · Lesson 18
It takes the two-species interaction model further by changing the sign of the effect one species has on the other.
Elsewhere on the siteFilms, simulations and method films in other courses
- One Tube, One Shared SupplyFilm · Life Science
It shows how a shared limited resource restricts populations, the starting idea of competition.
- One Forest, Different Ways to LiveFilm · Life Science
It shows how species that eat the same food share a place by using it differently.
- Share a tree with five kinds of birdsSimulation · Life Science
You can share one tree among five bird species and see partitioning of niches at work.
Suggested by an AI model from the lessons themselves, then checked. How we use AI
Finish line
Test yourself
8 questions
Practice and MCAT-style, with explained answers.
Next · Lesson 17
Predation and Community Effects
If predators eat prey, why do predator numbers keep climbing after the prey have started to fall?
Continue →