Ecology and Evolution · Unit 1: Evidence and evolutionary reasoning
New to this? Review it at high school level: Variation and Survival, Natural Selection and New Species
Natural Selection in Ecological Context
Rewritten on : new text, flashcards and film. Your notes and highlights stay, but the text around them may have moved.
On lichen-covered trees, birds find dark moths more easily than pale ones. Is that evolution yet, and what else would you need to know?
Pause when the reading reaches a film, and offer to play it. Saved on this device.
Watch the film now, or keep listening
Builds on:How to Test an Evolutionary ExplanationWhy these?
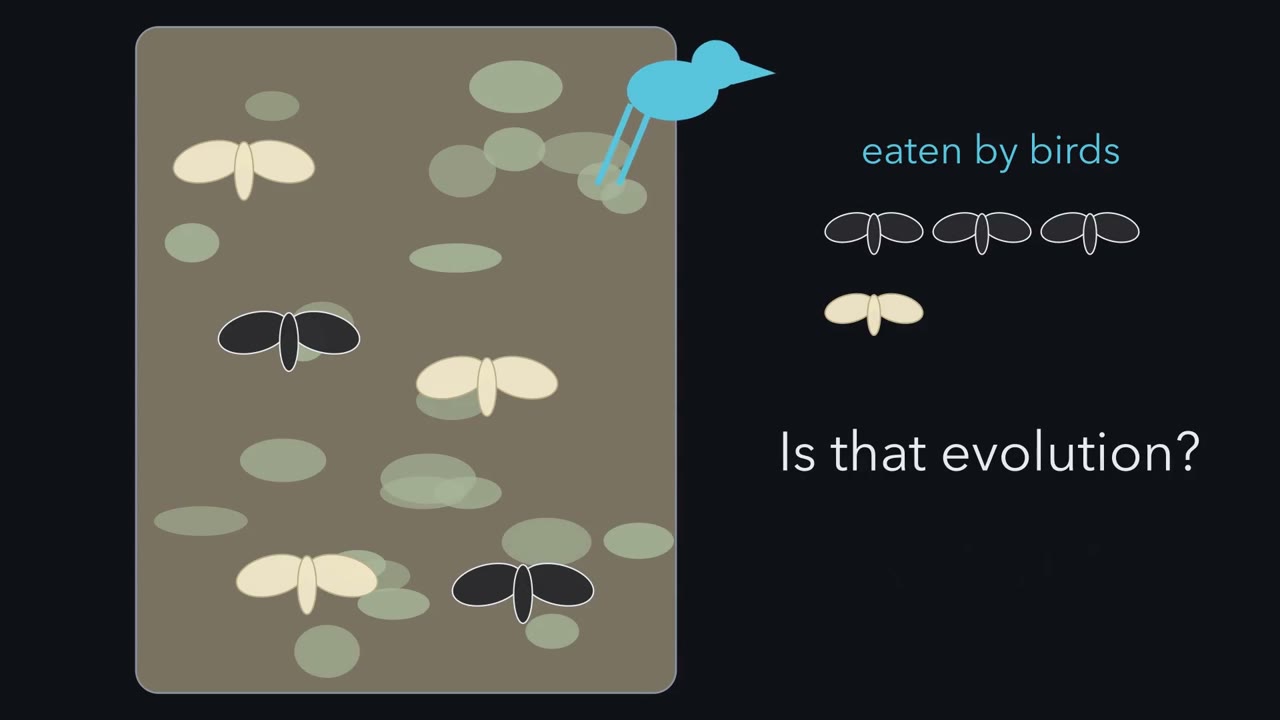 ▶ Watch Selection Has an Agent · 3:19
Read the transcript of “Selection Has an Agent”
Film transcript: Selection Has an Agent
Birds eat more dark moths than pale ones on these trees. Is that evolution? Not yet. This film builds the answer one piece at a time. Meet the peppered moth. It comes in two main colour morphs. A morph is one distinct form within a species. The pale morph is called typica. The dark morph is called carbonaria. Intermediate moths exist too, but we follow these two. Both rest by day on tree trunks. Birds hunt these moths by sight. On a trunk covered in pale lichen, the dark morph stands out. So birds find more dark moths than pale ones. The bird is the agent. The lichen-covered trunk is the environment. Fitness is reproductive success compared with other variants.
Here we measure one part of it, survival through a day. A dial shows the ratio: dark survival divided by pale survival. On lichen, the dial sits below one. Fitness is relative. What matters is how one morph does compared with another in the same place. Now change the environment, not the moths. In the 19th century, air pollution killed the lichens around British industrial cities. Soot coated the bark. On dark bark, the pale morph stands out instead. The dial swings above one, and the dark morph became common there. Then, in the late 20th century, air pollution fell and the lichens grew back. Which morph do the birds now take more often?
The dark morph again. It stands out on lichen, so the dial swings back below one, and carbonaria declined. Same moth, same birds. A different environment favoured a different colour. Fitness belongs to the moth in a place. Notice what the birds did not do. They did not make any dark or pale moths. Like a sieve, they sorted moths that already existed. That sorting, within one generation, is selection. A drought does not create deep beaks either. It removes more of the shallow ones. Is it evolution yet? Only if offspring resemble their parents. Picture two futures. In one, colour is inherited, and the young of the survivors can carry some of the shift. In the other, colour is not inherited, so the shift need not pass to the young.
So a full selection argument has four parts. Variation, inheritance, a fitness difference, and an agent in an environment. An agent sorts variants by fitness. Inheritance carries the sorting forward.
From the film
- Natural selection is a difference in reproductive success among variants that already exist, caused by an agent in an environment, such as a predator.
- Which variant is favoured depends on the environment: on sooty bark birds took more pale moths, on lichen more dark ones.
- Fitness is relative: what matters is how one morph does compared with another in the same place.
- Selection sorts within one generation; inheritance carries the sorting forward, so it becomes evolution only if the sorted variation is inherited.
Birds taking more dark moths than pale ones is not yet evolution: the first film ended on the four parts a selection argument needs (variation, inheritance, a fitness difference, and an agent in an environment). This text adds how to measure the fitness difference, what it does to a population, and how to read selection on a trait that comes in a range of sizes.
The one idea. Natural selection is a difference in reproductive success among variants that already exist, caused by an agent in an environment; inheritance carries the sorting forward. You measure selection as a fitness ratio between variants, and the way that ratio changes along a trait names the mode of selection.
Measuring the fitness difference
Fitness is reproductive success relative to other variants in a given environment. Relative fitness is one variant’s fitness divided by the average, or by a reference variant’s. You rarely measure lifetime reproduction directly, so you measure a fitness component: survival over a stated period, mating success, or fecundity (number of eggs or young).
Selection is a difference in fitness among phenotypes (the observable forms of a trait) within one generation. Evolutionary response is the change across generations, and it happens only to the extent that the selected variation is inherited. A trait can be strongly selected and not change at all if its variation is environmental. The size of the response belongs to population genetics and complex traits.
Peppered moths and birds
The first film introduced the peppered moth, Biston betularia, and its pale typica and dark carbonaria morphs. (Intermediate insularia morphs also exist; the experiment below used only typica and carbonaria.) It did not show how differently birds see them: Walton and Stevens (2018) measured the match with models of bird vision: typica is a close match to lichen, while carbonaria is poorly matched to lichen and closer to plain bark in lightness.
How big is the difference, and what does it do?
Earlier experiments had been criticised for how moths were released, so Michael Majerus repeated the work near Cambridge over six years. He released live moths of both morphs and counted a moth as eaten if it was gone four hours after sunrise; only about a quarter of those disappearances were seen as bird attacks. Cook, Grant, Saccheri and Mallet (2012) analysed his records.
On each day, a dark moth’s chance of surviving was about 0.91 times a pale moth’s: the first film’s dial, now with a number. The selection coefficient, s, states it as a shortfall from 1: s = 1 − 0.909 = 0.091 per day against carbonaria. It compares the two morphs; it is not the share that died, not an annual decline and not a figure for all of Britain. It holds for one site, over those years, with birds as the agent.
Predict. Start with equal numbers of each morph on lichen-covered trunks. After five days of this selection, are dark moths about 45%, 38% or 5% of the survivors?
Check your prediction
About 38%. Work in odds, the number of dark moths per pale moth. Equal numbers give odds of 1 : 1. One day multiplies them by 0.909, to 0.909 : 1. Five days give 0.9095 = 0.62 : 1. To turn odds into a share, divide by the total: 0.62 / 1.62 = 0.38. Only the ratio mattered, not the number of moths or a pale moth’s survival. A common slip is 0.5 × 0.62 = 0.31, which treats the pale moths as if all survived and mixes survivors with starting numbers; the share must be taken among the survivors.
In general:
odds of dark : pale after t days = starting odds × (1 − s)t
Each day multiplies the odds by the ratio of the two morphs’ fitnesses, wdark / wpale = 1 − s. The rule assumes two morphs, a ratio steady over the interval, and no births or migration, and it gives shares among one generation’s survivors: still selection, not evolution. Turning the 38% into a change in allele frequency needs the dominance model in population genetics, because carbonaria is dominant and a dark moth can carry one or two copies.
The moth ratio pointed one way, at one site. Most traits come in a range of sizes, and then the ratio changes along the trait: the shape of the curve of relative fitness against trait size names the mode. The second film builds that curve, in a simple model, for a gall caught between two enemies.
Read the transcript of “Two Enemies, One Gall”
Film transcript: Two Enemies, One Gall
In the first film, birds made one moth morph survive better than the other. Now take a gall. If wasps attack small galls and birds attack large ones, which gall is safest? The goldenrod gall fly lays an egg in a bud of tall goldenrod. The plant grows a round gall around the larva. The larva spends the winter inside. The gall is made by insect and plant together, and galls vary widely in size. Line the galls up by size, small on the left, large on the right. Above them we will draw relative fitness. That is how well larvae in galls of each size survive, compared with the average. A point above the dashed line means better than average. From the left come the wasps.
A parasitoid develops on or in a host and ultimately kills it. This parasitoid wasp attacks larvae in small galls more than in large ones. Many small galls go dark. From the right come the birds. Birds more often peck open the large galls and take the larva inside. Many large galls go dark too. So the middle survives best, with two named enemies pressing from opposite sides. Take a simple model where the two enemies are equally strong. The fitness curve rises, peaks over intermediate galls, and falls again.
Favouring the middle over both extremes is called stabilizing selection. Below, the spread of gall sizes narrows. Now, in the model, make wasp attack heavier than bird attack. Does the average surviving gall stay in the middle?
No. In the model, the peak slides toward larger galls, away from the stronger enemy. The spread still narrows, but the average moves up. Favouring one end like this is directional selection. So one trait can carry a stabilizing and a directional component at once. A field study found this pattern in central Pennsylvania, across twenty fields over two years. Parasitoid attack was more frequent than bird attack in those fields. Intermediate galls survived best, and selection also favoured larger galls. Now flip the hump into a dip. The middle does worst, and both ends do better. That shape is called disruptive selection.
Theory predicts it when individuals crowd onto the commonest resource, and those that use something different do better. One end, the middle, or both ends. Directional, stabilizing and disruptive are shapes of one curve. They are not boxes a trait must fit. So read the curve first, then name the mode.
From the film
- For a trait with a range of values, plotting relative fitness against the trait shows the mode of selection.
- Favouring one end is directional, favouring the middle is stabilizing, and favouring both ends is disruptive.
- In goldenrod galls, wasps took more larvae in small galls and birds more in large ones, so intermediate galls survived best.
- Because wasp attack outweighed bird attack in those fields, selection also favoured larger galls: one trait carried two components.
Gall flies: two modes in one trait
Abrahamson, Sattler, McCrea and Weis (1989) found the second film’s pattern, stabilizing selection with a directional component toward larger galls, in galls of the goldenrod gall fly, Eurosta solidaginis, whose parasitoid wasp was Eurytoma gigantea. The directional component’s mean intensity was 0.21 phenotypic standard deviations: the surviving galls’ mean sat about a fifth of the usual spread in gall size above the mean of all galls, a shift in the trait, not a death rate.
Predict. Two other enemies, a second parasitoid and a beetle, attacked galls of all sizes. Suppose one of them killed the same share of larvae at every gall size. Would it change the shape of the fitness curve?
Check your prediction
No, as long as that enemy acts on its own, multiplying survival at every size by the same factor. Relative fitness divides that factor out, just as the pale moths’ own survival dropped out of the moth calculation. An enemy changes the curve’s shape only if it takes some sizes more than others, or if its effect depends on what the other enemies do.
Disruptive: crowded sticklebacks
The second film ended on the dip, disruptive selection, predicted when individuals crowd onto the commonest resource. Bolnick (2004) tested that by making crowding the only difference. In each of five lakes he set a pair of enclosures of threespine sticklebacks, Gasterosteus aculeatus, one stocked at low density and one at high. The trait was gill raker length; gill rakers are bony projections on the gill arches that help sieve food, so their length relates to what a fish eats. Consistently across the lakes, the curve dipped more in the middle at high density. Because only crowding differed within each pair, crowding became a tested cause, within the limits of the fitness measure: body size and relative gonad mass, stand-ins for how many offspring a fish could produce, not lifetime reproduction.
When reading such a curve, check that the dip lies inside the measured data, not past its edge (see Going deeper).
Frequency-dependent: rare guppies
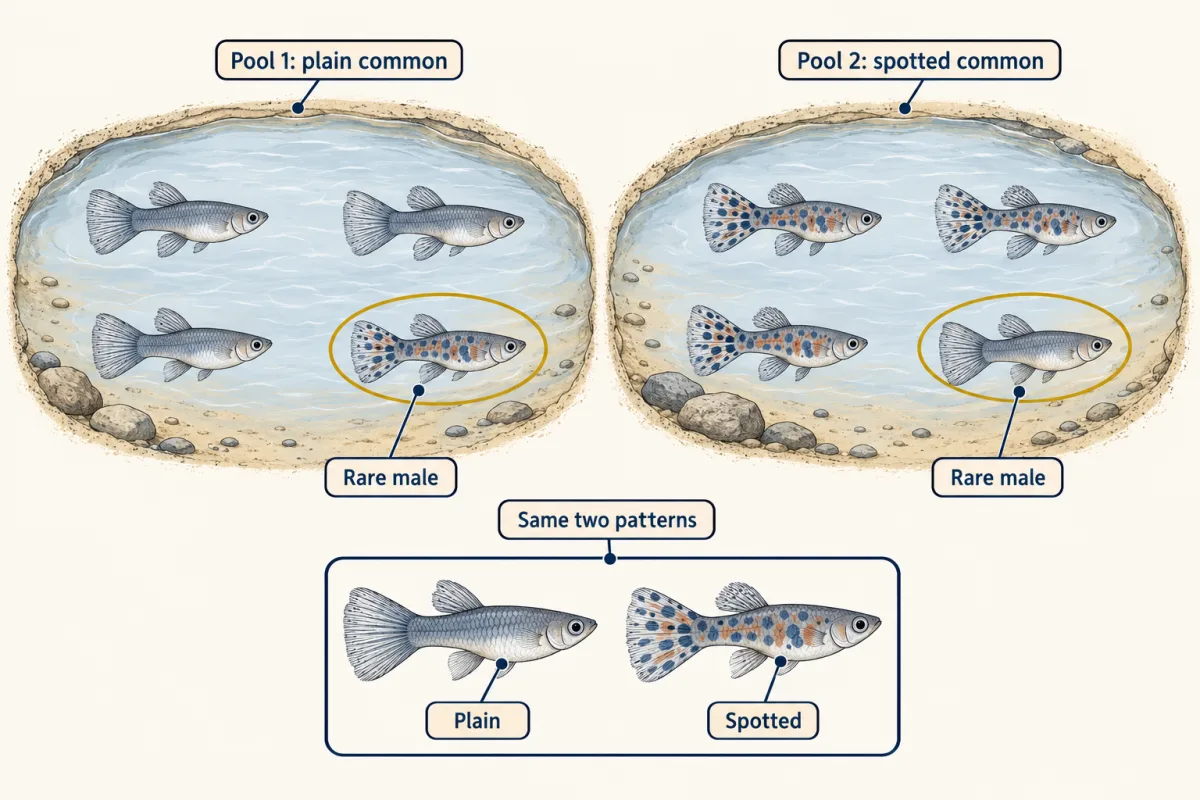
Negative frequency-dependent selection favours a phenotype when it is rare. Because the fitness ratio changes with the share, it can keep several variants in a population. A test must separate rarity from the phenotype. Olendorf and colleagues (2006) did this with male guppies, Poecilia reticulata, in three natural populations in Trinidad streams. They set male colour-pattern morphs at about 3 common to 1 rare, and reversed which morph was rare between replicate pools. After about two weeks (15 or 17 days, depending on the site), rare males had higher estimated survival, whichever pattern was rare. Recapture stands in for survival only if missing fish died rather than moved. Predators forming a search image for the common morph is one possible explanation, not a demonstrated one. The next generation was not measured, so this is selection, not an evolutionary response.
Design problem
Students propose that birds take rare colour morphs of a prey less often than common ones. Design a field test.
Saved in this browser only.
One way to do it
Use several comparable pools or plots, with morph A rare in some and common in others (for example 1 A to 3 B in half and 3 A to 1 B in the rest), so each morph is rare somewhere. Keep total density, habitat and season the same.
Mark every individual, release, and recapture after a set interval, such as two weeks. State the assumption that an individual not recaptured has died rather than emigrated. Reduce emigration with barriers, and detect it by searching neighbouring habitat. Search each pool until you have caught every individual you can, so both morphs are equally likely to be found.
The prediction is that whichever morph is rare survives better, in both sets of replicates. One colour doing better everywhere shows directional selection on colour but does not rule out frequency dependence too, so compare each colour’s survival when rare and when common. To test a mechanism, record whether predators take the common morph more than its share. A search image would produce that pattern, but so could other predator behaviours, so it supports a search image without proving one.
Keep the conclusion to its scope: one season of survival in these sites shows frequency-dependent selection, not an evolutionary response, which would need evidence that colour is inherited and data on the next generation.
Sexual selection: the widowbird tail
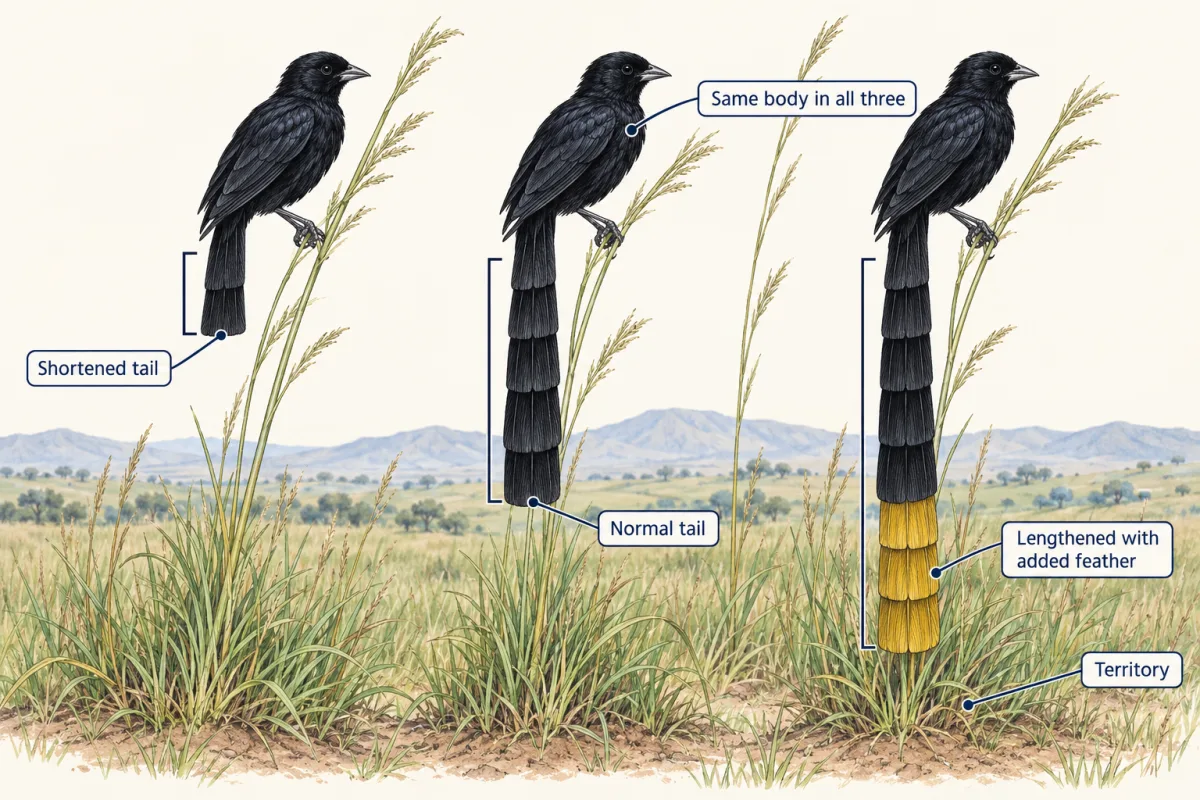
Sexual selection is selection through mating success, by competition for mates or by mate choice. Mating success is the fitness component here: a male with more females nesting on his territory can father more young. Male long-tailed widowbirds, Euplectes progne, carry very long breeding tails. Males that happen to differ in tail length may also differ in age or territory quality, so Andersson (1982) changed the tails of males in Kenya. Males given longer tails attracted more females to nest on their territories than males with normal or shortened tails.
Predict. Suppose the long-tailed males had also held their territories longer. What could you no longer conclude?
Check your prediction
That the tail acted through female choice. A territory held longer could gather more nests by itself, tangling the two effects.
In fact, males with shortened tails held their territories as long as the others, so the tail affected mating, not territory holding, which points to female choice. The experiment does not show why females prefer long tails, or a long-tailed male’s net lifetime fitness.
Going deeper
The moth numbers, worked
Worked problem. With invented numbers (1,000 moths of each morph, typica daily survival 0.80, no migration, reproduction or change in rates), carbonaria survives at 0.80 x 0.909 = 0.7272. One day leaves 800 typica and 727.2 carbonaria, so the dark share is 727.2 / 1,527.2 = 47.6%, down from 50%. The 0.80 and the 1,000s cancel: 0.909 / 1.909 gives the same 0.476.
carbonaria share after t days = 0.909t / (1 + 0.909t) (equal starting numbers)
The odds form works from any start: from 10% dark (odds 1 : 9), five days give 0.62 : 9, about 6.5% dark. A fractional survivor such as 727.2 is an expectation, not a moth.
| daily survival | expected survivors | random draw | |
|---|---|---|---|
| typica | 0.8000 | 800.0 | – |
| carbonaria | 0.7272 | 727.2 | – |
| carbonaria share | 47.6% | – | |
In this sketch: 1,000 typica and 1,000 carbonaria to start (all invented numbers), typica daily survival 0.80, no migration, no reproduction, rates constant. Fractional survivors are expectations. s is relative and per day. Resample: in this sketch each moth survives independently with the probability shown (a sampling model of this sketch, not from the study).
Rule to keep: carbonaria share after t days = (1 − s)t / (1 + (1 − s)t) for equal starting numbers. A change in morph share among survivors is not yet a change in allele frequency; that is left to the Genetics lesson.
How the moth estimate was made
Majerus released 4,864 moths near Coton, Cambridgeshire, over six years. Moths gone at the four-hour check were presumed eaten, although a missing moth may have flown away or been taken by a predator other than a bird; only about 26% of disappearances were witnessed bird attacks, and the rest were inferred. The likelihood 95% interval on s was 0.028 to 0.157; at its ends, five days from equal numbers leave about 46% or 30% dark, not 38%. The inheritance of colour has a known locus: van’t Hof and colleagues (2016) traced carbonaria to a transposable-element insertion in the cortex region. Later work in butterflies suggests that non-coding RNAs at the same locus, rather than cortex itself, control melanism there.
Reading a fitness curve
Studies usually fit relative fitness to a trait by regression. A significant positive quadratic term means the curve bends upward, but alone it does not show a fitness minimum among the trait values sampled. Picture a curve still falling, or just flattening, when the data run out: its low point lies outside the data, which show accelerating directional selection, not a dip. Martin and Pfennig (2012), working on Mexican spadefoot tadpoles, Spea multiplicata, from 15 ponds in Arizona and New Mexico, found that disruptive selection was the commonest form of curvature across the populations they studied, and strongest where competition within the species was most intense. They applied the established caution: look at the fitted curve, not only the coefficient.
Selection over time
The fitness ratio need not keep pointing one way. On Daphne Major in the Galápagos, Peter and Rosemary Grant measured selection on the beaks and bodies of two finch species from 1972 to 2001, and it ranged from consistently one-directional to oscillating (testing evolutionary explanations).
Your notes
Select any text in the lesson to highlight it or add a note to it. Your highlights and notes are saved in this browser and collected in your notebook.
This browser is not letting the site save anything (a private window or strict privacy settings), so highlights and notes will be lost when you leave the page.
How we measure it
Mark-release-recapture with manipulated frequencies
Marked animals are released, often with the composition of the group set by the experimenter, and later counted again. A difference in recapture between types is read as a difference in survival only if loss means death rather than emigration and both types are equally likely to be found, assumptions the design must state and, where possible, test.
Phenotype manipulation in the field
The trait or its frequency is changed (a tail lengthened or shortened, a prey made rare or common) in individuals assigned at random, so that it no longer travels with age, health or territory. A change in mating success or survival then points to the trait as the cause in that population.
Selection gradient and fitness-curve analysis
Relative fitness, or a stated proxy for it, is regressed on measured traits. Linear terms estimate directional selection and quadratic terms estimate curvature; partial regression separates correlated traits that were measured (unmeasured ones can still confound it), and a fitted spline shows whether a minimum or maximum actually falls inside the sampled range.
Paired density manipulation in enclosures
Enclosures in the same lake or field are stocked at different densities, so that place, season and source population are shared and only crowding differs. A difference in the selection pattern between paired enclosures can then be attributed to density.
Practice questions on this lesson (3) → MCAT-style, original, each with an explanation
Where this lesson fits
Before thisReview first
- How to Test an Evolutionary ExplanationThis course · Lesson 1
It separates selection within a generation from evolutionary response, the distinction this lesson uses throughout.
After thisStudy next
- Drift, Gene Flow and Competing ExplanationsThis course · Lesson 4
It sets chance change in morph share against selection, so you can judge which explains a data set.
- Life Histories and Evolutionary Trade-offsThis course · Lesson 10
It reads fitness components such as survival and fecundity as trade-offs, using the fitness idea built here.
- Predation and Community EffectsThis course · Lesson 17
It follows predators as the agent of selection on prey into effects on whole communities.
Elsewhere on the siteFilms, simulations and method films in other courses
- Moths and birdsSimulation · Life Science
The peppered moth case shows how a bird predator changes the share of dark and pale moths.
- Beak depth and a riverSimulation · Biology
A drought acts as the agent of selection, sorting finches by beak depth.
- How Populations ChangeFilm · Biology
It shows how inherited variation affecting reproductive success changes a population across generations.
Suggested by an AI model from the lessons themselves, then checked. How we use AI
Finish line
Test yourself
8 questions
Practice and MCAT-style, with explained answers.
Next · Lesson 4
Drift, Gene Flow and Competing Explanations
Sixteen flies bred each generation, yet the flies drifted as if there were only nine. Why?
Continue →