Ecology and Evolution · Unit 1: Evidence and evolutionary reasoning
New to this? Review it at high school level: Building a Tree of Life, Evidence for Evolution
How to Test an Evolutionary Explanation
Rewritten on : new text, flashcards and film. Your notes and highlights stay, but the text around them may have moved.
A drought killed most of an island's finches, and the survivors had bigger beaks. Is that evolution yet?
Pause when the reading reaches a film, and offer to play it. Saved on this device.
Watch the film now, or keep listening
Builds on:Natural Selection in ActionVariation and SurvivalWhy these?
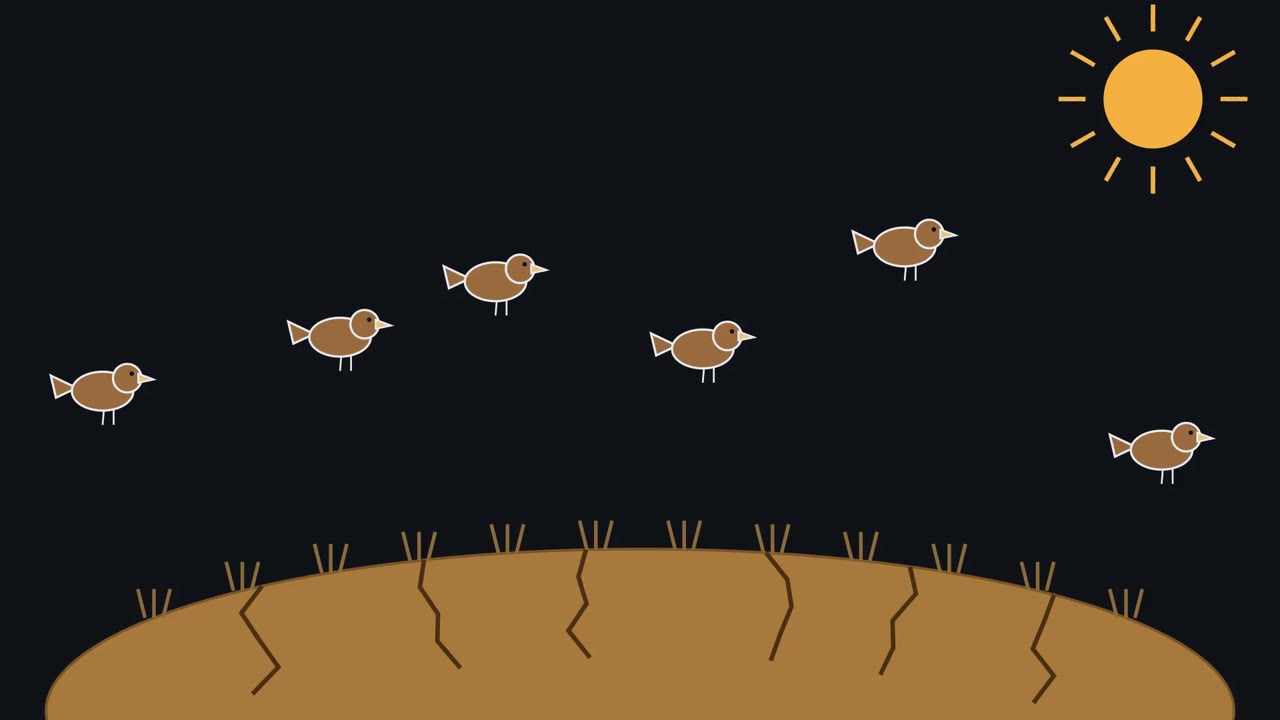 ▶ Watch Three Claims in One Drought · 3:20
Read the transcript of “Three Claims in One Drought”
Film transcript: Three Claims in One Drought
In 1977 a drought killed most of the finches on a small island, and the survivors had bigger beaks. Did the finches just evolve? The island is Daphne Major, in the Galápagos. Researchers had banded and measured nearly every medium ground finch living there. So they knew each bird's beak before the drought began. Picture each bird as a dot on a line of beak depth. Shallow beaks sit on the left, deep beaks on the right. Before the drought, the whole population makes this grey cloud. Then the drought comes. About 85 percent of the medium ground finches died. The survivors were not a random sample. Larger birds, especially males with larger beaks, survived best.
Why those birds? The food left on the island was mostly large, hard seeds. Something was sorting the birds, and the seeds that were left are the leading suspect. The survivors' average now sits to the right of the old average. That gap measures selection through survival. If the survivors breed about equally, it is the selection differential, called S. So is that evolution? Not yet shown. Survival tells you who lived. It cannot tell you what their chicks will look like. That depends on inheritance. Narrow-sense heritability, h², -squared, is the share of a trait's variation due to genes whose effects add up. That is the part that makes offspring resemble their parents.
It runs from 0 to 1, in one population and one environment. The survivors pair up and raise chicks. Suppose beak depth were not inherited at all. Where on the line would the survivors' chicks land? Right back under the old average, if the environment stays the same. However strong the selection, the chicks' average would not move at all. Turn the dial all the way to one, and the chicks' average lands on their parents' average. For most real traits the dial sits in between. The chicks' average moves only part of the way. That part is the response, called R. The breeder's equation says R = h² × S. It predicts how far the next generation's average moves.
So one sentence about a drought hides three claims. Selection happened. The trait is inherited. And the offspring changed. Each claim needs its own evidence. A survival record lights the first lamp. Comparing relatives lights the second. Only measuring the next generation lights the third. To show that selection changed a trait's average, you need all three.
From the film
- The 1977 drought on Daphne Major sorted the finches: survivors had larger beaks than the population before it.
- That gap measures selection through survival; if the survivors breed about equally, it is the selection differential S. It is not yet shown to be evolution.
- For one trait, the breeder's equation R = h² × S predicts how far the chicks' average moves: only part of the way, a fraction h² of S.
- If heritability were zero and the environment stayed the same, the chicks' average would not move, however strong the selection.
- Selection happened, the trait is inherited, the offspring changed: each claim needs its own evidence.
The first film split the 1977 drought on Daphne Major into three claims: selection happened, the trait is inherited, and the offspring changed. Here is the real evidence for each, then what the film left out.
Claim 1: selection happened
Natural selection is a consistent difference in survival or reproduction among individuals that differ in a trait. Its currency is fitness: reproductive success, the number of surviving offspring an individual leaves in a given environment.
Boag and Grant (1981) compared the 1977 survivors with the same banded population before the drought. Larger birds, especially males with larger beaks, survived best. That shows selection on the measured traits, or on traits correlated with them: beak size and body size go together, so survival alone cannot say which was the target.
That comparison measures only the survival part of selection. The selection differential that predicts the chicks, S, is the mean of the parents, each counted once for every offspring it contributed, minus the mean of the population before selection. The survivor difference equals S only if the survivors contribute about equally, as the worked examples below assume.
Claim 2: the trait is inherited
This needs a comparison among relatives, which survival data lack. Plot each chick’s adult beak depth against the average of its two parents, the mid-parent value. If deep-beaked parents have deep-beaked chicks, the points rise from left to right. The slope, how many millimetres the chick’s beak rises for each millimetre the parents’ average rises, estimates the film’s dial, narrow-sense heritability (h²), but only if parents and chicks do not share an environment that also shapes the trait. On Daphne Major these regressions gave high heritabilities for beak and body size.
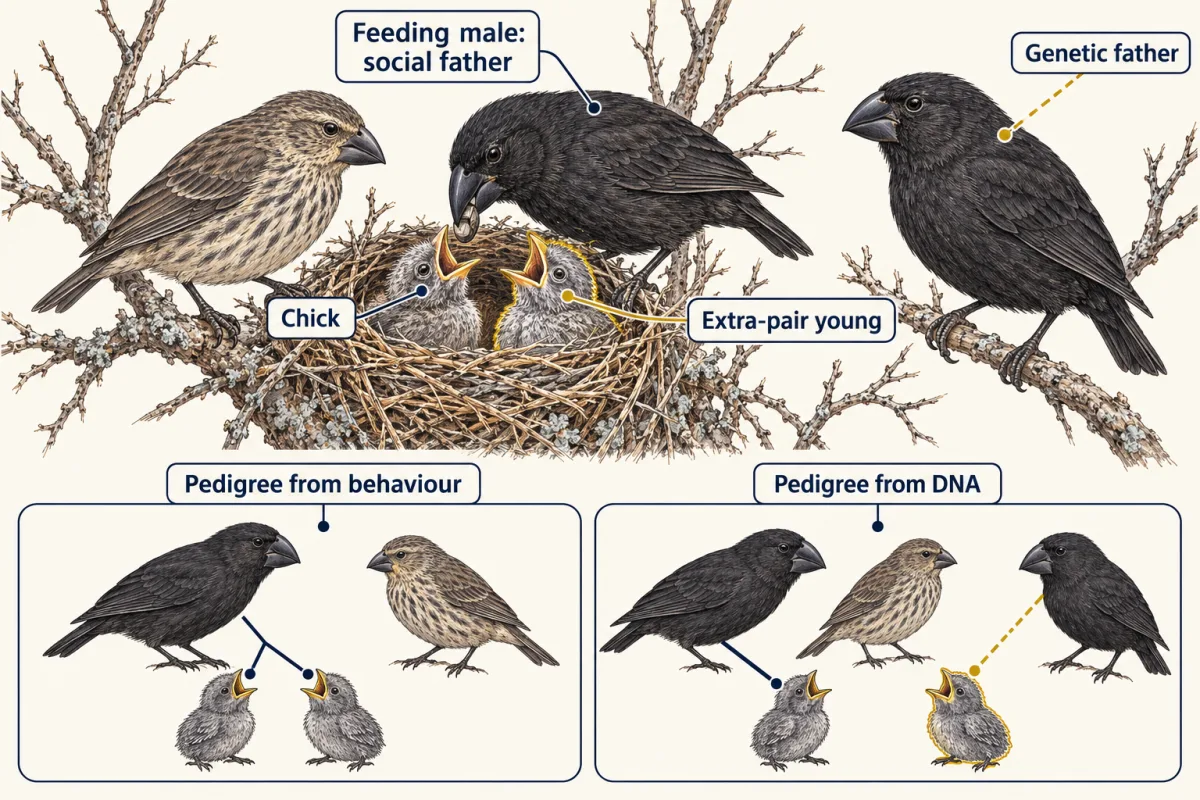
Every estimate depends on knowing the parents, usually taken to be the birds seen feeding a chick. Keller, Grant, Grant and Petren (2001) tested that shortcut with DNA, typing birds at eight microsatellite loci, places in the genome where short repeated stretches of DNA vary between individuals. Twenty percent of the offspring in their sample were extra-pair young, whose social father was not the genetic father. In this study, wrong fathers made the traits look less inherited than they are (figure). The error can run the other way too: chicks still resembled their mothers more than their fathers, which the authors read as maternal effects, influences of the mother other than her genes, such as egg size or the food she brings. A maternal effect that tracks the mother’s own trait can make a trait look more inherited than it is.
Claim 3: the offspring changed
The Grants (1995) measured the offspring of selected birds and showed that selection had changed the next generation.
The one idea. A nonrandom difference in survival shows selection, not yet evolution. The breeder’s equation, R = h² × S, predicts how far the next generation’s mean moves: a fraction h² of the selection differential S. So to show that selection changed a trait’s average, you need three claims, each with its own evidence: selection happened (S), the trait is inherited (h²), and the offspring changed (R).
Scope: one trait, one population, one episode of directional selection; an additive model, in which the effects of genes simply add up; offspring raised in the same environment as their parents; and no unmeasured trait, correlated with this one, that also affects fitness. Other kinds of selection, and evolution shown directly from changes in gene frequencies, are tested in other ways. The environment sets the sign of S, so the rule predicts one generation, not a decade.
Heritability itself is covered in complex traits and GWAS.
In words The response equals the heritability times the selection differential.
- R“R”
- the response: the offspring mean minus the mean of the population before selectionmm
- h2“h squared”
- narrow-sense heritability, from 0 to 1no units
- S“S”
- the selection differential: the mean of the parents, each counted once per offspring, minus the mean of the population they came frommm
Sanity check R / S returns the heritability you put in: −0.12 / −0.20 = 0.60.
Try one number
Illustrative: a population averages 9.40 mm and the drought survivors that breed 9.20 mm, so S = 9.20 − 9.40 = −0.20 mm.
With h2 = 0.60, R = 0.60 × (−0.20) = −0.12 mm, and the predicted offspring mean is 9.40 − 0.12 = 9.28 mm.
Need a refresher? reading an equation · units and prefixes
Predict. These numbers are illustrative, not the Grants’ measurements. Before a drought, adult mean beak depth in a finch population is 9.40 mm. The birds that survive and breed average 9.80 mm, and h² is 0.60. What will their offspring average?
Check your prediction
9.64 mm, inside the scope above.
- Selection differential. S = 9.80 − 9.40 = 0.40 mm.
- Predicted response. R = 0.60 × 0.40 = 0.24 mm. Heritability has no units, so R stays in millimetres.
- Predicted offspring mean. 9.40 + 0.24 = 9.64 mm.
A check for any problem: R must lie between 0 and S. It is 0 only if h² is 0; otherwise it has the same sign as S. If your offspring mean lies beyond the survivors’ mean, you have used a heritability above 1.
Only an actual offspring sample, raised in an unchanged environment, tests the prediction.
- S, within one generation
- R = h² × S, across generations
- Predicted offspring mean
- Check: R ÷ S
In this sketch: an additive model, no correlated trait under selection, and offspring reared in the same environment as their parents. Curve widths are drawn as a sketch, not to scale. The numbers are illustrative, not the Grants’.
S happens within a generation and R across generations; only R is evolution, and the prediction is only a prediction until offspring are measured.
Such predictions did well over a single episode. In 2006 the Grants reported that medium ground finches diverged in beak size from the large ground finch, Geospiza magnirostris, 22 years after it arrived, when the two species had severely depleted their shared food; the response came close to the value predicted from beak-size heritability.
The direction of selection can reverse
Predict. Drought favoured large beaks in 1977. Will every later drought do the same?
Check your prediction
For a while the same selection recurred (Price and colleagues, 1980 and 1982). Then the wet El Niño of 1982 and 1983 left a seed supply dominated by small soft seeds, and in the 1985 drought small birds with pointed beaks survived disproportionately well. Selection reversed: S changed sign. Drought did not favour large beaks as such; as far as the record shows, the seeds that remained did.
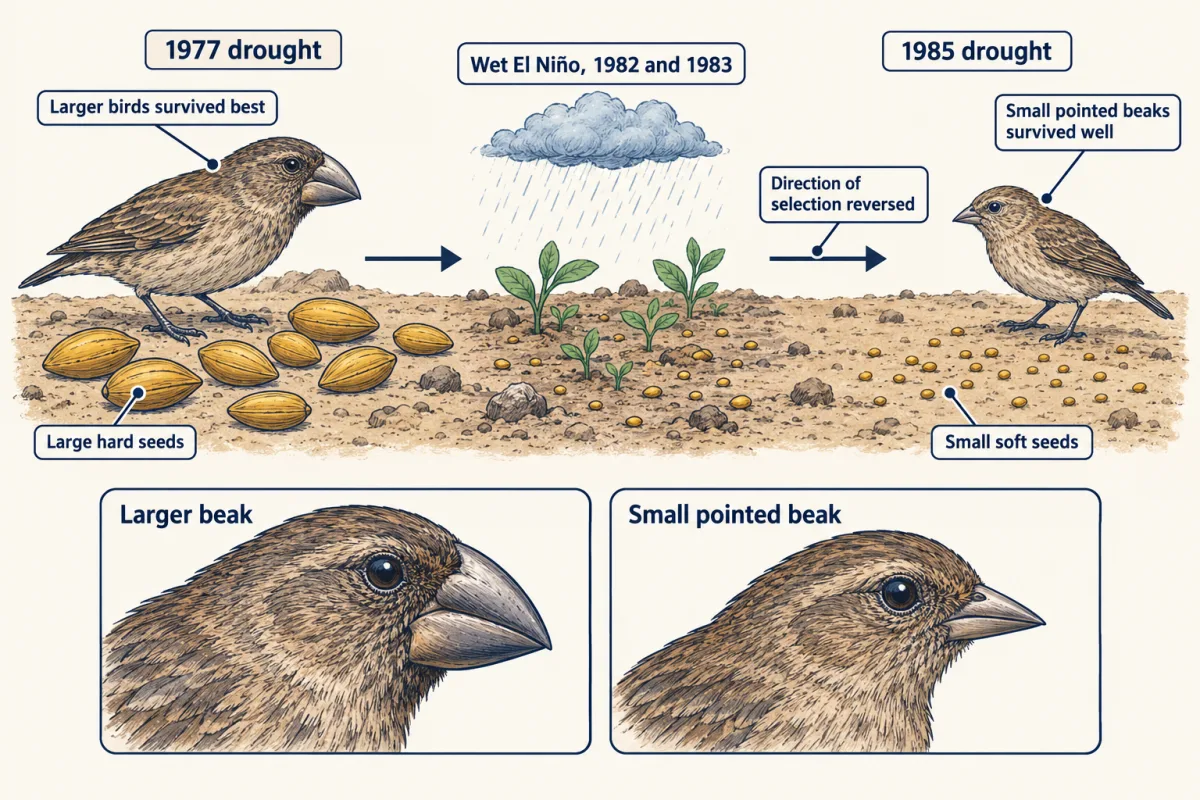
Over the whole record from 1972 to 2001, the Grants (2002) found selection on these populations that ranged from one-directional to oscillating, and from episodic to gradual. They concluded that evolution in these finches could be predicted in the short term from selection and inheritance, but that unpredictable fluctuations in the environment limited longer-term forecasts: the rains and rare events, such as hybridization and the arrival of a competitor, set the sign and size of S and could not be foreseen. R = h² × S carries a population one generation forward from an S that the environment sets afresh each time.
A second limit lies inside the equation, in the scope’s last condition. Beak depth, beak length and body size go together in these birds, so selection on body size could show up as an apparent response in beak depth; Morrissey and colleagues (2010) showed that the single-trait prediction is then unreliable (see Going deeper). For the algebra of drift and selection on single genes, see population genetics.
The finch record cannot say for certain what did the selecting: the remaining seeds are the leading suspect, and 1977 cannot be rerun. Where a proposed cause can be moved, an experiment can test it.
Read the transcript of “Changing the Cause on Purpose”
Film transcript: Changing the Cause on Purpose
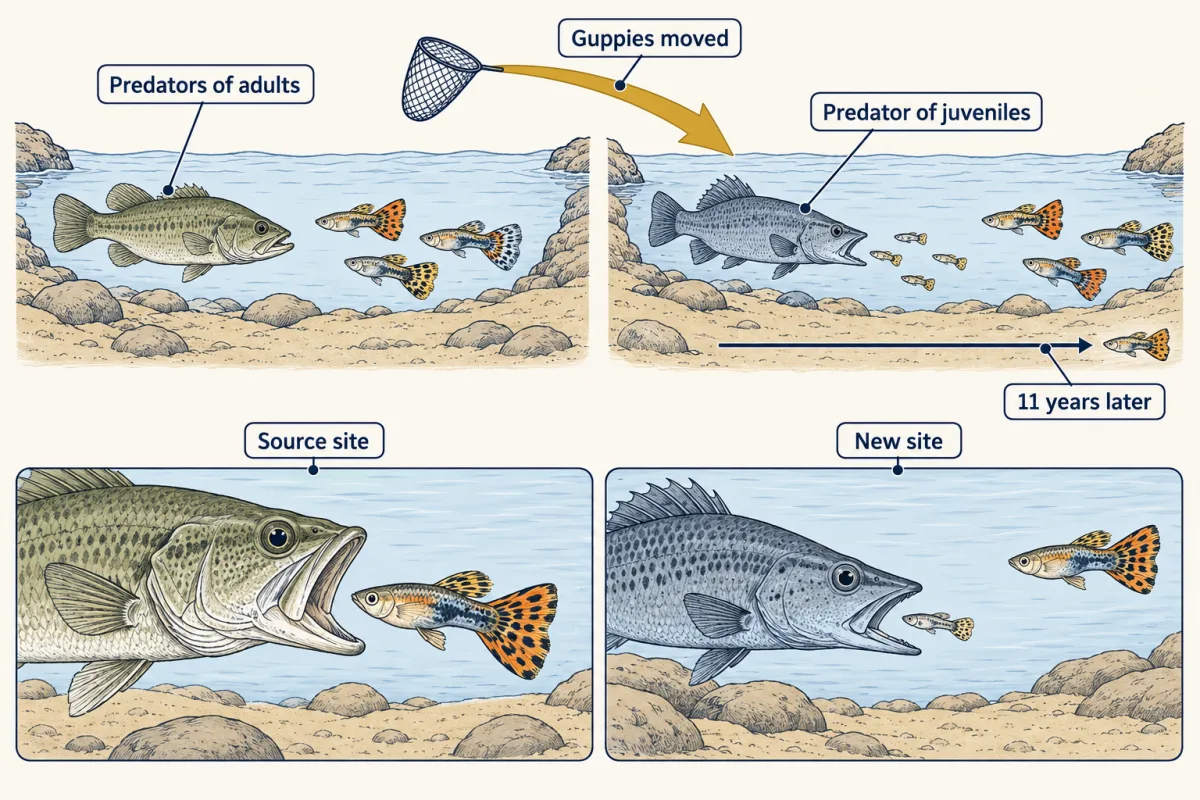
The seeds that were left are the leading suspect. But nobody can rerun 1977. So how do you test what did the selecting? Go to the mountain streams of Trinidad, where guppies live. In some stream reaches, the main predators eat adult guppies. In others, the main fish predator mostly takes small juveniles. Guppy populations from the two kinds of site differ in life history. That means when they mature, at what size, and how many young they produce. So did the predators shape those traits? The pattern fits that idea. But a comparison across natural sites shows only an association, not a cause. The sites differ in other ways too. Stream size, food, light and history all change from one site to the next.
Comparing the sites cannot pull those apart. So change the proposed cause on purpose. Guppies from a site with predators of adults were moved to a site whose predator mostly eats juveniles. The moved population then evolved in its new reach. David Reznick, Heather Bryga and John Endler compared it with its source population 11 years later. Notice what is different now. The moved guppies and their source started as one population. The researchers made the change, instead of finding sites that already differed. In the new site, adults are safer and the young are the ones being eaten. Should the moved guppies now mature earlier, or later?
Later, and at a larger size. The moved population had changed its life history in the direction life-history theory predicted. It matched the natural comparison. A manipulation can rule out some explanations that an observation leaves open. But this is still one stream and one introduction. And the new reach differed in more than its predator. So it showed that the change of setting caused evolution more firmly than it showed exactly how. So there are three tools, each for its own question. Observation of natural variation shows an association. An experimental contrast tests a cause, because the cause was changed on purpose. But nobody can move a past event.
That needs the third tool. Historical inference tests rival explanations against the traces the past has left. Each tool answers a different question.
From the film
- Comparing natural sites shows an association, because the sites differ in more than one way.
- Moving guppies from one source into a reach with a different predator changed the setting on purpose.
- About 11 years later, the moved guppies matured later and larger, the predicted direction.
- An experiment can test a cause, but this one is still one stream and one introduction, and the new reach differed in more than its predator.
- When a past event cannot be rerun, historical inference tests rival explanations against the traces it left.
Three kinds of evidence, and what each can carry
The second film set observation of natural variation, experimental contrast and historical inference side by side. What the guppy (Poecilia reticulata) transplant did not show is how the predators acted. Later work by Reznick’s group found that guppies at sites with predators of adults die at higher rates at every size, not mainly as adults, and that the change in population density this causes helps explain the evolution.
Historical inference works only with traces that rival explanations predict differently. The philosopher Carol Cleland has argued that this is a different method from experiment, not a weaker one. On Daphne Major, a male finch arrived and bred with a resident medium ground finch. Was he an unusual local bird or an immigrant? His genome answered it: Lamichhaney and colleagues placed him as a Geospiza conirostris from Española, more than 100 km away. The breeding was watched. His origin was inferred.
What a dataset cannot show
- Survival comparison (1977): selection on the measured traits that year. It cannot show inheritance, nor which of the correlated traits was the target.
- DNA-checked parent-offspring regression: how strongly the traits pass on in that population. It cannot identify what did the selecting, and it can still mistake a shared environment for inheritance, because parents rear their own chicks.
- The 30-year record: that selection varied in direction and pattern on one island, in two species, over those years; not what happens on other islands or in other lineages. “Darwin’s finches show” is a broader claim than the data make.
- Genomes: Enbody and colleagues (2023) analysed 3,955 genomes from Daphne Major finches and found six loci of large effect that together explained 45 percent of beak-size variation in the medium ground finch. That leaves most of the variation unassigned, and an association with a locus is not a mechanism.
- The hybrid lineage (Lamichhaney and colleagues, 2018): reproductive isolation, the lineage breeding only among itself, established within three generations in this case, but not that the lineage will persist or is a new species, nor any general timescale for speciation.
Uncertainty sits in different places in each: sample size in a survival count, pedigree errors and shared environments in a heritability, the next year’s weather in a forecast.
Design problem
The offspring of drought survivors have deeper beaks than the population before the drought. A colleague says that proves beak depth is inherited. Another says well-fed parents simply raise well-fed chicks. Design a study that tells these explanations apart, and state its limits.
Saved in this browser only.
One way to do it
Separate genes from rearing. Swap eggs between nests soon after laying, deep-beaked pairs’ eggs to shallow-beaked foster parents and the reverse, leaving other clutches with their own parents. Measure every chick as an adult, when beak growth is complete.
Get the pedigree right. Type chicks and all candidate parents at microsatellite loci, and assign each chick its genetic father by DNA, not by who fed it: Keller and colleagues found 20 percent extra-pair young in their Daphne Major sample.
State the prediction first. If genes alone explain the resemblance, the slope on genetic parents is positive and the slope on foster parents near zero. If rearing alone explains it, the reverse. If both contribute, both slopes are positive, and comparing them shows roughly how much each matters. Report each slope with its uncertainty.
Limits. This is one island, one species and one cohort, and the estimate belongs to that environment. Foster nests still differ in territory and food, and swapping happens after the egg is laid, so effects of the mother through the egg remain. A result in one year may not hold in a year with different seeds.
Going deeper
When the sexes are selected differently
In 1977 survival especially favoured males with larger beaks. For a trait inherited equally through both parents, with no sex-specific inheritance, the S that predicts the offspring is the average of the mothers’ and fathers’ differentials, each calculated within its sex, weighting every parent by its offspring. Using only the larger differential, when both point the same way, overpredicts the response.
Beyond the single-trait equation
Morrissey and colleagues (2010) pointed out that even the multivariate breeder’s equation, which tracks several correlated traits at once, is valid only if every correlated trait that affects fitness has been measured. They advocated the Robertson-Price identity as a more robust alternative: it predicts the response from the genetic covariance between the trait and fitness itself.
Your notes
Select any text in the lesson to highlight it or add a note to it. Your highlights and notes are saved in this browser and collected in your notebook.
This browser is not letting the site save anything (a private window or strict privacy settings), so highlights and notes will be lost when you leave the page.
How we measure it
Marking and measuring a whole population over years
Nearly every bird is caught, banded with a unique combination and measured, then looked for in later seasons. Comparing the birds that survive or breed with the population they came from measures selection directly, and following their offspring measures what was passed on.
Microsatellite parentage assignment
Offspring and candidate parents are typed at several highly variable DNA loci. A chick whose alleles cannot have come from its social father is an extra-pair young, so the pedigree used for heritability can be corrected.
Parent-offspring regression
Offspring trait values are plotted against their parents' values. The slope against the mid-parent mean estimates narrow-sense heritability, if parents and offspring do not share environments that also shape the trait.
Field transplant experiment
Organisms are moved from one environment to another that differs in a chosen factor, such as the type of predator, and the moved population is compared with its source years later. It tests a cause that natural comparisons can only suggest.
Practice questions on this lesson (3) → MCAT-style, original, each with an explanation
Where this lesson fits
Before thisReview first
- Natural Selection in ActionLife Science · Grade 7
You need its account of how survival differences among varied individuals shift a population before this lesson separates selection from evolution.
- Variation and SurvivalBiology · High school
It shows that selection acts on inherited variation, which this lesson then tests with heritability and the breeder's equation.
After thisStudy next
- Natural Selection in Ecological ContextThis course · Lesson 3
It applies the selection-versus-response distinction to moths, where the environment sets the direction of selection.
- Drift, Gene Flow and Competing ExplanationsThis course · Lesson 4
It tests rival explanations for a change in a population, using the evidence kinds set out here.
- Life Histories and Evolutionary Trade-offsThis course · Lesson 10
It uses selection and inheritance to explain trade-offs, including a trait's response to selection.
Elsewhere on the siteFilms, simulations and method films in other courses
- Variance partition: genes, environment and heritabilitySimulation · Genetics and Molecular Biology
It shows how heritability is calculated as a share of variation, which sets the h² in the breeder's equation.
- Beetles and new coloursSimulation · Life Science
It shows how new genetic variants arise, the raw material for selection to act on.
Suggested by an AI model from the lessons themselves, then checked. How we use AI
Finish line
Test yourself
8 questions
Practice and MCAT-style, with explained answers.
Next · Lesson 2
Reading Phylogenetic Trees
Is a trout more closely related to a shark, or to you?
Continue →