Biology · Unit 5: Classifying life
Building a Tree of Life
Rewritten on : new text, flashcards and film. Your notes and highlights stay, but the text around them may have moved.
A whale lives in the sea and has a body shaped like a fish, so why do biologists say its closest living relatives are hippos?
Pause when the reading reaches a film, and offer to play it. Saved on this device.
Watch the film now, or keep listening
Builds on:DNA: Structure and CopyingFrom DNA to ProteinWhy these?
Where this lesson sits
- Virginia SOL BIO.6a
- Virginia SOL BIO.6b
- Virginia SOL BIO.6c
- Practices BIO.1c, BIO.1d, BIO.1e, BIO.1f
Essential question: How do scientists figure out who is related to whom?
-
Life Science (grade 7) LS.3 c and LS.11 b
Review it at grade 7 level
In Life Science you sorted organisms into domains and kingdoms by whether their cells have a nucleus, which cell parts they have, how many cells they have, and how they get energy. You learned that DNA sequences can be compared to see how alike two organisms are. You also learned that fossils, DNA and similar body structures are evidence that organisms share common ancestors. Biology adds the cladogram, a branching diagram built from shared traits, and shows how fossil, embryo and DNA evidence are combined to decide who is related to whom.
-
Biology BIO.6a, BIO.6b, BIO.6c You are here
This lesson
-
Biology II Biology II: Advanced Survey of Biology Topics, BIOII.5 e and BIOII.7 b; Genetics, GEN.2 e
Preview where it goes next
This lesson built a tree from five traits scored present or absent. In Biology II you build cladograms from DNA, protein and body-structure data together and use them to think about how new species form. You compare homologous structures with analogous ones, which look alike because they do similar jobs but came from different ancestors, like a bird wing and an insect wing, and with vestigial structures that remain in reduced form. In the Genetics course you study the genetic code in detail and see why a code shared by almost all life is strong evidence of common ancestry.
-
College
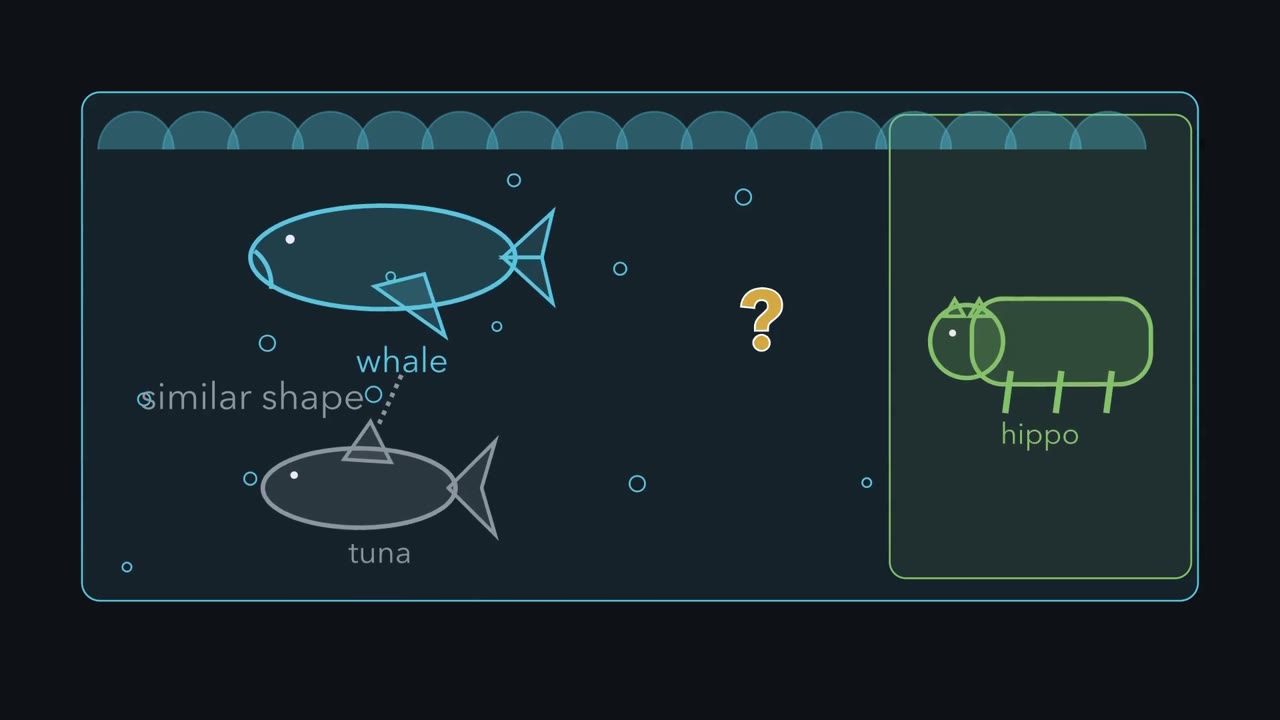 ▶ Watch Which Similarities Reveal Relatives? · 3:36
Read the transcript of “Which Similarities Reveal Relatives?”
Film transcript: Which Similarities Reveal Relatives?
A whale looks more like a tuna than a hippo. So why does the family tree pair whale with hippo? Shape offers one clue, but ancestry can leave a different pattern. Watch which features travel together through the branches.
Whales and tuna both move through water. A smooth body and fins help both animals swim. Similar conditions can favour similar solutions, even in groups that are not close relatives. Scientists therefore ask a sharper question. Which similarities were inherited from a shared ancestor? Suppose you could follow only one trail. Would you choose the outside shape, or features passed through generations?
Hold your answer. The useful trail should explain several different observations, not just one resemblance. Start inside the front limb. A human hand, bat wing, and whale flipper do different jobs. Yet each keeps the same basic bone pattern. Matching parts shift into new shapes without losing their order. That pattern is a homologous structure, inherited from a common ancestor. Development and fossils add other views. Vertebrate embryos can begin with shared parts, then follow different paths.
Fossils place past body forms in time order. Whale embryos begin hind limbs, and fossil whales had working legs. Neither clue depends on an adult whale looking like a fish. DNA supplies another record. Scientists compare corresponding sequences and look for changes inherited together.
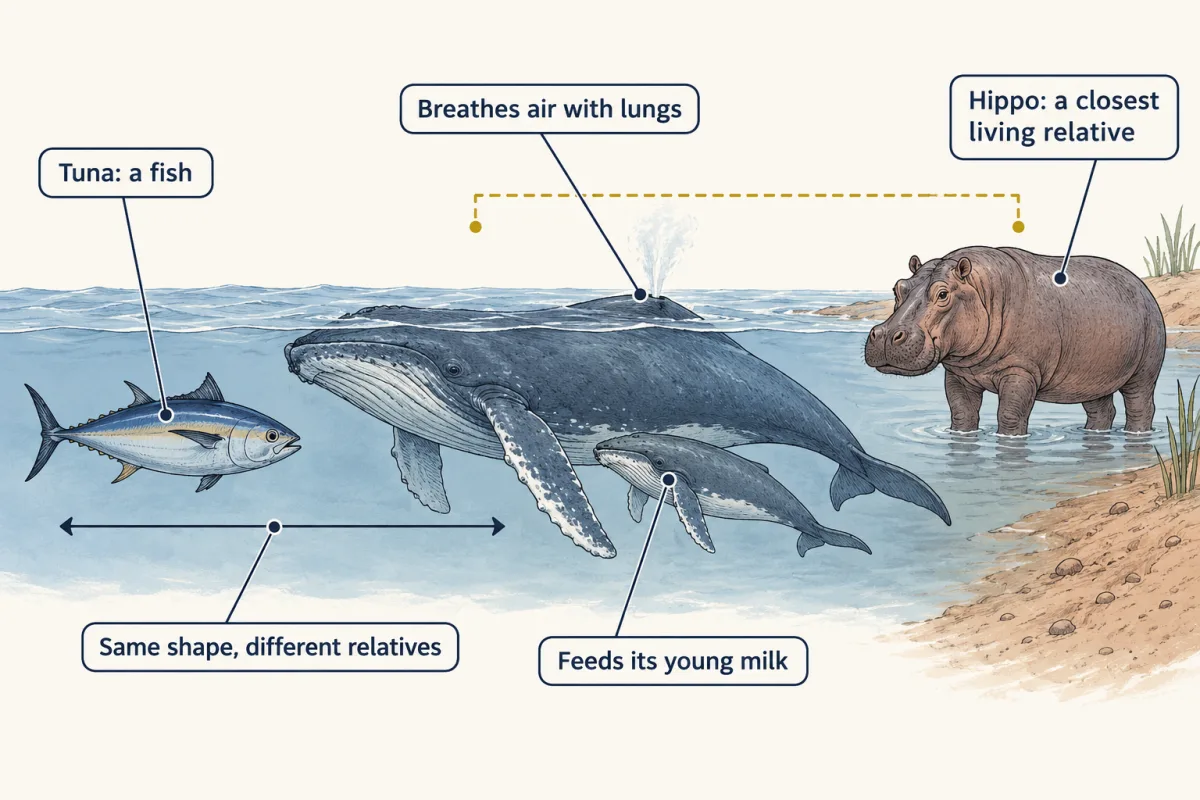
Shared insertions at matching locations are especially useful clues. Several such clues place whales beside hippos. When body, embryo, fossil, and DNA evidence agree, the grouping becomes stronger. One clue can be incomplete, so scientists compare independent evidence. Body structures, development, fossils, and DNA test the same branches from different angles. When they agree, the grouping gains support. The useful traits are derived traits. A derived trait first appeared in one ancestor and passed to its descendants. Trace shared derived traits to branch points to find the closest relatives. Now the first question has an answer. The whale's swimming shape links it to tuna by function.
Its lungs, limb bones, and embryos link it to four-limbed land animals. Its milk, fossils, and DNA link it to mammals. Within living mammals, the evidence places whales closest to hippos. The tree records ancestry, not overall appearance. Looks still matter when they preserve inherited parts. They mislead when a shared job produces a similar form. So begin with traits, test them with independent evidence, and follow their paths toward shared ancestors. That turns a resemblance into a claim you can check.
From the film
- Trace shared derived traits to branch points to find the closest relatives.
- Overall shape can reflect a similar way of life instead of close ancestry.
- Body structures, embryos, fossils and DNA can provide inherited evidence.
- Scientists trust a grouping more when independent kinds of evidence agree.
The first film ends on a surprising pair: whale and hippo. Now try the same reasoning on six animals and decide which trait separates each new branch.
What do you think? Decide before you read.
-
Scientists disagree: Looks, homes and diets can match in organisms that are not closely related; a shark and a dolphin are both sleek swimmers. Biologists compare inherited evidence instead. Body form still counts, but only when the likeness comes from shared inherited parts. When several lines of evidence agree, the grouping is trusted more.
What scientists think
Scientists disagree: Looks, homes and diets can match in organisms that are not closely related; a shark and a dolphin are both sleek swimmers. Biologists compare inherited evidence instead. Body form still counts, but only when the likeness comes from shared inherited parts. When several lines of evidence agree, the grouping is trusted more.
-
Scientists disagree: A cladogram is a branching diagram, like a family tree of cousins. On a tree of living groups, every tip has been evolving for the same amount of time since their shared ancestor. You can spin the branches around a branch point, and the tree still means the same thing, so no tip is the top.
What scientists think
Scientists disagree: A cladogram is a branching diagram, like a family tree of cousins. On a tree of living groups, every tip has been evolving for the same amount of time since their shared ancestor. You can spin the branches around a branch point, and the tree still means the same thing, so no tip is the top.
-
Scientists disagree: Fossils and DNA show that humans and chimpanzees share a common ancestor that lived long ago. Since that ancestor, both lines have kept changing. Living chimpanzees are our close cousins, not our grandparents.
What scientists think
Scientists disagree: Fossils and DNA show that humans and chimpanzees share a common ancestor that lived long ago. Since that ancestor, both lines have kept changing. Living chimpanzees are our close cousins, not our grandparents.
Explore: build a tree one trait at a time
A cladogram is a branching diagram of proposed relationships. In the builder, choose a trait, and the animals that lack it branch off first. Each trait marks a group within the whole sample. Added from backbone to hair, the traits pick out smaller and smaller groups. Another order changes the steps, not the finished tree. A DNA panel then checks the tree with another kind of evidence.
DNA differences here are made-up numbers in relative units, in this sketch. For a real scale, the lesson reports 1.23 mismatches per 100 aligned bases between one chimpanzee and human DNA (2005), about 12 per 1,000. Rule used in this sketch: the earlier two animals split, the bigger the number (10 per step).
Assumptions in this sketch: trait scores come from the lesson’s teaching table (1 present, 0 absent). Lancelet is the outgroup, the animal everyone else is compared to. Branch lengths mean nothing. Before every trait is in, a branch point can have more than two branches (not yet split).
Rule to keep: animals that share a derived trait stay together, each branch point stands for a common ancestor, and spinning branches around a branch point does not change the tree. This is a sketch of the logic.
Predict. Which animal will branch off first when you add “backbone”?
Check your prediction
The lancelet branches off first because it is the only animal in this set without a backbone.
Now try a different order, spin branches around a branch point and open the DNA panel. Ask what changed in the drawing and what, if anything, changed in the relationships.
Explain: the evidence for shared ancestry
- classification
- homologous structures
- embryology
- fossil record
- common ancestor
- genetic code
- cladogram
- shared derived characteristic
- branch point
Classification is the grouping of organisms by how they are related. The first film’s limb pattern is a homologous structure: a body part built from the same basic parts because it came from a common ancestor. A common ancestor is an earlier population from which two or more groups descended. Name the bone sets yourself in the figure.
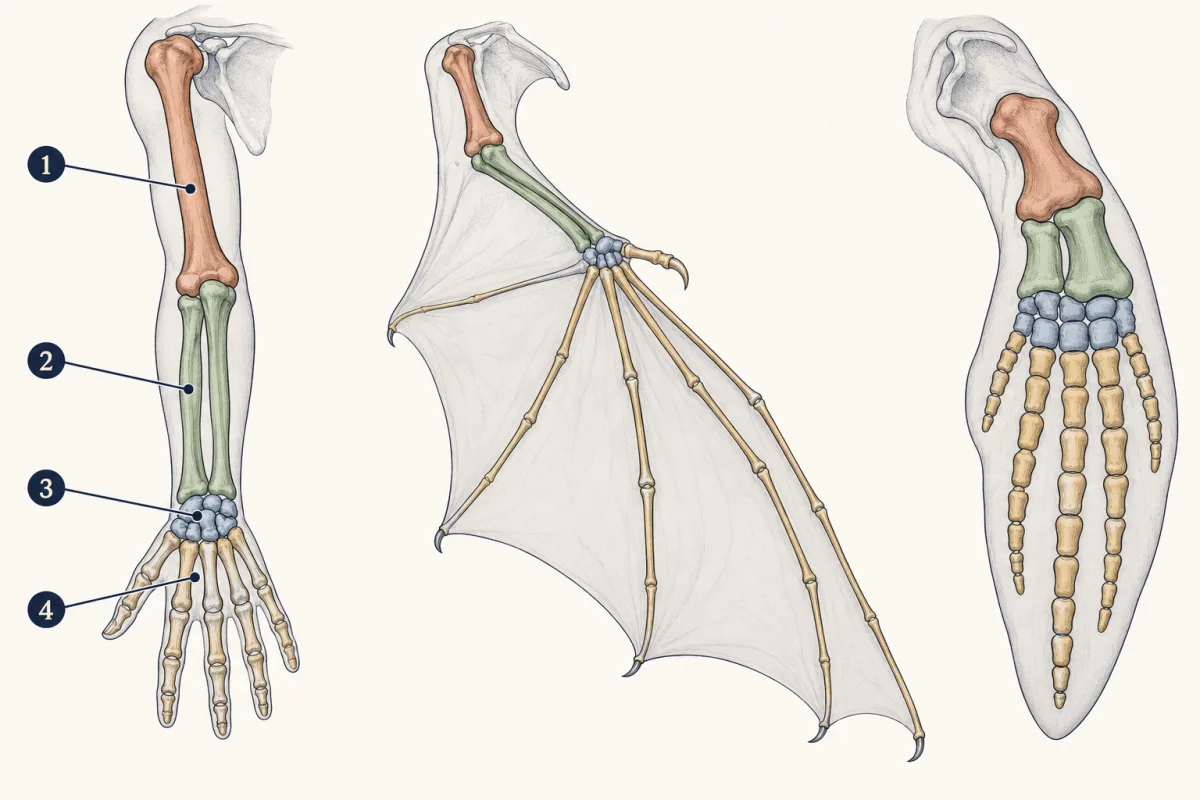
- upper arm bone
- two forearm bones
- wrist bones
- finger bones
- upper arm bone
- blank
- blank
- finger bones
Word bank: two forearm bones, wrist bones
- blank
- blank
- blank
- blank
Check your labels
- upper arm bone
- two forearm bones
- wrist bones
- finger bones
Embryology is the study of development before birth or hatching. Early fish, chick and human embryos have a tail and neck folds called pharyngeal arches. In fish, openings form between the arches, and several arches support gills. In humans the grooves between the arches never open into gill slits. The arches form parts of the jaw, ear and throat, and the tail shrinks. Human embryos do not turn into fish.
The fossil record is the collection of preserved remains and traces of past life, placed in time order by the rock layers they are found in, including groups that no longer exist.
Beyond the film’s DNA insertions, scientists compare matching DNA and protein sequences. The more two species’ sequences match, the more recently they usually shared an ancestor. At a deeper scale, almost every organism reads DNA with the same genetic code. The code matches each three-letter word in a gene’s message to an amino acid or a stop signal. Some organisms and mitochondria read a few of these words differently, but these are small changes to the same code. Most organisms also share basic reactions for breaking down sugar. A shared code and shared chemistry are best explained by common ancestry. The protein-synthesis lesson shows how the code works.
Predict. A backbone occurs in every vertebrate in a sample. Can it separate the turtle from the salamander and leopard in that sample?
Check your prediction
No. A trait shared by every organism in the group cannot split that group. A later trait, such as the amnion, is needed.
In a clean teaching table, a shared derived trait found in some animals but not others can mark a branch. With real data, scientists also test that it was inherited once, not lost or evolved twice. The second film puts such traits on branches and reads the tree.
Read the transcript of “Read the Branch Point”
Film transcript: Read the Branch Point
The first film followed inherited evidence to a surprising pair. Once evidence is scored, how does a branching tree turn it into a claim about relatives? The answer is not the nearest tip. It is the path back to a shared branch point.
Begin with a trait table. Each row is an organism, and each column is one inherited feature. A present mark lights up in teal. When the same marks form a smaller group inside a larger group, the groups are nested. A tree can show that nesting. A useful marker is a shared derived characteristic. It first appeared in one ancestor and passed to that ancestor's descendants. Move its mark from the table onto the matching branch. Every tip beyond that mark belongs to the marked group in this tree. A branch point, also called a node, represents a common ancestral population. Start at two tips and trace both lines toward the root.
Stop at the first node shared by both paths. A pair sharing a later node is more closely related in this tree. Trace shared derived traits to branch points to find the closest relatives. Now spin the whale and hippo branches around their shared node. The tips trade places. Did the relationship change, or did only the drawing move? Follow both paths before you decide.
Only the drawing moved. Both paths still meet at the same node, so the relationship is unchanged. Tip order cannot decide relatedness. This tree also has no top or goal. Every living tip has continued changing since its ancestors split. Branch length needs a key. On a plain cladogram, a long line can be empty space for layout. It does not automatically mean more time or more change. Some trees add a scale for time or change. Read that scale before comparing lengths. A tree can only use the organisms and evidence included. New fossils, sequences, or traits can test its branches. Different evidence may disagree, so scientists compare several lines and treat the tree as a supported model.
Scientists can update that model when stronger evidence changes the supported branching order. The clean classroom table is a starting case, not every case. So do not read across the tips. Trace backward. Find the first node shared by both paths, then ask which shared derived trait marks that branch. Rotation changes the picture, and a scale can change what length means. The branching order carries the relationship.
From the film
- Trace shared derived traits to branch points to find the closest relatives.
- A shared derived trait marks a group that inherited it from one ancestor.
- The closer pair meets at a more recent shared branch point.
- Rotating branches does not change the relationships.
Explain: read and build a cladogram
The second film defined a shared derived characteristic, a trait that first appeared in one ancestor and passed to its descendants, and a branch point, or node, the common ancestor of every branch that grows from it. It also showed that spinning branches or stretching unscaled lines changes only the drawing. It left out two points. A trait counts as derived only compared with the rest of the sample. And a node is an ancestral population that lived in the past, not a single individual; living species sit at the tips.
Elaborate: score six animals and place a whale
This table scores five traits in six animals. A 1 means present and a 0 means absent. The lancelet, a small fishlike animal without a backbone, is the outgroup, the animal used for comparison.
| Animal | Backbone (1/0) | Jaws (1/0) | Four walking legs (1/0) | Amnion (1/0) | Hair (1/0) |
|---|---|---|---|---|---|
| Lancelet (outgroup) | 0 | 0 | 0 | 0 | 0 |
| Lamprey | 1 | 0 | 0 | 0 | 0 |
| Tuna | 1 | 1 | 0 | 0 | 0 |
| Salamander | 1 | 1 | 1 | 0 | 0 |
| Turtle | 1 | 1 | 1 | 1 | 0 |
| Leopard | 1 | 1 | 1 | 1 | 1 |
These scores are a teaching dataset from a published biology textbook figure, not measurements of individual specimens. The source calls one trait the “amniotic (shelled) egg”. Here it means an embryo that grows inside a protective membrane called the amnion, which is why a leopard scores 1 even though it is born alive.
The 1s nest: five animals have backbones, four have jaws, three have four walking legs, two have an amnion and one has hair.
Predict. Which trait separates the lamprey from the other vertebrates? Is the turtle closer to the leopard or the salamander, and which trait decides?
Check your prediction
Jaws separate the lamprey: it has a backbone but no jaws, so it branches off before the jaw trait. The turtle is closer to the leopard. Both share the amnion, which the salamander lacks, so their paths meet at a more recent branch point. Legs, jaws and a backbone are shared by all three, so they cannot decide.
Hair marks the leopard branch in this sample. Real datasets are rarely this neatly nested: traits can be lost or arise independently, and kinds of evidence can disagree.
DNA gives separate evidence. In a made-up example, whale and hippo share insertions at three matching DNA spots, while pig and cow share one different insertion.
Predict. One DNA spot groups whale with pig, while several other spots group whale with hippo. Should one spot decide the tree?
Check your prediction
No. One odd result could reflect missing data or another problem, so it should not outweigh several checked, independent insertions at the same locations in every species.
Claim, evidence, reasoning
Make a claim about where a whale belongs on the tree of life, using evidence from fossils, embryos and DNA.
Start with: A whale belongs on the blank branch, and its closest living relatives are blank.
Start with: Whales breathe with blank and feed their young blank. Fossil whales such as blank had blank. Whale DNA shares blank with hippo DNA.
Start with: These traits were inherited from a common ancestor because blank, so the whale’s fishlike shape is blank.
Compare with a model answer
A whale belongs on the mammal branch, and its closest living relatives are hippos. Whales surface to breathe air with lungs, whereas tuna use gills, and whales feed their young milk, a trait that marks mammals. The fossil whale Maiacetus had four limbs with hands and feet, and dolphin embryos briefly grow hind-limb buds that later stop growing. These fossils and embryos show that whales came from four-legged land mammals. A 1999 study found DNA insertions shared by whales and hippos, which points to hippos as their closest living relatives. The fishlike body is a later change that fits life in water. One limit is that the six-animal table here has no whale and cannot place it by itself.
Saved in this browser only.
Design problem
Plan a study to test whether whales are closer to hippos or to pigs, using inserted pieces of DNA. Say what you would measure and what result would support each answer.
Saved in this browser only.
One way to do it
- What you measure: at many matching DNA spots, whether an inserted piece of DNA is present or absent in whales, hippos, pigs, cows and an outgroup such as a horse.
- Prediction if whales and hippos are closest: several insertions found in whales and hippos but not in pigs.
- Prediction if hippos and pigs are closest: several insertions shared by hippos and pigs but not by whales.
- Constants: look at the same DNA spots in every species, and use the same lab method for each sample.
- Checks: sequence each spot to confirm the insertion is really there. Test more than one individual of each species, and use many spots, not one, so that a single odd result cannot decide the answer.
- Ethics: use DNA from museum tissue, stranded animals or zoo samples, so no animal is harmed for the study.
Evaluate: check your thinking
Check your CER answer: each piece of evidence should be an inherited trait that marks a branch, not a resemblance. Lungs distinguish the whale from the tuna in this comparison, milk places it among mammals, and shared DNA insertions pick out hippos. Use the rule once more: follow the shared derived traits back to the shared node.
Science practices you used: reading a data table of scored traits, building a model of relationships and naming its limits, using several lines of evidence to support a claim, and planning a test that could prove a claim wrong.
Going deeper
Classification ranks and embryo drawings
Classification is also a nested list from broad to specific: domain, kingdom, phylum, class, order, family, genus, species. Each level holds fewer organisms that share more traits. The domains-and-kingdoms lesson covers the broadest levels.
Some old textbook drawings made vertebrate embryos look more alike than they really are. Biologists now compare photographs of real embryos. The shared structures are evidence; the embryos are not identical.
Where the trait table comes from
The trait scores come from a published biology textbook figure (copyright 2005), shown in City Tech (CUNY) course slides for BIO1201 (spring 2019 course website).
Dates for the whale evidence
The fossil whale Maiacetus is about 47.5 million years old. Dolphin embryos grow hind-limb buds that stop growing around week five.
The 2005 chimpanzee genome comparison
In 2005 a team compared the genome of one chimpanzee, named Clint, with human DNA. Across about 2.4 billion bases that could be lined up, they found 1.23 mismatches per 100 bases, so about 98.8 percent matched. That figure covers only the aligned parts, not every difference between the two genomes.
Predict. Using those numbers, about how many of every 1,000 aligned bases differ between humans and chimpanzees?
Check your prediction
About 12. Multiply 1.23 differences per 100 bases by 10 to get 12.3 differences per 1,000 aligned bases, then round to a whole base.
Your notes
Select any text in the lesson to highlight it or add a note to it. Your highlights and notes are saved in this browser and collected in your notebook.
This browser is not letting the site save anything (a private window or strict privacy settings), so highlights and notes will be lost when you leave the page.
How we measure it
Scoring characters in a matrix
Each organism is checked for the same list of traits, and each trait is scored 1 for present or 0 for absent. The finished table shows which groups share which traits, so a tree can be built from it.
DNA insertion analysis
Scientists look at the same spot in the DNA of several species and record whether a piece of inserted DNA is there or not, then sequence the spot to confirm it. Species that share an insertion at the same spot most likely inherited it from one common ancestor.
Comparing embryos
Preserved embryos at different stages are examined and compared, sometimes with stains that show where a signal that guides how the embryo develops is active. Shared early structures can reveal relationships that adult bodies hide.
Where this lesson fits
Before thisReview first
- DNA: Structure and CopyingThis course · Lesson 16
You need to know DNA is a sequence of letters before comparing matching DNA between species.
- From DNA to ProteinThis course · Lesson 18
The shared genetic code, and how DNA letters set a protein's amino acids, is used here as evidence.
After thisStudy next
- Domains and KingdomsThis course · Lesson 24
It uses shared traits and DNA evidence to sort organisms into the broadest groups on the tree.
- Classification ChangesThis course · Lesson 25
It shows how new molecular evidence, like the DNA evidence here, can redraw a tree.
- Evidence for EvolutionThis course · Lesson 26
It uses fossils, embryos and DNA as evidence for common ancestry, as the whale case does.
Elsewhere on the siteFilms, simulations and method films in other courses
- Molecular clock datingMethod film
It shows how DNA differences between species can date their branch points.
Suggested by an AI model from the lessons themselves, then checked. How we use AI
Finish line
Test yourself
8 questions
Practice and MCAT-style, with explained answers.
Next · Lesson 24
Domains and Kingdoms
One drop of pond water can hold organisms from all three domains of life. Which questions would you ask to tell them apart?
Continue →