Ecology and Evolution · Unit 2: Genomes, development and diversification
New to this? Review it at high school level: Natural Selection and New Species
Speciation: How Barriers to Gene Flow Evolve
Rewritten on : new text, flashcards and film. Your notes and highlights stay, but the text around them may have moved.
Two monkeyflowers can be crossed by hand, yet they almost never exchange genes in the wild. What barriers hold them apart, and how did adapting to different places and pollinators build those barriers?
Pause when the reading reaches a film, and offer to play it. Saved on this device.
Watch the film now, or keep listening
Builds on:Natural Selection in Ecological ContextDrift, Gene Flow and Competing ExplanationsReading Phylogenetic TreesWhy these?
 ▶ Watch Leaks That Multiply · 3:14
Read the transcript of “Leaks That Multiply”
Film transcript: Leaks That Multiply
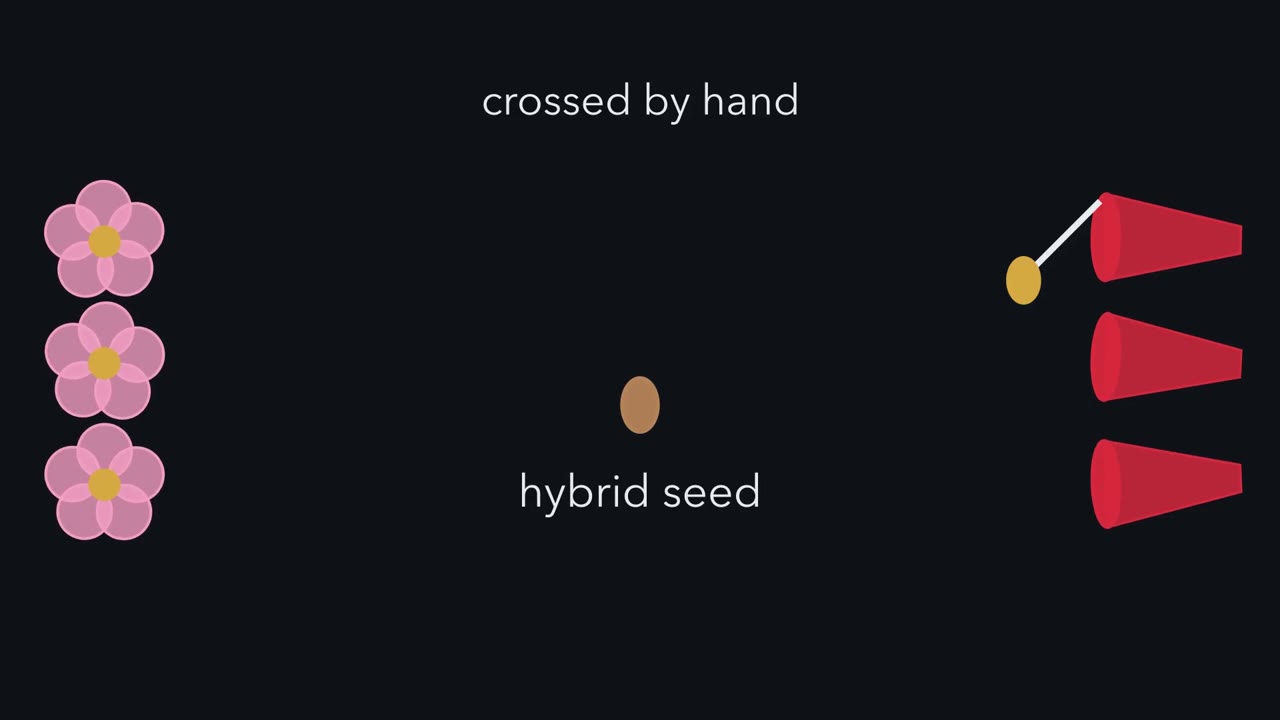
These two monkeyflowers can be crossed by hand, and the cross makes hybrid seed. So why do almost no genes pass between them in the wild? Gene flow is the movement of genes between populations through mating. Picture it as a stream. Each gold dot is one chance for genes to cross to the other species. A reproductive barrier is anything that reduces gene flow between populations. You might expect one wall that stops everything. These monkeyflowers have no such wall. Each of their barriers is partial. So picture the barriers as gates, in the order life meets them. First, where the plants grow. Then, which pollinator visits. Then, whether the other species' pollen can fertilize the egg.
Fertilization makes the zygote, the fertilized egg. Gates before it are prezygotic. Gates after it, such as hybrids that fail to survive or are sterile, are postzygotic. Here is the key. When gates act one after another, each acts only on what earlier gates let through. A pollinator cannot carry pollen between plants that never grow near each other. Try three partial gates, each stopping seventy percent of the dots that reach it. Together, do they stop seventy percent? More than a hundred? Something else?
Watch the counter. Each gate leaves less for the next one. In the end, about ninety-seven dots in every hundred are stopped. That stops more than any single gate, yet a few dots still pass all three. That is the rule. The fractions that get through multiply. Several leaky gates in a row can block nearly all gene flow. Adding their strengths is wrong, because the sum can pass one hundred percent. Now the real monkeyflowers. Ramsey, Bradshaw and Schemske measured these gates one stage at a time. They worked in the field and in the greenhouse. Every gate was partial. Where the plants grow, and which pollinator visits, came first in the sequence.
Most of the stream was gone before any hybrid could form. Together, the measured barriers were estimated to block, on average, almost all gene flow. No one gate could explain that alone. This is also why a species pair does not need sterile hybrids. When the early gates are strong, few hybrids form at all. So two species need no perfect wall. Several leaky gates, acting one after another, can cut the gene flow between them to a trickle.
From the film
- A reproductive barrier is anything that reduces gene flow between populations.
- When barriers act one after another and independently, each one blocks only the gene flow left by earlier barriers.
- The fractions that get through multiply, so several partial barriers can block nearly all gene flow.
- Barriers before the zygote are prezygotic; barriers after it, such as hybrids that fail to survive or are sterile, are postzygotic.
- In the monkeyflowers, most of the isolation comes before any hybrid forms.
Two monkeyflowers of western North America, one pink and visited mostly by bumblebees, the other red and visited mostly by hummingbirds, can be crossed by hand to give hybrid seed. Yet in the wild almost no genes pass between them. They count as two species because barriers that reduce gene flow have evolved between them, and those barriers grew mostly out of adapting to different places and different pollinators.
The one idea. Gene flow, the movement of genes between populations through mating, is whatever leaks through a series of barriers, so the fractions that get through multiply. Several partial barriers can therefore block far more gene flow than any one of them, and they often grow as side effects of adapting to different places and partners.
Scope: sexually reproducing organisms, and barriers that act one after another and independently. The rule measures how much gene flow is blocked. It does not say where the populations were while they diverged, and it does not define a species: lineages can stay distinct despite some gene flow (see the criteria section), and polyploidy can raise a strong barrier in one step.
In sexually reproducing organisms, speciation is the evolution of reproductive barriers that reduce gene flow between populations that once interbred.
Measuring barriers, and why their leaks multiply
The first film showed leaks multiplying. Left out: where each gate’s number comes from, and which gate gets the credit.
A reproductive barrier is anything that reduces gene flow between populations. Its strength, RI (reproductive isolation), is the share of the gene flow reaching that barrier that it stops, measured against a control. For example, if range maps show two species growing together only 40% as often as they would if spread at random, the habitat barrier’s RI is 1 − 0.40 = 0.60. Each barrier has its own control: range maps for habitat, pollinator watches in a mixed stand for pollinators, and, for later barriers, crosses between species scored against crosses within a species.
The film’s 99.87% is the estimate of Ramsey, Bradshaw and Schemske (2003), combining barriers across the life cycle: range overlap, pollinator isolation, pollen precedence (a plant’s own pollen fertilizing ahead of the other species’) and several parts of hybrid fitness, from germination to fertility. It is the mean of their estimates for the two directions of gene flow, not a sign that the genomes never mix (Going deeper).
The ledger uses illustrative numbers in the style of that study. Three barriers act in this order, each independently: habitat RI = 0.60, pollinators RI = 0.90, hybrid fertility RI = 0.50.
| Barrier, in order | RI | Gene flow reaching it | Blocked here (its credit) | Gene flow left |
|---|---|---|---|---|
| Habitat | 0.60 | 1.00 | 0.60 | 0.40 |
| Pollinators | 0.90 | 0.40 | 0.36 | 0.04 |
| Hybrid fertility | 0.50 | 0.04 | 0.02 | 0.02 |
The credits add up to the total isolation: 0.60 + 0.36 + 0.02 = 0.98. As a formula, the one idea reads:
total isolation = 1 − (1 − RI1) × (1 − RI2) × (1 − RI3), here 1 − 0.40 × 0.10 × 0.50 = 0.98
Credits can be added because each is already weighted by the gene flow left for it; raw strengths cannot, since they sum to 2.00, more than all the gene flow there is. Habitat gets more credit (0.60) than pollinators (0.36), although pollinators have the larger RI (0.90), because habitat acts first and leaves pollinators only 0.40 to block.
Predict. Swap the first two barriers, so pollinators act before habitat. Does total isolation change? Which barrier now gets the most credit?
Check your prediction
The total stays 0.98, because multiplication does not care about order. The credit moves: pollinators now stop 0.90, habitat only 0.60 × 0.10 = 0.06, and hybrid fertility still 0.02. A barrier’s credit depends on its position as well as its strength, so “which barrier matters most” has an answer only for a stated order. In real pairs the life cycle sets that order.
| Barrier | RI | Gene flow left before | AC = RI × left |
|---|
- Total isolation = 1 − ∏(1 − RI)
- 0.98
- Gene flow remaining
- 0.02
- Sum of ACs (check)
- 0.98
- Raw sum of the RIs (not a fraction)
- 2.00
In this sketch: three barriers act in sequence and independently, and each RI is the fraction of the remaining gene flow that barrier blocks. Real combinations can depart from this. The numbers are illustrative, in the style of the monkeyflower study.
Each barrier works on the gene flow left by the ones before it, so total isolation does not depend on the order, but the credit each barrier gets does. Never add the raw strengths.
Kinds of barrier: before and after the zygote
The first film drew a line at the zygote, the fertilized egg: prezygotic barriers act before it, postzygotic barriers after a hybrid zygote forms. Common textbook categories include these seven:
| Barrier | Acts | What happens |
|---|---|---|
| Ecogeographic (habitat) | Prezygotic | The populations live in different places or habitats and rarely meet |
| Temporal | Prezygotic | They breed at different times of day or year |
| Behavioral | Prezygotic | Courtship, song, scent or mate preference differ; in plants, pollinator preference plays this role |
| Mechanical | Prezygotic | Reproductive structures do not fit |
| Gametic | Prezygotic | Egg and sperm, or pollen and stigma, are incompatible, so fertilization fails |
| Hybrid inviability | Postzygotic | Hybrids fail to develop or survive |
| Hybrid sterility | Postzygotic | Hybrids survive but have reduced fertility or none |
Sterility often traces to genes that changed separately in each lineage and work badly together in a hybrid. It can also trace to chromosomes that pair poorly at meiosis, covered in chromosomes and meiosis and chromosome changes.
In the monkeyflowers the strongest early gates were habitat and pollinators. Were those gates built to keep the species apart, or did they come free with adaptation? The second film tests the idea with fish.
Read the transcript of “Isolation Follows Ecology”
Film transcript: Isolation Follows Ecology
If barriers are side effects of adapting to different habitats, isolation should follow the habitat. So what happens when fish adapted to the same habitat, but from different lakes, meet? In the monkeyflowers, the strongest early gates were habitat and pollinators.
Were those gates built to keep the species apart? Or did they come free with adaptation? One answer is divergent selection, which favours different traits in different places. Two populations adapt to different habitats, and mating between them falls as a side effect.
No one designs the barrier. Selection acts on individuals, and isolation appears along the way. Isolation that arises like this is called ecological speciation. How could you test it? Use evolution that repeated itself. Several small lakes in British Columbia each hold two forms of threespine stickleback. The benthic form feeds on the bottom. The limnetic form feeds in open water. Each lake's pair is thought to have arisen on its own. Rundle, Schluter and colleagues ran hundreds of laboratory mating trials, with fish from three lakes. They paired fish of the same and different forms, from the same and different lakes. A benthic fish from one lake meets a benthic fish from another lake.
Their ancestors split apart separately. Will they mate? Yes. Same-form pairs from different lakes showed no strong isolation. But benthic and limnetic fish were strongly isolated, whichever lakes they came from. Look at what each idea predicted. If ancestry mattered, fish from one lake would mate best. If ecology mattered, fish of one form would mate best, wherever they came from. So isolation followed ecology, not ancestry.
Drift alone would be unlikely to repeat the same pattern lake after lake. Divergent selection is the likely cause. Now return to the monkeyflowers. The red one grows mainly at lower elevations, the pink one higher up. Their flowers suit different pollinators. The pink flower is wide, with a small nectar reward, and bumblebees visit it. The red flower has a narrow tube and a large reward, and hummingbirds visit it. Those adaptations are themselves the gates.
Plants adapted to different elevations rarely meet. A pollinator that favours one flower carries little pollen to the other. Fish or flowers, the lesson is the same. Adapt to different places and partners, and isolation often grows as a side effect.
From the film
- Divergent selection favours different traits in different habitats.
- Selection acts on individuals and builds no barrier on purpose; isolation that arises as a side effect of adaptation is called ecological speciation.
- In stickleback mating trials, fish of the same form from different lakes showed no strong isolation, while fish of different forms were strongly isolated.
- When isolation repeats with the environment, lake after lake, drift alone is unlikely and divergent selection is the likely cause.
- In the monkeyflowers, adaptation to elevation and to pollinators is itself the barrier.
How barriers evolve: divergent selection
The second film showed benthic-limnetic stickleback isolation following ecology lake after lake, the mark of divergent selection, selection that favours different traits in different places.
For the monkeyflowers, transplant experiments showed that each species is adapted to the elevations where it normally grows, and Ramsey and colleagues concluded that ecological factors, the products of adaptive divergence (adaptation pulling the two apart), were the main barriers between this pair. More broadly, in plants adaptation to different pollinators and habitats commonly drives the evolution of prezygotic barriers (selection in ecological context).
The stickleback trials did not identify which traits drove the mate preferences, and they point to divergent selection as the likely cause of the isolation but not to where the forms first diverged, the next section’s question.
Selection can also favour isolation itself. In reinforcement, two forms meet and their hybrids do poorly, so individuals that avoid mating with the other form leave more offspring, and prezygotic isolation grows stronger.
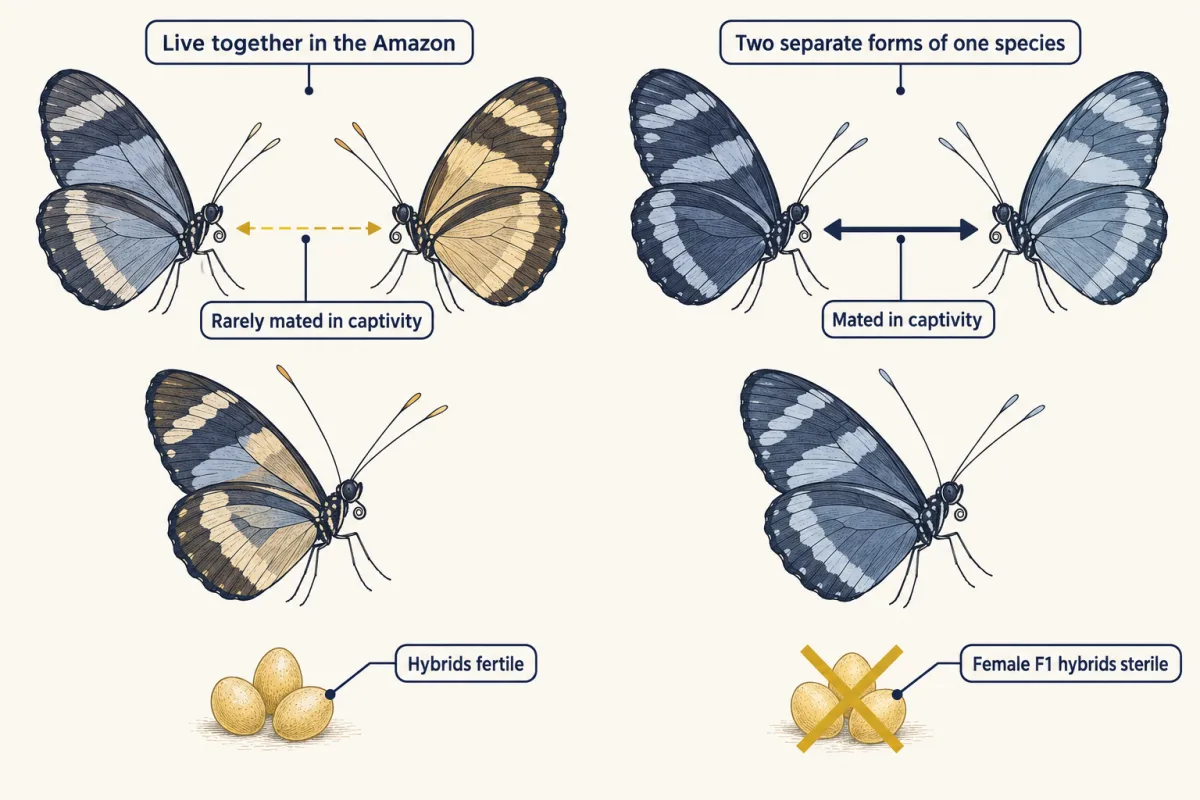
Two Heliconius butterflies that fly together in the Amazon are held apart by mate choice and ecology, not hybrid sterility (figure), and Rosser and colleagues (2019) read that strong mate choice as consistent with reinforcement.
Two other mechanisms build barriers without divergent selection between habitats. In mutation-order speciation, separate populations under similar selection fix different advantageous mutations, and those mutations work badly together when the populations meet, so hybrids suffer. Drift, chance change in gene frequencies in small populations (drift and gene flow), has weaker evidence behind it as a cause of speciation.
Geography and mechanism are separate questions
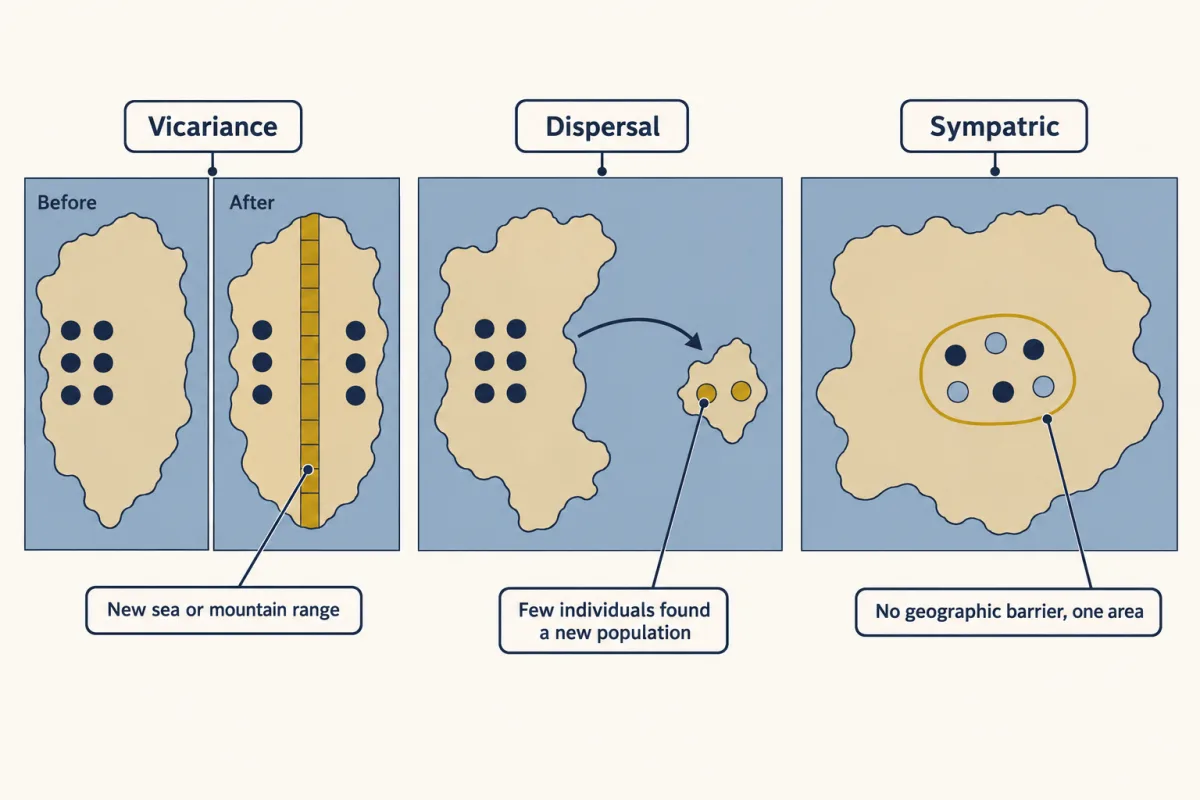
Geography asks where the populations were while they diverged; mechanism asks what process built the barriers.
Allopatric speciation happens in populations that are physically separated. Separation can come by vicariance, when a barrier such as a new sea or mountain range divides one population, or by dispersal, when a few individuals found a new population somewhere else. Sympatric speciation happens without a geographic barrier, within one area. (Cases in between are in Going deeper.)
The Isthmus of Panama is a classic vicariance event, yet it did not split every pair at one moment: Nancy Knowlton and colleagues found that Alpheus snapping-shrimp pairs divided by it were probably isolated at different times, some well before the final closure (Going deeper).
Ecological speciation, isolation as a by-product of adaptation, is a mechanism, not a third geographic mode: it can act in allopatry or in sympatry.
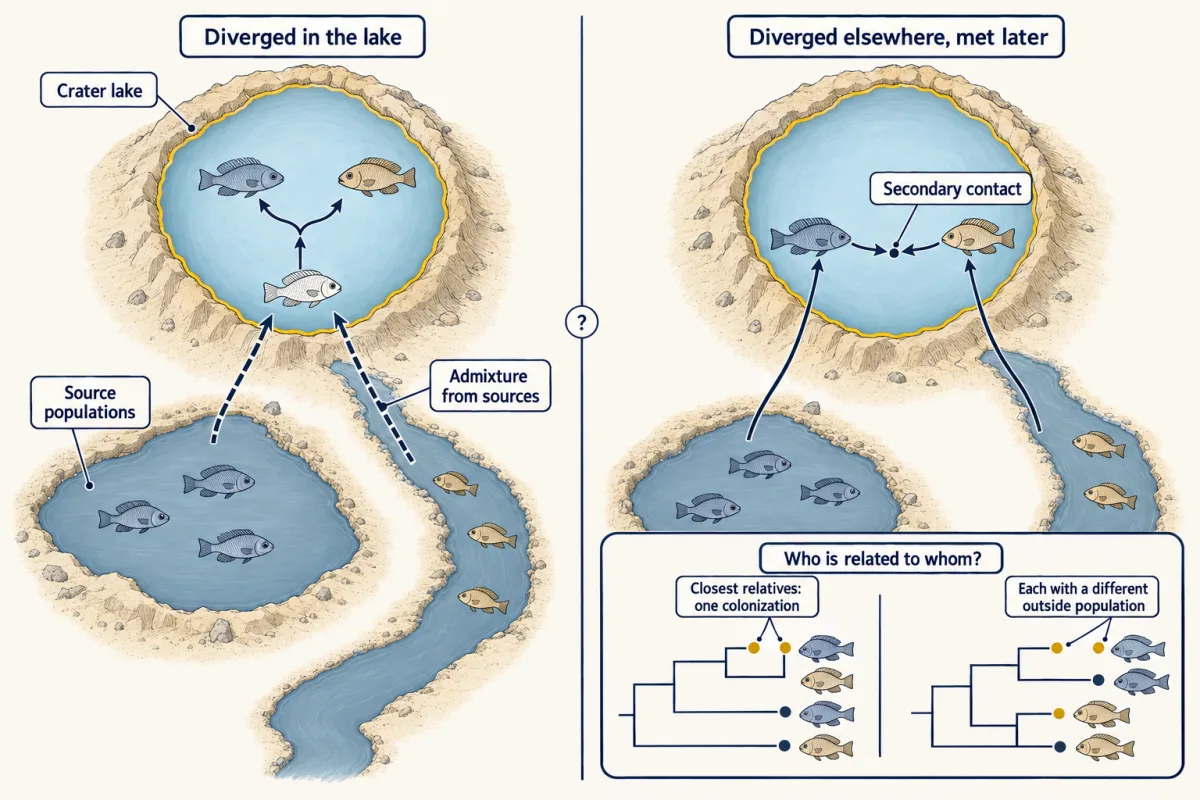
Predict. Two cichlid species live together today in one small crater lake in Nicaragua. Does that show they diverged there?
Check your prediction
No. They could have diverged in the lake, or diverged elsewhere and met later, called secondary contact; both histories end with the species living together. Telling them apart takes genetic data from possible source populations and a comparison of explicit models.
Kautt, Machado-Schiaffino and Meyer (2016) made that comparison for Nicaraguan crater-lake cichlids with genome-wide data, and it supported divergence beginning in sympatry, with admixture, genes entering from another population by interbreeding, from source populations into both lakes shortly before diversification.
Polyploidy: isolation in one step
Polyploidy is a gain of extra whole chromosome sets (chromosome changes). Polyploid speciation, in which the entire genome is duplicated, is an important route to a new species, particularly frequent in plants. It most often happens together with hybridization: a hybrid between two species duplicates its genome, a route called allopolyploidy. The duplication gives the new lineage partial reproductive isolation from its parent species in a single generation, with no long period of divergent selection. The reason is chromosome number: a cross back to a parent gives offspring with unmatched chromosome sets, which pair poorly at meiosis, so those offspring are often sterile.
Wheat, a major crop, is a polyploid that arose through polyploid speciation. The route is not limited to plants: the clawed frogs (Xenopus and Silurana) include species with different numbers of chromosome sets. Hybridization without genome duplication can also give rise to a new species, called homoploid hybrid speciation, but how often that happens remains unclear.
What counts as a species: criteria as evidence
Barriers explain how lineages separate. Recognizing that they have separated is a different job, and the tool depends on the organisms and evidence.
A lineage is a line of ancestors and descendants traced through time. A metapopulation is a set of local populations linked by occasional migration. A metapopulation lineage, then, is a series of connected populations, ancestors to descendants, that evolves as one unit through time. On one influential view, the main species concepts agree that a species is such a lineage, evolving separately from others; they disagree about how to recognize one.
The biological species criterion, associated with Ernst Mayr, treats species as groups of actually or potentially interbreeding natural populations that are reproductively isolated from other such groups. Occasional fertile hybrids do not by themselves erase that isolation if the populations stay distinct, as in the Heliconius pair. The ecological criterion separates species by their niche, the set of conditions and resources a population uses. The phylogenetic criterion comes in two versions. One asks that a species be diagnosable by fixed character differences. The other asks that it be monophyletic: a group made up of an ancestor and all its descendants, read from a tree as in reading phylogenetic trees. Morphological criteria use differences in form.
Predict. You have only fossils of two kinds of animal, or only an asexual microbe. Which criterion cannot be used in either case?
Check your prediction
The biological criterion. It suits living, sexual organisms that meet. It fails for asexual organisms, which do not interbreed at all, and for fossils, which cannot be tested. Differences in form are what paleontologists and museum taxonomists work with.
Think of the criteria as instruments pointed at one object. A thermometer, an infrared camera and a hand on the forehead each detect a fever, and none of them is the fever. Kevin de Queiroz argued in 2007 that species criteria work this way: each detects a property, such as intrinsic isolation, a distinct niche, fixed differences or monophyly, that a lineage acquires as it separates. The properties arise at different times, so for young species the criteria disagree. In his unified concept they are lines of evidence, and the more agree, the stronger the case for separate evolution.
Design problem
Design a study to decide whether two cichlid species in one small crater lake diverged there (sympatric speciation) or elsewhere, arriving separately (secondary contact).
Saved in this browser only.
One way to do it
- Sample widely. Collect both species in the crater lake and every plausible source population in nearby large lakes and rivers.
- Genotype genome-wide. Use thousands of markers so that ancestry can be traced across the genome, not from one gene.
- Ask who is related to whom. If the two lake species are each other’s closest relatives, a single colonization with divergence in the lake is plausible. If each groups with a different outside population, separate arrivals are more likely.
- Compare explicit models. Simulate divergence with gene flow from the start against isolation followed by contact, and compare how well each fits the data.
- Test for admixture. Alleles can enter from outside even when divergence happens in the lake, as Kautt and colleagues found.
- Use geology. The age of the crater sets an upper bound on how long divergence in the lake could have taken.
State the conclusion as support for one model over another, not as proof, and name the histories you could not test.
Going deeper
The monkeyflower numbers
M. lewisii has wide pink flowers with a small nectar reward and is visited mainly by bumblebees; M. cardinalis has red, narrow-tubed flowers with a large nectar reward and is visited mainly by hummingbirds. In the study, ecogeographic isolation was estimated at 58.7% from herbarium records, 97.6% of pollinator foraging bouts in a mixed population stayed on one species, and greenhouse crosses gave nearly 50% fewer seeds than crosses with pollen from the same species. These numbers, and the 99.87% total, belong to those two species; they are not a ranking of barriers across all plants. The pollinator figure counts foraging bouts, and visits are not always the same as pollen moved.
An isolation index is not genome-wide separation
The 99.87% leaves about 0.13% of potential gene flow unblocked. Treated, only as a toy model, as a steady migration rate each generation, gene flow that size could make neutral regions of the genome nearly alike in large populations. Species with strong isolation can stay distinct because selection keeps the barrier genes and adapted traits apart; Heliconius elevatus, for example, has persisted as a hybrid lineage despite ongoing gene flow with one parent species. An isolation index is not itself a migration rate, and populations need not be at equilibrium, so this is an illustration, not a claim about the monkeyflowers.
Comparing barrier strengths across studies
Ramsey, Bradshaw and Schemske used the sequential method of the ledger above. Sobel and Chen (2014) proposed a unified linear index of barrier strength because earlier indices used different null expectations and denominators, and barrier strengths can be compared only when indices share both.
Between allopatry and sympatry
Between the two geographic modes lie parapatric cases, in which neighbouring populations diverge along a boundary while still exchanging some genes.
Panama and the snapping shrimps
The Isthmus of Panama finished closing about 2.8 million years ago by the usual estimate, although some studies argue for a much earlier closure. Biologists used species pairs split by it to calibrate molecular clocks, assuming every pair split when the land closed. Knowlton and colleagues tested that in seven pairs of Alpheus snapping shrimps, comparing biochemical divergence with how readily shrimps from opposite oceans would pair in the laboratory; isolation was staggered rather than simultaneous. A 2009 follow-up by Hurt, Anker and Knowlton used several nuclear genes and found that ancestral variation, present before the split, explained much of the spread in mitochondrial distances, and that two pairs had probably diverged well before the final closure.
Methods behind the cichlid answer
Genome-wide markers for studies like the cichlid one are often typed by RADseq, which reads thousands of sites spread across the genome. Admixture statistics need care, because drift in one population can hide an admixture signal, so a test that finds no admixture does not prove there was none.
Why polyploidy is common in plants
Rieseberg and Willis suggested that polyploid speciation may be frequent in plants because polyploid plants often show ecological differentiation, local dispersal, high fecundity, a perennial life history, and self-fertilization or asexual reproduction.
Your notes
Select any text in the lesson to highlight it or add a note to it. Your highlights and notes are saved in this browser and collected in your notebook.
This browser is not letting the site save anything (a private window or strict privacy settings), so highlights and notes will be lost when you leave the page.
How we measure it
Herbarium range maps and pollinator observations
Museum and herbarium records show where each species grows, and the overlap estimates how often the two could meet at all. Watching pollinators in a mixed stand and recording whether each foraging bout stays on one species gives an estimate of pollinator isolation, since visits are not always the same as pollen moved.
Controlled crosses and hand pollinations
Heterospecific pollen or mates are given alongside conspecific controls, and seed set, hybrid survival and hybrid fertility are scored. The comparison with controls turns each postmating stage into a measured barrier strength.
Laboratory mating trials
Pairs or groups from chosen populations are given the chance to mate, and the fraction that spawn or copulate is compared across combinations. Crossing same and different ecological forms from separate sites tests whether isolation follows ecology or ancestry.
Genome-wide markers and demographic model comparison
Thousands of markers, for example from RADseq, are typed in the species and in candidate source populations. Explicit histories such as divergence with gene flow from the start, or isolation followed by secondary contact, are simulated and compared to see which fits the data best.
Method films · the methods library
Practice questions on this lesson (3) → MCAT-style, original, each with an explanation
Where this lesson fits
Before thisReview first
- Natural Selection in Ecological ContextThis course · Lesson 3
You need how selection favours different traits in different environments to see barriers arising as a side effect of adaptation.
- Drift, Gene Flow and Competing ExplanationsThis course · Lesson 4
Gene flow and drift are used here as the processes that barriers reduce and that compete as explanations.
- Reading Phylogenetic TreesThis course · Lesson 2
The monophyly criterion for species is read from a tree, so you need to know how trees show ancestors and descendants.
After thisStudy next
- History of Life: Transitions, Extinctions and RadiationsThis course · Lesson 8
Radiations and extinctions are the large-scale results of speciation producing many new lineages.
- Mutualism, Parasitism and CoevolutionThis course · Lesson 18
Pollinator relationships like those of the monkeyflowers are a case of coevolution between partners.
Elsewhere on the siteFilms, simulations and method films in other courses
- Meiosis shufflerSimulation · Biology
Polyploid isolation depends on how chromosome sets pair and separate in meiosis.
- What the Rocks Still ShowFilm · Life Science
It shows the fossil evidence that is the only way to recognize species in extinct lineages.
Suggested by an AI model from the lessons themselves, then checked. How we use AI
Finish line
Test yourself
8 questions
Practice and MCAT-style, with explained answers.
Next · Lesson 8
History of Life: Transitions, Extinctions and Radiations
Species have been dying out for as long as there has been life. So how did a planet of microbes end up with so many kinds of living things?
Continue →