Ecology and Evolution · Skim version
Population Growth and Regulation
Read the full lesson → Skim the whole course →
The guiding idea
A population of 100 growing continuously at a constant per-capita rate of 0.2 per day reaches 739 in ten days, not 300. What has to change, per individual, for that growth to stop?
In a closed population, growth is the per-capita rate times the population's size, and a population is regulated only when its net per-capita rate falls as density rises, from positive below a level to negative above it (negative density dependence, which in real populations may act after a lag).
From the film: Watch the Per-Capita Rate
- In a closed population, growth is the per-capita rate, births minus deaths per individual, times the population size N.
- With a constant positive per-capita rate, each day's gain is larger than the last, so growth compounds.
- The logistic model assumes the per-capita rate falls in a straight line as N rises, reaching zero at the carrying capacity K.
- Total growth is largest halfway to K, where the S-shaped curve is steepest.
From the film: Catching the Brake
- Adding food and fencing out mammal predators raised snowshoe hare numbers, which shows both were limiting, but counts alone do not show density dependence.
- On Bahamian patch reefs, the fraction of young blue chromis that died rose with starting density when both resident and transient predators were present, measured across reefs within one generation.
- With only one predator group, no rise was detected, and one of those tests had low statistical power: not detected is not the same as absent.
- A brake makes net per-capita growth fall as density rises, so it is judged by per-capita measures, such as the fraction that die, not by the total number killed.
-
A fixed per-capita rate: exponential growth
-
A falling per-capita rate: the logistic model
-
Tilting the line: what counts as a brake
-
What regulates real populations
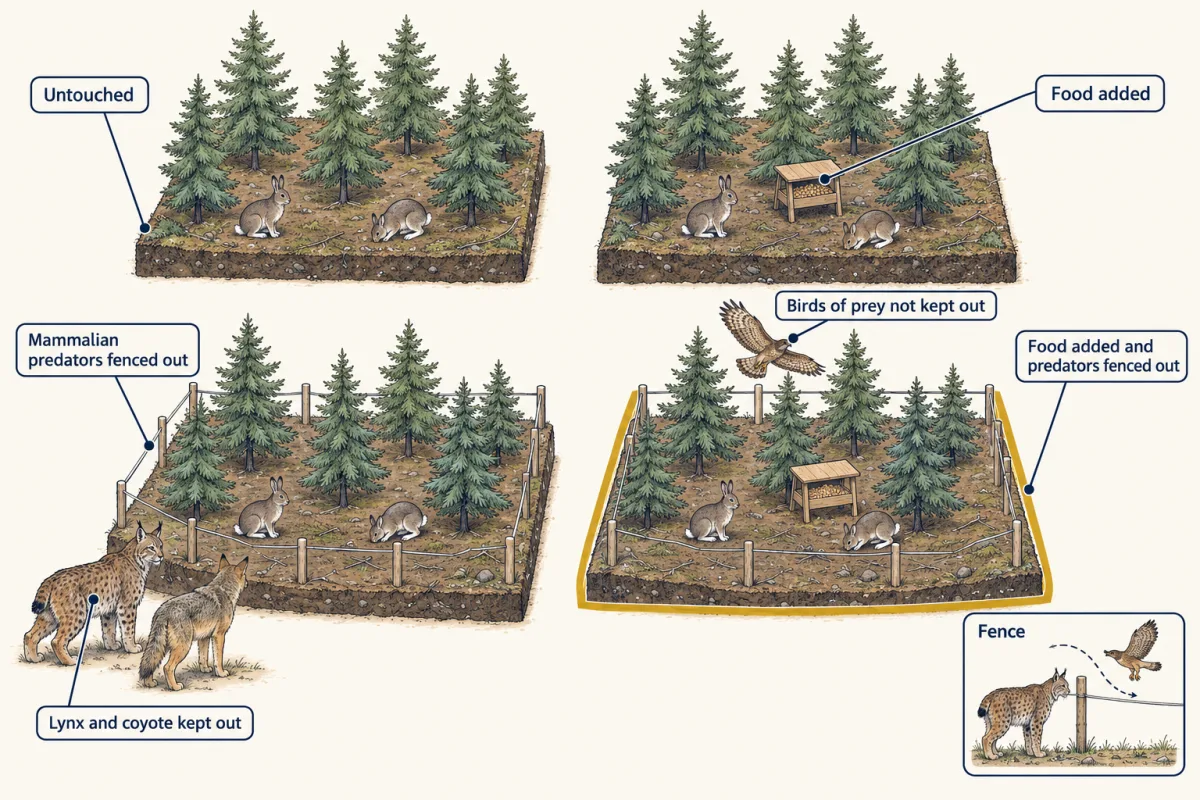
Food and predator removal showed what limited hare numbers, but each predator treatment was one block, and the fences let birds of prey through. AI-generated illustration 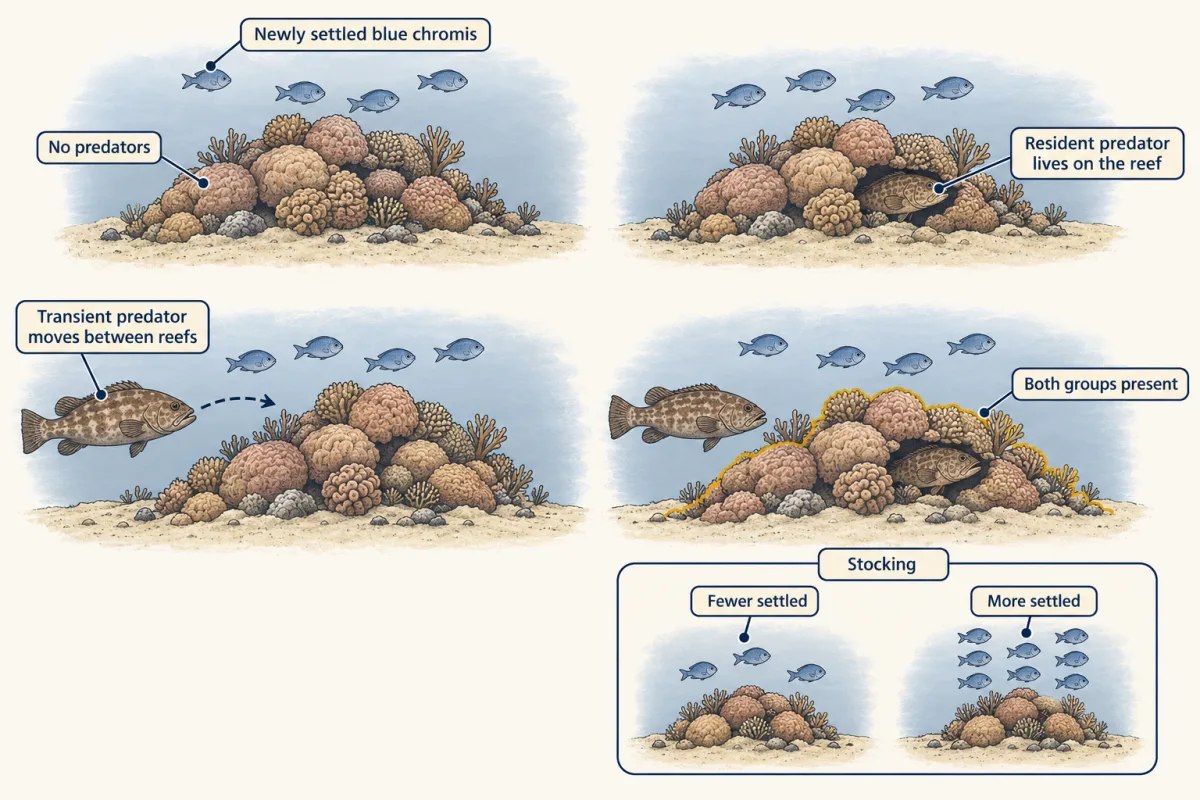
With both predator groups present, the fraction of young chromis that died rose with density, measured across reefs in one generation, not through time. AI-generated illustration -
Checking a model against data
-
Going deeper
Where this lesson fits
Before thisReview first
- Demography and SurvivorshipThis course · Lesson 13
It shows how r and lambda come from births and deaths in a life table, which this lesson uses directly.
- How to Test an Evolutionary ExplanationThis course · Lesson 1
It sets out how to tell a brief change in numbers from a tested explanation, which the field-data sections here rely on.
After thisStudy next
- CompetitionThis course · Lesson 16
Its competition models are built directly on the logistic, with each species' growth braked by crowding.
- Predation and Community EffectsThis course · Lesson 17
Its predator-prey models extend logistic prey growth, and it asks why predators keep rising after prey fall.
- Movement and Spatial PopulationsThis course · Lesson 15
It relaxes the closed-population assumption here by letting movement among patches rescue populations that would otherwise go extinct.
Elsewhere on the siteFilms, simulations and method films in other courses
- Grow a population, then add limitsSimulation · Biology
It lets you grow a population and then add limits, showing growth bending toward carrying capacity.
- Run a crab cove for ten yearsSimulation · Life Science
It runs a crab population over ten years, tracking additions and losses like the per-capita rate here.
- Why Growth BendsFilm · Biology
It shows how limits slow population growth near carrying capacity, the same logistic bending.
Suggested by an AI model from the lessons themselves, then checked. How we use AI