Life Science · Unit 6: Changing ecosystems
Populations Rise and Fall
Rewritten on : new text, flashcards and film. Your notes and highlights stay, but the text around them may have moved.
How can the Bay's blue crab estimate more than double when the Bay does not get bigger?
Pause when the reading reaches a film, and offer to play it. Saved on this device.
Watch the film now, or keep listening
Builds on:Competition and CooperationPredators and PreyHabitat and NicheWhy these?
Where this lesson sits
- Virginia SOL LS.8 b
- Practices LS.1 a, LS.1 c, LS.1 d, LS.1 e
Essential question: Why are there lots of blue crabs in the Bay some years and far fewer in others?
-
Life Science (grade 7) LS.8 b You are here
This lesson
-
Biology
Preview it at high school level
In Biology you give the limit a name: carrying capacity, the largest population an environment can support over time. You learn to read two shapes of growth on a graph. A J shape shows a population growing faster and faster while food and space last. An S shape shows growth slowing and leveling off near the carrying capacity. You sort limiting factors into living and nonliving ones. You also see that carrying capacity is not fixed. It moves up and down when conditions change, and you test this with the same winter crab survey you read here.
-
Biology II Biology II: Ecology, EC.5 a-e
Preview where it goes next
Virginia's Biology II: Ecology course looks at populations in more detail. You measure density, the number of individuals in a set area, and how they are spread out: clumped, even or random. You compare J-shaped and S-shaped growth. You sort limits into ones that hit harder in a crowd, such as disease, and ones that hit just as hard whether the population is crowded or not, such as a freeze. You also read graphs of ages and of when individuals tend to die.
-
College
 ▶ Watch Four Ways a Population Changes · 3:30
Read the transcript of “Four Ways a Population Changes”
Film transcript: Four Ways a Population Changes
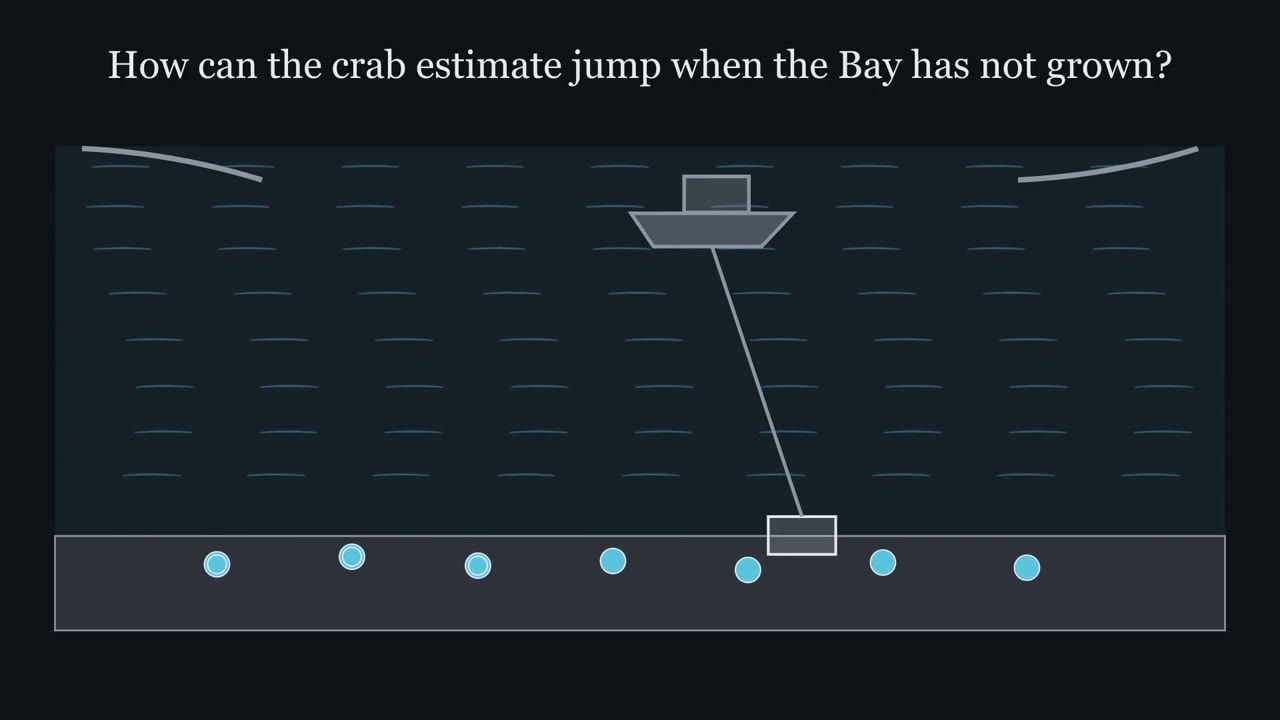
How can the Bay's crab estimate jump when the Bay has not grown? Watch a survey boat cross the winter water. Its dredge catches some crabs buried in the mud. Those catches become an estimate for the whole Bay. A moving estimate does not require a moving shoreline.
The earlier estimate appears as a bar. The next estimate appears beside it, much taller. These are estimates, not exact counts. The survey pattern is real, but it does not tell us the cause. So read height before hunting for explanations. To explain the change, begin with a population. A population is every member of the same species living in the same place. Put the Bay's crabs inside one window. Now track what enters and leaves that window. The boundary matters because movement crosses it. To explain the change, begin with the bays crabs inside one window. Births add crabs inside the window. Arrivals add crabs moving in. Deaths remove crabs.
Departures remove crabs moving out. Call births and arrivals additions. Call deaths and departures losses. Population change is the balance between them. Additions and losses can occur at the same time while the population changes. Imagine the loss arrows getting wider while the addition arrows stay unchanged.
What should happen to the number of crabs inside? Follow the arrows before you decide. Watch the balance, not any single dot. The number falls because losses now exceed additions. Reverse the balance, and the number rises. Match the arrows, and the number stays steady. This gives the rule: populations rise when additions exceed losses, and fall when losses exceed additions. The dots show direction, not a forecast. A limiting factor changes at least one addition or loss. A very cold winter can increase deaths. Better shelter can lower deaths among young crabs. Heavy harvest increases losses caused by people. Each factor matters through the same balance.
Different factors can push the same arrow. The balance tells whether a population rises or falls over a chosen time. It cannot identify a cause by itself. Scientists need measurements of cold, shelter, predators, harvest, and other factors. The survey gives the pattern. Evidence about the arrows tests explanations. That extra evidence separates a pattern from a tested cause. Return to the winter bars. If the estimates are close to the truth, their jump means additions beat losses during the interval. The bars alone cannot say why. Keep the Bay window in mind. Every explanation must show which addition or loss changed, and what evidence supports it.
From the film
- Populations rise when additions exceed losses, and fall when losses exceed additions.
- Births and arrivals are additions; deaths and departures are losses.
- A survey estimate can change sharply even when the place stays the same size.
- A limiting factor changes at least one addition or loss.
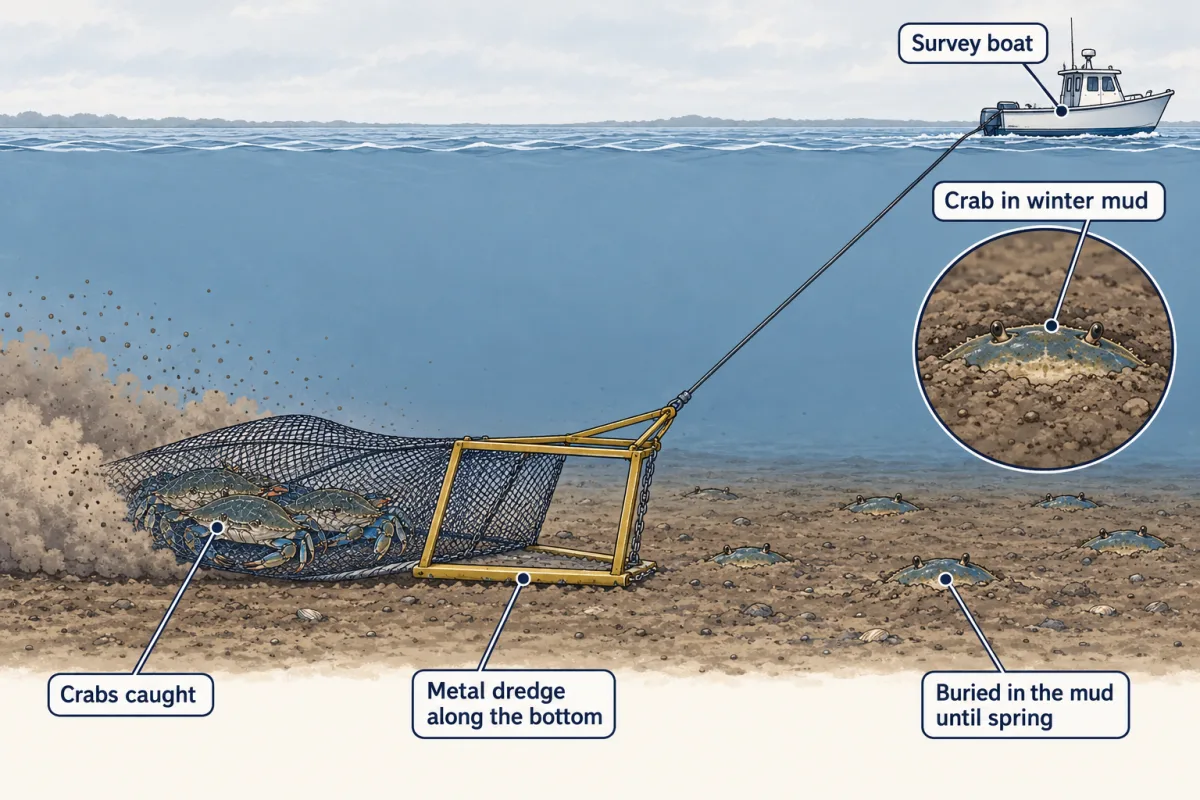
Every winter, survey teams from Maryland and Virginia tow metal dredges along the bottom of the Chesapeake Bay. They catch blue crabs that lie buried in the mud until spring. Scientists use catches from many sites to estimate how many crabs live in the whole Bay. The estimate was 367 million in winter 1991–1992 and 852 million the next winter. The Bay did not get bigger. How could its crab estimate more than double?
What do you think? Decide before you read.
-
Scientists disagree: The winter survey has run since about 1990. Its estimate has gone up and down many times. Scientists see the same rise and fall in many other populations.
What scientists think
Scientists disagree: The winter survey has run since about 1990. Its estimate has gone up and down many times. Scientists see the same rise and fall in many other populations.
-
Scientists disagree: Recovery depends on how bad the change was and whether its cause keeps going. In some places after very hot forest fires, few trees have grown back because few trees were left to drop seeds. Crab managers warned that rebuilding could take years of careful harvest.
What scientists think
Scientists disagree: Recovery depends on how bad the change was and whether its cause keeps going. In some places after very hot forest fires, few trees have grown back because few trees were left to drop seeds. Crab managers warned that rebuilding could take years of careful harvest.
-
Scientists disagree: Lab tests show cold and low salt work together on crab survival. Field tests show big crabs eat many small ones. Scientists who study crabs point out that a graph of crab numbers alone cannot tell which cause mattered most.
What scientists think
Scientists disagree: Lab tests show cold and low salt work together on crab survival. Field tests show big crabs eat many small ones. Scientists who study crabs point out that a graph of crab numbers alone cannot tell which cause mattered most.
Explain: what makes a population grow or shrink
- population
- limiting factor
- biotic factor
- abiotic factor
- competition
- overharvesting
- sustainable
- biodiversity
The first film built a four-arrow balance for a population, all the members of one species living in the same place. “Arrival” and “departure” mean moving into or out of the place being studied.
Predict. Suppose births and deaths balance, but more crabs arrive than leave. Does the population rise, fall or stay the same?
Check your prediction
It rises. Births and deaths cancel, while net arrivals add crabs.
For the survey, the estimate rose by 485 million crabs, to about 2.32 times its size.
A limiting factor is anything that keeps a population from growing larger. A limiting factor changes at least one addition or loss. In an earlier lesson you met food, water, shelter, disease and predators as limiting factors.
- A biotic factor is a living part of the environment, such as predators, food or grass.
- An abiotic factor is a nonliving part of the environment, such as temperature or salt in the water.
| Factor | Kind | What changes first? |
|---|---|---|
| Very cold winter | Abiotic | More crabs die before spring, increasing losses. |
| Low salt in cold water | Abiotic | In lab tests, fewer crabs survived, increasing losses. |
| Big crabs | Biotic | In field studies, adult crabs ate many young crabs, increasing losses of young crabs. |
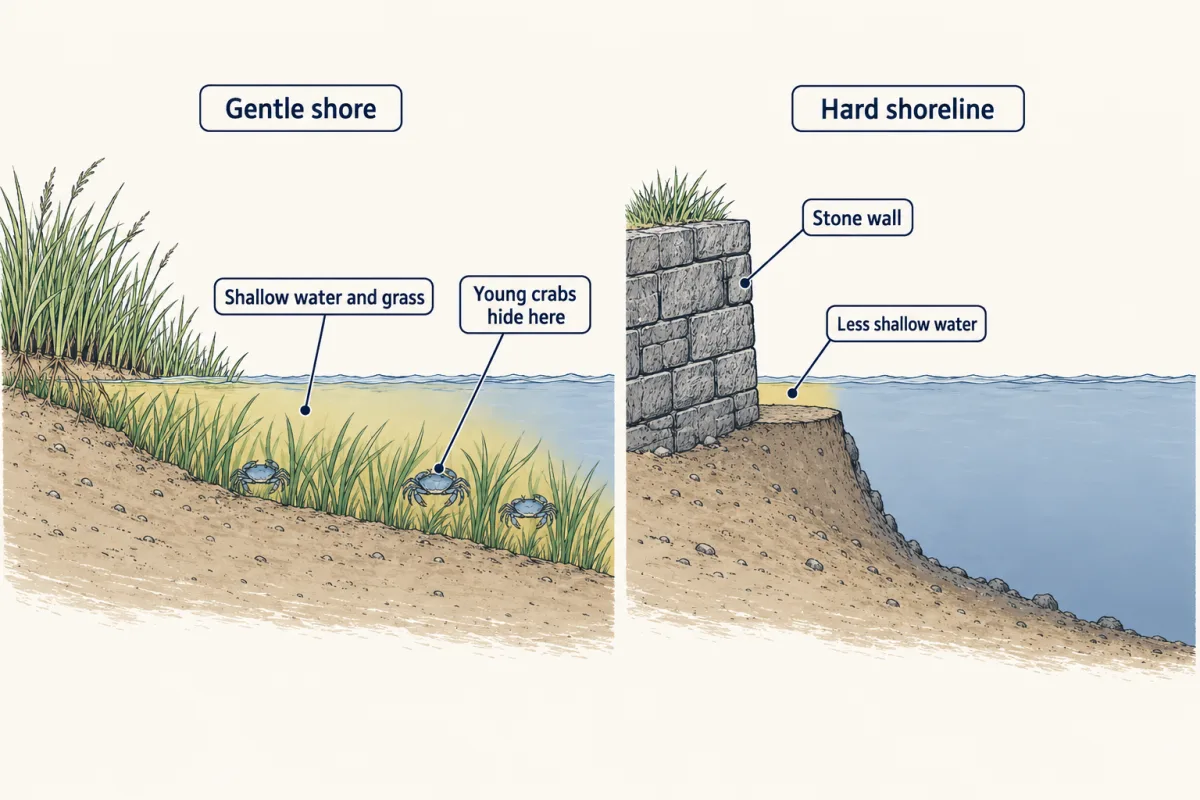
| Shallow water and grass | Abiotic habitat and biotic shelter | Hiding places can lower losses by protecting young crabs from big crabs. |
| Harvest by people | Human action | Crabbers remove crabs, increasing losses caused by people. |
Competition is the struggle among living things that need the same limited resource, such as food or a hiding place. With a smaller patch of grass, some young crabs find cover, and others are left exposed and may be eaten.
Changes can also move where a population lives. Lab tests suggest that cold limits how far north blue crabs can survive.
Predict. If northern winters stay milder, what could happen to the northern edge of the crab’s range? What could lab tests alone not show?
Check your prediction
Warmer winters could let crabs live farther north. But lab tests alone cannot show that the move has happened; that takes field records of crabs found farther north over many years.
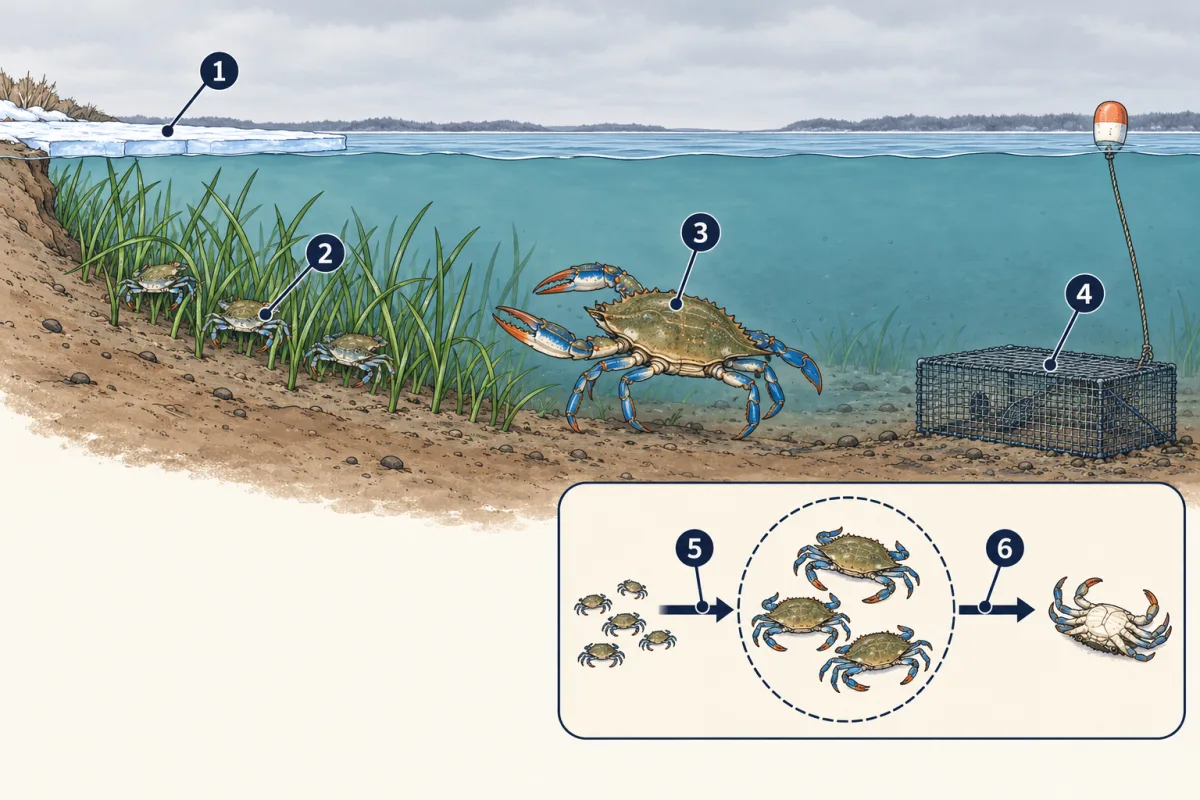
- very cold winter
- young crabs
- big crabs
- harvest
- births
- deaths
- blank
- young crabs
- big crabs
- blank
- blank
- blank
Word bank: births, deaths, harvest, very cold winter
- blank
- blank
- blank
- blank
- blank
- blank
Check your labels
- very cold winter
- young crabs
- big crabs
- harvest
- births
- deaths
Explore: run a crab cove for ten years
The model shows one population bar per year. Choose how much underwater grass young crabs can hide in, mild or harsh winters, and no, moderate or heavy harvest. Test one change at a time; this is not a forecast of the real Bay.
- Bar: crabs in the cove at the end of the year
- Blue column: a harsh winter
- Square: a crab pot (1 is moderate harvest, 2 is heavy)
- Dot: this winter was drawn at random
- Orange line: expected value (the average of many random draws)
In this sketch, all the numbers are made up. The cove starts half full and holds 100 crabs at most. Each year new young crabs that survive are added: 25, 50 or 100 for every 100 crabs with low, medium or high grass. Crowding cuts this to nothing as the cove fills. The crowding rule is invented for this sketch. A mild winter then removes 15 of every 100 crabs and a harsh winter removes 50. Harvest then removes 0, 15 or 45 of every 100. A random winter is harsh 1 year in 3. There is one kind of crab, no ages, and no predators drawn.
Rule to keep: a population grows when more crabs are added than are lost, and shrinks when more are lost than are added.
Predict. Keep grass high, winters mild and harvest off. Then make only year 4 harsh. What should happen to the year 4 bar, and to the bars after it?
Check your prediction
The year 4 bar drops, because the harsh winter raises deaths that year. Year 5 starts from fewer crabs, so its bar is lower than in the all-mild run but higher than year 4. With mild winters after that, the bars climb back toward the earlier level in this model. A real population does not always recover.
Try this.
- Run high grass, mild winters and no harvest. Describe the bars.
- Make only year 4 harsh. Check your prediction.
- Use medium grass and heavy harvest for five years, then moderate harvest. Predict, then test, the recovery.
In the cove, the harsh winter was natural and the harvest was human, yet both widened a loss arrow. The second film follows what pushes each arrow.
Read the transcript of “What Pushes the Four Arrows?”
Film transcript: What Pushes the Four Arrows?
The first film followed additions and losses through one population window. What pushes those arrows in the real Bay? Keep that window open as cold, shelter, predators, and harvest change around it. The same colour map stays.
Scientists ask two separate questions about a factor. First, which living and nonliving parts are involved? Biotic factors are living parts, such as grass and big crabs. Abiotic factors are nonliving parts, such as temperature and salt. Second, is the change natural, human-caused, or both? A cold winter is abiotic and natural. A stone wall is abiotic and human-made. Watch a nonliving factor act. During a very cold winter, more buried crabs can die before spring.
Lab tests also show especially low survival in cold, low-salt water. Both conditions can widen the death arrow. They may also act together. Now watch living and nonliving parts work together. Young crabs use grass and shallow water as refuge from bigger crabs. With less refuge, more young crabs may stay exposed. That can increase deaths from predation.
Refuge changes risk, not certainty. Suppose a stone wall replaces a gently sloping shore. The shallow refuge becomes smaller. Which population arrow could change first, and in which direction? Think in arrows, not labels.
The death arrow could widen if more exposed young crabs are eaten. The wall is not the only possible cause of change. It alters habitat, while cold, harvest, and other factors may change other arrows. That wording keeps the claim honest. Harvest is a human-caused loss. Overharvesting means removing a species faster than it can replace itself.
Female crabs carry eggs for the next generation. Leaving more adults can support later births, but the other arrows keep moving. More adults do not guarantee more survivors. Sustainable harvest means taking only as many as the population can replace over time. A harvest limit can reduce one loss and leave more adults to reproduce. A harsh winter, poor refuge, or few new young can still slow recovery. So recovery is not certain. Managers keep measuring every year. A population graph shows what changed, not which factor caused it. To test a cause, compare the graph with measurements of that factor.
Survey estimates, experiments, and models each add evidence. None makes every arrow stand still. Together, they narrow possible explanations. Return to the shared window. Natural events and human actions can change the same additions and losses.
Management can change an arrow, but not command the whole population. The balance still decides the direction of change.
From the film
- Populations rise when additions exceed losses, and fall when losses exceed additions.
- Biotic factors are living; abiotic factors are nonliving.
- Natural events and human actions can change the same additions and losses.
- Harvest limits can reduce one loss and leave more adults to reproduce, but recovery is not certain.
Explain: natural causes and human causes
The second film sorted each factor two ways: living or nonliving, and natural or human-caused. Here are cases it left out.
Some changes are natural.
- A flood can drop a population below its earlier size.
- A wildfire can kill grown trees. In some pine forests, the heat also opens cones and drops seeds, so new trees start. After very hot fires elsewhere, few trees were left nearby to drop seeds, and the forest may not return.
- A climate shift over many years can change where a species can live.
Predict. A flood pushes crabs out of a cove, but they survive. Which loss changed?
Check your prediction
Departures increased. Deaths did not, because the crabs survived.
People cause changes too.
- Pollution. In one study, untreated rain runoff from a busy road killed the adult coho salmon placed in it. After the runoff flowed through soil, it did not.
- Habitat destruction, such as the second film’s stone wall (see the figure below).
- Overharvesting means people catch or collect a species faster than it can replace itself. Managers set catch limits on blue crabs and on menhaden, a small fish, to guard against this.
When a change is large, an ecosystem can lose species. Biodiversity is the variety of living things in an area. When one population crashes, the animals that eat it and the things it eats can change too. Larger changes, such as dead zones and climate change, are in Big Changes.
Explain: limits that help a population recover
In 2008, Virginia reported that too many blue crabs were being caught each year. Virginia and Maryland set a plan to catch about 34 percent fewer female crabs than in 2004 to 2007. Females carry the eggs, so leaving more of them can mean more young crabs later.
This is sustainable harvest: taking only as many as the population can replace, so it lasts. A limit is not a promise, so managers keep counting. The 2008 report warned that rebuilding could take several years. In the survey, adult females rose after the plan began, then fell back by winter 2011–2012.
- When blank changed, the crab population went blank because blank.
- One cause I cannot rule out is blank, because the table does not show blank.
Elaborate: read the winter crab survey
| Survey winter | Total crabs (millions) | Young crabs (millions) | Adult females (millions) |
|---|---|---|---|
| 1989–1990 | 791 | 463 | 117 |
| 1991–1992 | 367 | 105 | 167 |
| 1992–1993 | 852 | 503 | 177 |
| 2000–2001 | 254 | 156 | 61 |
| 2007–2008 | 293 | 166 | 91 |
| 2011–2012 | 765 | 581 | 95 |
| 2018–2019 | 594 | 324 | 191 |
| 2021–2022 | 227 | 101 | 97 |
| 2024–2025 | 238 | 103 | 108 |
| 2025–2026 | 349 | 228 | 81 |
These are Bay-wide estimates from the Winter Dredge Survey of the Maryland Department of Natural Resources and the Virginia Institute of Marine Science, published by Maryland DNR (opened October 2026). Teams sample many places in the Bay, never just one station. The total also counts adult males. Young crabs are ones that joined the population in the summer and fall before the survey. New, tighter limits on female harvest began in spring 2008, after that winter’s survey. Maryland reported that about 12 percent of adult females died during the cold winter of 2025–2026.
From 1991–1992 to 1992–1993, most of the jump was young crabs, while adult females barely changed. Young crabs make a round trip. Females carry their eggs toward the mouth of the Bay, where the larvae hatch. The larvae drift out to sea, and young crabs later move back in. For the whole Bay, that path can include a birth, a departure and a later arrival. So the survey’s young-crab number is not a direct count of births. It also depends on how many larvae survive at sea and make it back to the Bay.
From 2007–2008 to 2011–2012, the total rose by 472 million, but adult females rose by only 4 million. Most of the later total was young crabs, so the table does not show that the female-harvest limits alone caused the rise.
Predict. From 2024–2025 to 2025–2026, did the total and adult females move in the same direction?
Check your prediction
No. The total rose by 111 million, from 238 million to 349 million. Adult females fell by 27 million, from 108 million to 81 million. Different parts of a population can move in different directions.
- Which winter had the highest total? Which had the lowest?
- Find the mean number of adult females for the last four winters in the table.
- Choose one rise or fall. Name one limiting factor that could fit it, then explain why the table cannot prove that cause.
Claim, evidence, reasoning
Make a claim that answers the question: why are there lots of blue crabs in the Bay some years and far fewer in others? Use the survey table.
Start with: The number of crabs changes from year to year because blank.
Start with: From blank to blank, the total changed from blank to blank million crabs.
Start with: This supports my claim because blank can change how many crabs survive, but the table cannot tell us blank.
Compare with a model answer
The number of crabs changes because several limiting factors change from year to year. The total more than doubled from 367 million in 1991–1992 to 852 million in 1992–1993, then fell to 254 million by 2000–2001. Most of that jump was young crabs, and the number of young crabs that join the population changes a lot from year to year. Cold winters, hiding places, big crabs and harvest can each change how many crabs survive. The table has limits. It shows estimates, not exact counts, and only ten winters. It does not measure any cause, so we would need temperature, grass and harvest data to test which one mattered.
Saved in this browser only.
Design problem
Soapy water can run off driveways into streams. Plan a fair test of whether soapy water changes how a population of duckweed grows. Duckweed is a tiny floating plant made of flat, leaf-like parts called fronds. It makes new fronds by budding, and each one can become a new plant.
Saved in this browser only.
One way to do it
- Question: How does the amount of dish soap in water affect the growth of a duckweed population?
- Independent variable: soap mixed into the pond water before filling the cups, for example 0, 0.5, 1 and 2 milliliters per liter.
- Dependent variable: the number of duckweed fronds, counted every two days for two weeks.
- Control: cups with no soap.
- Constants: the same pond water, cup size, water volume (200 milliliters), light, temperature and starting number of fronds (10).
- Repeated trials: four cups for each soap level.
- Safety: wear goggles when you measure soap, wash your hands after handling pond water, and do not dump the plants or soapy water outside.
- What results would mean: if cups with more soap end with fewer fronds than the control, soap acted as a limiting factor in this test.
Evaluate: check your thinking
Remember the balance of additions and losses: in the Bay, the factors that push it keep changing. A survey pattern does not prove one cause, and careful harvest limits can help recovery without promising it.
Science practices you used: asking a question about a real pattern, using a model and naming what it leaves out, reading a data table and finding a mean, planning a fair test with a control, and making a claim backed by evidence and reasoning.
Going deeper
The coho salmon runoff study
In the study, all of the adult coho salmon placed in untreated rain runoff from a busy Seattle road died within 24 hours. All 20 coho in the same runoff after it flowed through soil survived.
How many places the winter survey samples
Recent winter surveys sample about 1,500 sites; the early surveys sampled fewer.
The female counts after 2008
In the survey, adult females rose from 91 million in winter 2007–2008 to 246 million in winter 2009–2010, then fell back to 95 million by winter 2011–2012.
Your notes
Select any text in the lesson to highlight it or add a note to it. Your highlights and notes are saved in this browser and collected in your notebook.
This browser is not letting the site save anything (a private window or strict privacy settings), so highlights and notes will be lost when you leave the page.
How we measure it
Winter dredge survey
In winter, boats tow a dredge along the Bay bottom at randomly chosen sites deeper than about 5 feet and catch blue crabs buried in the mud. The crabs are counted and sorted by size and sex at each site.
Abundance estimation
Scientists correct the catches for crabs the dredge missed and crabs that died during the winter, then scale up to the whole Bay. The shallows the boats cannot reach are assumed to hold about as many crabs per area. The result is an estimate, not an exact count.
Controlled survival trials
Crabs are kept in tanks where one condition, such as water temperature or salt level, is changed and the rest stay the same. Counting the survivors shows how much that condition matters.
Where this lesson fits
Before thisReview first
- Competition and CooperationThis course · Lesson 17
It introduced limited resources and limiting factors like food and shelter, which this lesson uses to explain why populations change.
- Predators and PreyThis course · Lesson 16
You need how predators remove prey, a loss arrow, to see why big crabs eating young crabs shrinks the population.
- Habitat and NicheThis course · Lesson 19
It explains how habitat and shelter affect where a species lives, which this lesson uses for grass and range shifts.
After thisStudy next
- Big Changes: Dead Zones, Storms and ClimateThis course · Lesson 24
It follows pollution and other large changes in the Bay to dead zones that raise losses for crabs and fish.
- People Change HabitatsThis course · Lesson 25
It builds on human causes of population change by showing how habitat change and new species alter additions and losses.
- Helping Ecosystems RecoverThis course · Lesson 26
It takes the idea that limits can help recovery and shows how people bring back a declining population.
Elsewhere on the siteFilms, simulations and method films in other courses
- Grow a population, then add limitsSimulation · Biology
Add limits to a growing population and watch how crab-like numbers level off.
Suggested by an AI model from the lessons themselves, then checked. How we use AI
Finish line
Test yourself
9 questions
Practice and MCAT-style, with explained answers.
Next · Lesson 24
Big Changes: Dead Zones, Storms and Climate
How can fertilizer that helps crops grow leave fish and crabs without enough oxygen in the deep water of the Chesapeake Bay?
Continue →