Why Growth Bends
Read the transcript of “Why Growth Bends”
Film transcript: Why Growth Bends
Why does fast population growth bend instead of climbing forever? Watch a Chesapeake creek as the blue crab population changes. The water keeps moving, but food and hiding places are limited. Predators and disease also affect survival. Something in this picture must push back as the population grows.
A population is all the members of one species living in the same area at the same time. Teal crab symbols track its size. Gold food and green shelter show resources. Red arrows show living challenges, such as predators and disease. A pale blue band shows cold water, a nonliving challenge. Together, these living and nonliving factors can limit growth. Start with a small population and plentiful resources. The population increases by the same fraction each step, so the number added grows. That pattern is exponential growth. Its computed curve bends upward like a J. This model is schematic, but the curve follows its stated rule. Now predict what makes this curve bend.
Must the food and shelter vanish completely? Or can crowding strengthen limits before they are gone? Keep your answer while the creek continues moving. Crowding means more crabs share the same food and shelter. Competition grows. Disease may spread more easily, and predators may find more prey. Fewer young survive for each crab already present. The population can still grow, but its growth slows before every resource disappears. In the simplest limited-growth model, that slowing turns the J into an S. The computed line approaches carrying capacity. Carrying capacity is the largest population this environment can support over time, with its resources and challenges.
It is a level approached, not a wall that nothing crosses. Read the S-shaped curve from beginning to end. Growth starts slowly because few individuals can reproduce. Then numbers rise faster while resources are plentiful. Finally, growth slows near carrying capacity. With little movement in or out, births and deaths are about equal there. The computed line simply approaches carrying capacity. In real populations, births, deaths and movement continue. When that balance shifts, size can move up and down around the level. That balance, kept by ongoing change, is dynamic equilibrium. Real populations may also overshoot or decline. The S shape is a useful model, not a required life story.
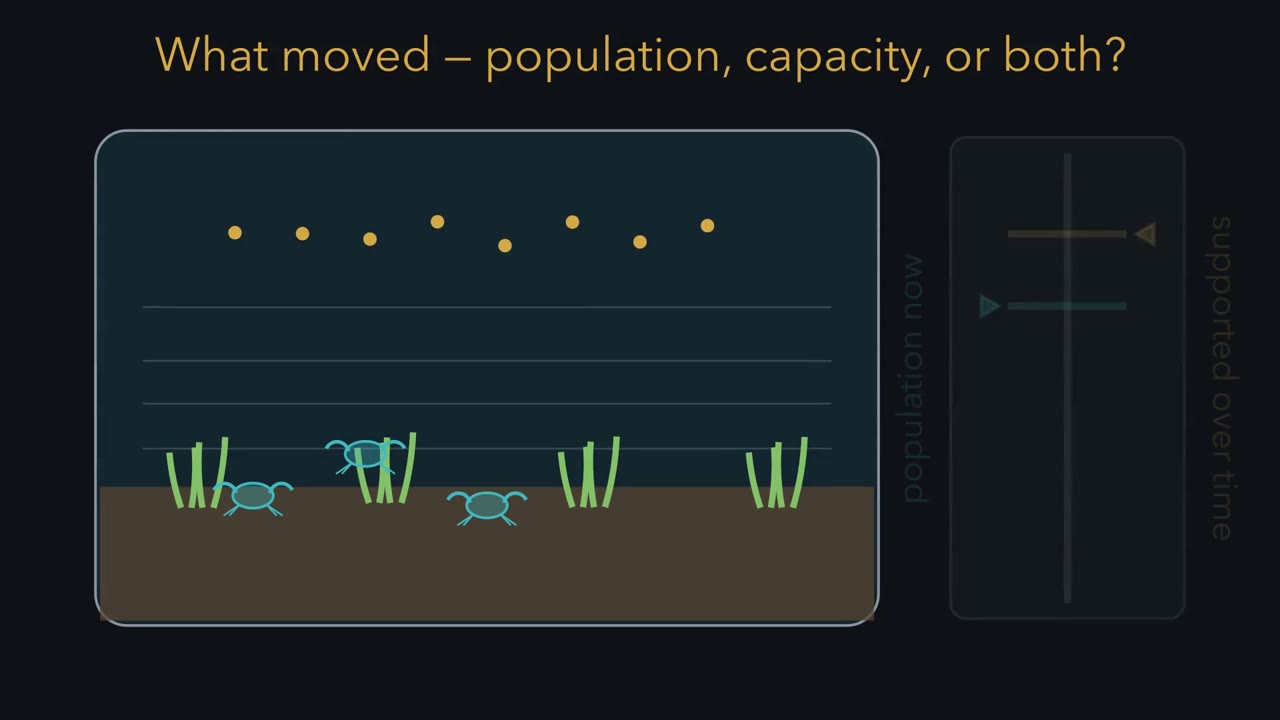
Return to the creek. More crabs made the same resources harder to share, and several challenges grew stronger. Those limits reduced growth before the creek was empty. That is why the curve bent. The next question is whether the support level itself can move.
Why can the number of blue crabs in the Chesapeake Bay change by more than 100 million from one winter to the next?
Continue in the lesson: Populations and Carrying Capacity →
3:37 · Free, with captions and a transcript. The lesson has the full text, the questions and the sources.
More films from this lesson
How this film was made. Narration: written from this lesson's text and read by an AI narrator voice (Kokoro, af_heart). Animation: AI-generated in code (Manim) by Claude, a schematic with no drawn molecular structures. Captions come from the narration script. See something wrong? Report it.