Biology · Unit 7: Ecosystems
Populations and Carrying Capacity
Rewritten on : new text, flashcards and film. Your notes and highlights stay, but the text around them may have moved.
Why can the number of blue crabs in the Chesapeake Bay change by more than 100 million from one winter to the next?
Pause when the reading reaches a film, and offer to play it. Saved on this device.
Watch the film now, or keep listening
Builds on:Homeostasis in ActionWhy these?
Where this lesson sits
- Virginia SOL BIO.8a
- Practices BIO.1a, BIO.1c, BIO.1d, BIO.1e, BIO.1f
Essential question: How many organisms can an ecosystem really support, and why do populations rise and fall?
-
Life Science (grade 7) LS.6 b and LS.8 b
Review it at grade 7 level
Every animal population needs food, water and shelter. When one of these runs short, or when disease or predators increase, fewer animals survive and the population gets smaller. When conditions improve, the population can grow again. These things that hold a population back are called limiting factors. You may have read graphs where a predator population rises and falls a little after its prey population does. In Biology you add the idea of carrying capacity, the largest population an environment can support over time, and you learn to read the shape of a growth curve.
-
Biology BIO.8a You are here
This lesson
-
Biology II Biology II: Ecology, EC.5 a-e
Preview where it goes next
Virginia's Biology II: Ecology course describes populations in more detail. You measure density, the number of individuals per unit of area, and dispersion, whether individuals are clumped, evenly spaced or random. You compare J-shaped and S-shaped growth using growth rates, and you sort limiting factors into density-dependent ones, which hit harder in a crowd, and density-independent ones, such as a freeze. You also read age-structure diagrams and survivorship curves, which show at what ages individuals tend to die, and you compare species that produce many young with little care to species that produce few young with much care.
-
College
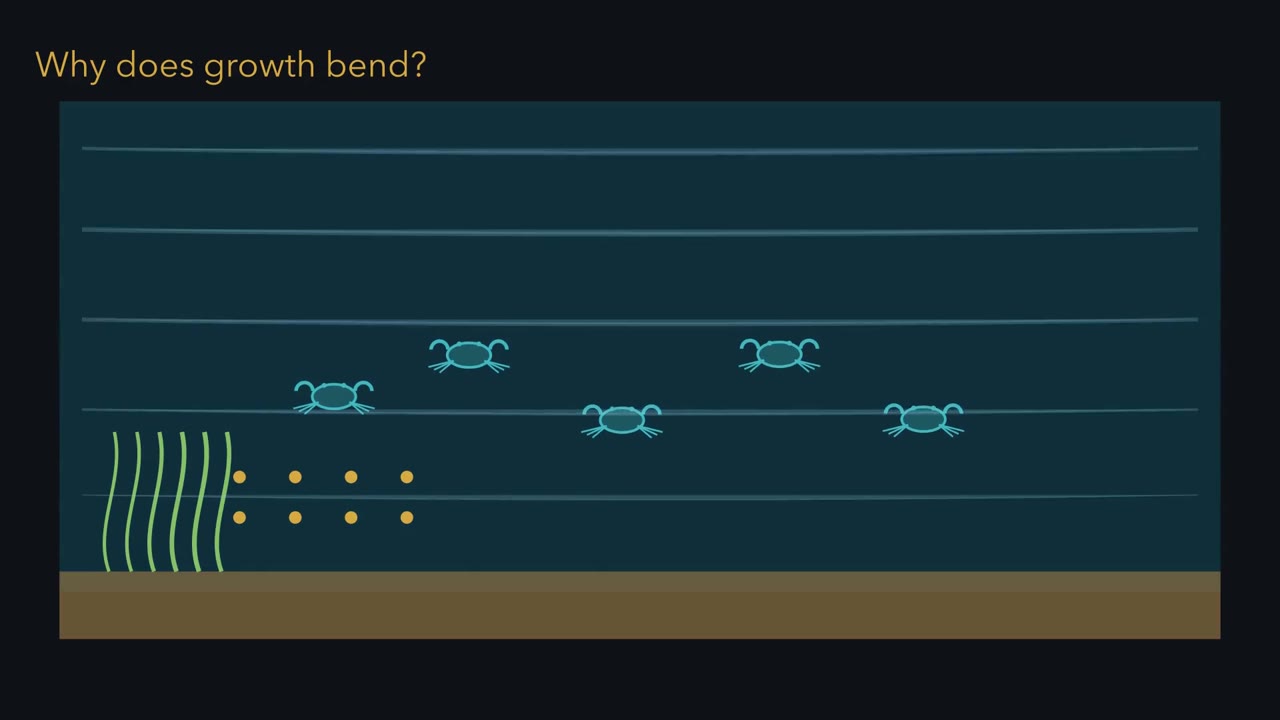 ▶ Watch Why Growth Bends · 3:37
Read the transcript of “Why Growth Bends”
Film transcript: Why Growth Bends
Why does fast population growth bend instead of climbing forever? Watch a Chesapeake creek as the blue crab population changes. The water keeps moving, but food and hiding places are limited. Predators and disease also affect survival. Something in this picture must push back as the population grows.
A population is all the members of one species living in the same area at the same time. Teal crab symbols track its size. Gold food and green shelter show resources. Red arrows show living challenges, such as predators and disease. A pale blue band shows cold water, a nonliving challenge. Together, these living and nonliving factors can limit growth. Start with a small population and plentiful resources. The population increases by the same fraction each step, so the number added grows. That pattern is exponential growth. Its computed curve bends upward like a J. This model is schematic, but the curve follows its stated rule. Now predict what makes this curve bend.
Must the food and shelter vanish completely? Or can crowding strengthen limits before they are gone? Keep your answer while the creek continues moving. Crowding means more crabs share the same food and shelter. Competition grows. Disease may spread more easily, and predators may find more prey. Fewer young survive for each crab already present. The population can still grow, but its growth slows before every resource disappears. In the simplest limited-growth model, that slowing turns the J into an S. The computed line approaches carrying capacity. Carrying capacity is the largest population this environment can support over time, with its resources and challenges.
It is a level approached, not a wall that nothing crosses. Read the S-shaped curve from beginning to end. Growth starts slowly because few individuals can reproduce. Then numbers rise faster while resources are plentiful. Finally, growth slows near carrying capacity. With little movement in or out, births and deaths are about equal there. The computed line simply approaches carrying capacity. In real populations, births, deaths and movement continue. When that balance shifts, size can move up and down around the level. That balance, kept by ongoing change, is dynamic equilibrium. Real populations may also overshoot or decline. The S shape is a useful model, not a required life story.
Return to the creek. More crabs made the same resources harder to share, and several challenges grew stronger. Those limits reduced growth before the creek was empty. That is why the curve bent. The next question is whether the support level itself can move.
From the film
- Limits slow population growth near carrying capacity.
- A population is one species living in the same area at the same time.
- Exponential growth increases a population by the same fraction each step while resources are plentiful.
- Carrying capacity is the largest population an environment can support over time with its resources and challenges.
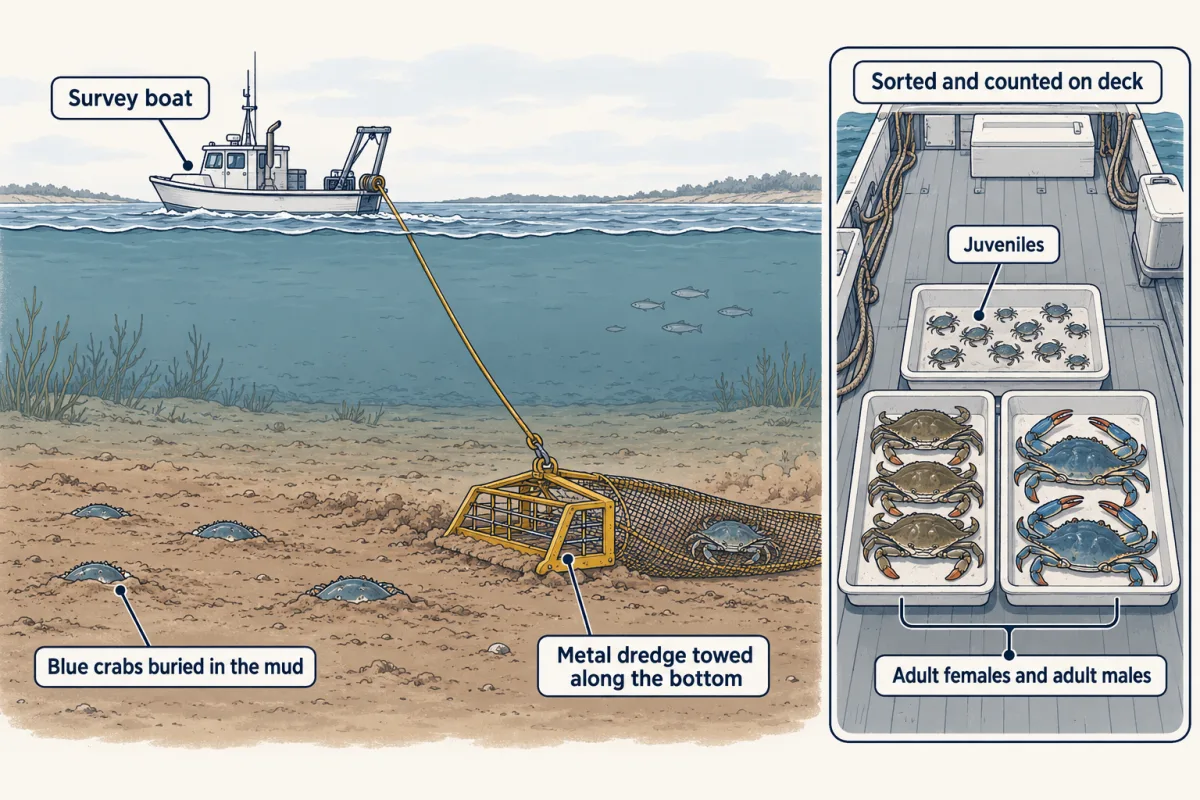
Every winter, crews from Virginia and Maryland drag metal dredges along the Chesapeake Bay bottom at about 1,500 sites. From one winter to the next, their estimate of the crab population can change by more than 100 million. The Bay’s resources are limited. Did the number of crabs the Bay can support change, did the population move relative to that same level, or both? A count alone cannot answer, so this lesson uses a growth model and the winter survey to separate those possibilities.
What do you think? Decide before you read.
-
Scientists disagree: In many populations that scientists follow, growth slows down long before the food is gone. Crowding brings more competition, more disease and more predators, and food is only one of many limits. Graphs of counts made over many years often level off and wobble instead of crashing to zero.
What scientists think
Scientists disagree: In many populations that scientists follow, growth slows down long before the food is gone. Crowding brings more competition, more disease and more predators, and food is only one of many limits. Graphs of counts made over many years often level off and wobble instead of crashing to zero.
-
Scientists disagree: The largest population an area can support depends on its food, shelter and enemies, and those can change over the years. Losing food or hiding places can lower it. A hard freeze that leaves food and shelter unchanged is different: it kills animals and pushes a population below that level for a while. Ecologists see this when the level that a population settles around moves up or down.
What scientists think
Scientists disagree: The largest population an area can support depends on its food, shelter and enemies, and those can change over the years. Losing food or hiding places can lower it. A hard freeze that leaves food and shelter unchanged is different: it kills animals and pushes a population below that level for a while. Ecologists see this when the level that a population settles around moves up or down.
-
Scientists disagree: People catch fish and crabs, build on shorelines, and change the water that runs into rivers and bays. Each of these can change how many animals are born or survive. In the Chesapeake Bay, crabbing removes crabs every year.
What scientists think
Scientists disagree: People catch fish and crabs, build on shorelines, and change the water that runs into rivers and bays. Each of these can change how many animals are born or survive. In the Chesapeake Bay, crabbing removes crabs every year.
Explore: grow a population, then add limits
The simulation uses made-up units and changes one part of the model at a time. Set the starting number, growth rate and carrying capacity, then compare unlimited and limited growth or add a cold winter or more predators.
- your population
- before your last change
- carrying capacity
In this sketch, more predators lower the carrying capacity, so they work only with limited growth. Each disturbance adds one step, and three disturbances is the maximum.
- Time step
- 0
- Population (relative units)
- 10
- Added in the last step
- none yet
- Carrying capacity now
- 500
Assumptions in this sketch: all numbers are relative units, not counts of any real animal. Each step adds the growth rate times the population. With limited growth, that gain shrinks to zero as the population reaches the carrying capacity. In this sketch a cold winter is a one-time loss: it removes 40% of the individuals present, before that step’s growth, and leaves the carrying capacity as set. In this lesson a single hard freeze lowers the population but leaves carrying capacity unchanged; only a lasting change in the resources or conditions that support the population moves it. More predators are such a lasting change here: they lower the carrying capacity by 25% for the rest of the run. The 40% and 25% are invented sizes, in relative units. There is no chance in this sketch, so expected and observed are the same.
With plenty of resources a population grows in a J shape; as limits set in, the curve bends into an S shape that levels off near the carrying capacity, and that level can move when conditions change.
Try this.
- Choose unlimited growth. Sketch the shape you expect after 20 time steps, then run it.
- Switch to limited growth with the same starting number and growth rate. Mark where you expect the line to settle, then test it.
- Once the line is level, add a cold winter. Mark what you expect immediately and several steps later, then run it.
Predict. Keep carrying capacity unchanged but raise the growth rate. Will the population settle higher, or reach about the same level sooner?
Check your prediction
It reaches about the same level sooner. In this simple model, the growth rate changes the trip, while carrying capacity sets the level approached.
Explain: who lives together and what holds them back
- population
- community
- ecosystem
- biotic factor
- abiotic factor
- competition
- cooperation
- limiting factor
- exponential growth
- carrying capacity
- extinction
- dynamic equilibrium
Think about one creek flowing into the Bay, with blue crabs, fish, clams, marsh grass and microbes, plus mud, water and sunlight.
A population is all the members of one species that live in the same area at the same time. In species that reproduce sexually, they can breed with each other. The blue crabs in the Bay this winter are a population. Its members compete for food, water, shelter and mates.
A community is all the populations of different species that live in an area and interact. The crabs, fish, clams and marsh grass of the creek form a community.
An ecosystem is a community together with its nonliving surroundings, such as water, mud, air and sunlight.
Two kinds of factors affect that population:
- A biotic factor is a living part of the environment, such as predators, food, competitors and disease.
- An abiotic factor is a nonliving part of the environment, such as temperature, moisture, air, salinity (salt level) and pH.
Living things interact in many ways, including predation, when one eats another. Competition happens when individuals need the same limited resource, such as food or a hiding place. Cooperation happens when individuals work together and both gain, as when wolves hunt in a pack.
A limiting factor is anything that keeps a population from growing larger. Examples for blue crabs:
| Factor | Kind | How it can limit blue crabs |
|---|---|---|
| Larger crabs | Biotic: predators | Adult blue crabs eat young crabs, so fewer young survive. |
| Clams and fish | Biotic: food | Less food can mean less energy for making eggs. |
| Other crabs | Biotic: competitors | In a crowd, more crabs need the same food and shelter. |
| Disease | Biotic | Sickness can spread faster through a crowded group. |
| Cold water | Abiotic: temperature | Very cold winters can kill crabs. |
| Fresh water | Abiotic: salinity | Low salt in cold water lowered crab survival in lab tests. |
Other species meet other limits. Land plants and animals depend on moisture, land animals take oxygen from the air, and the pH of soil helps decide which plants grow where.
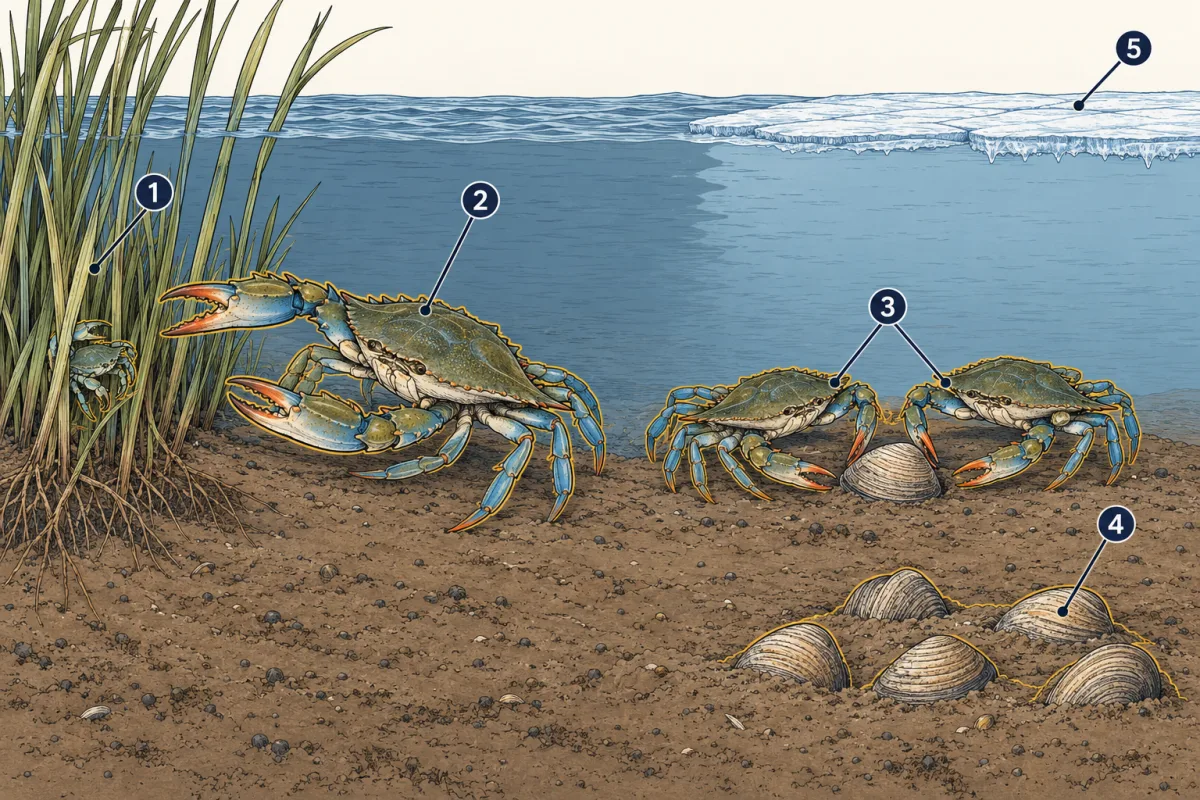
- hiding places
- predators
- competitors
- food
- cold water
- blank
- predators
- blank
- food
- blank
Word bank: cold water, competitors, hiding places
- blank
- blank
- blank
- blank
- blank
Check your labels
- hiding places
- predators
- competitors
- food
- cold water
Explain: J-shaped and S-shaped growth
The first film bent a J-shaped curve into an S. Here are the numbers and names behind it.
Suppose 10 bacteria land in a dish of fresh food, and each one splits in two every 30 minutes. After one step there are 20, then 40, 80, 160 and 320. The population increases by the same fraction each step, but the number added gets larger. This is exponential growth, and its graph makes a J shape. It can happen while a population is small and resources are plentiful, but it cannot last: food runs short and waste builds up.
Biology courses name five parts of a population growth curve. The first three make up the simplest S-shaped model, which levels off near the carrying capacity, the largest population the environment can support over time with its resources and challenges:
- Initial growth. A small population adds only a few individuals because few are present to have young.
- Exponential growth. Numbers rise faster while resources are plentiful.
- Steady state. Growth slows. The model line approaches carrying capacity, while real populations usually move up and down around it. Births and deaths are about equal if few individuals move in or out. This balance, kept by ongoing change, is a dynamic equilibrium.
The last two are possible outcomes if conditions get worse, not required stages:
- Decline. Deaths outnumber births and the population shrinks.
- Extinction. If the decline continues, the population falls to zero.
Many real populations stay near a steady state for a long time, and some briefly overshoot carrying capacity before falling back. When a population in one place reaches zero, it has undergone local extinction, which is different from extinction of a whole species.
Predict. Blue crabs vanish from one creek but remain elsewhere in the Bay. Is the species extinct?
Check your prediction
No. The creek population has undergone local extinction, but the species still lives in other populations.
Explain: which limits change with crowding
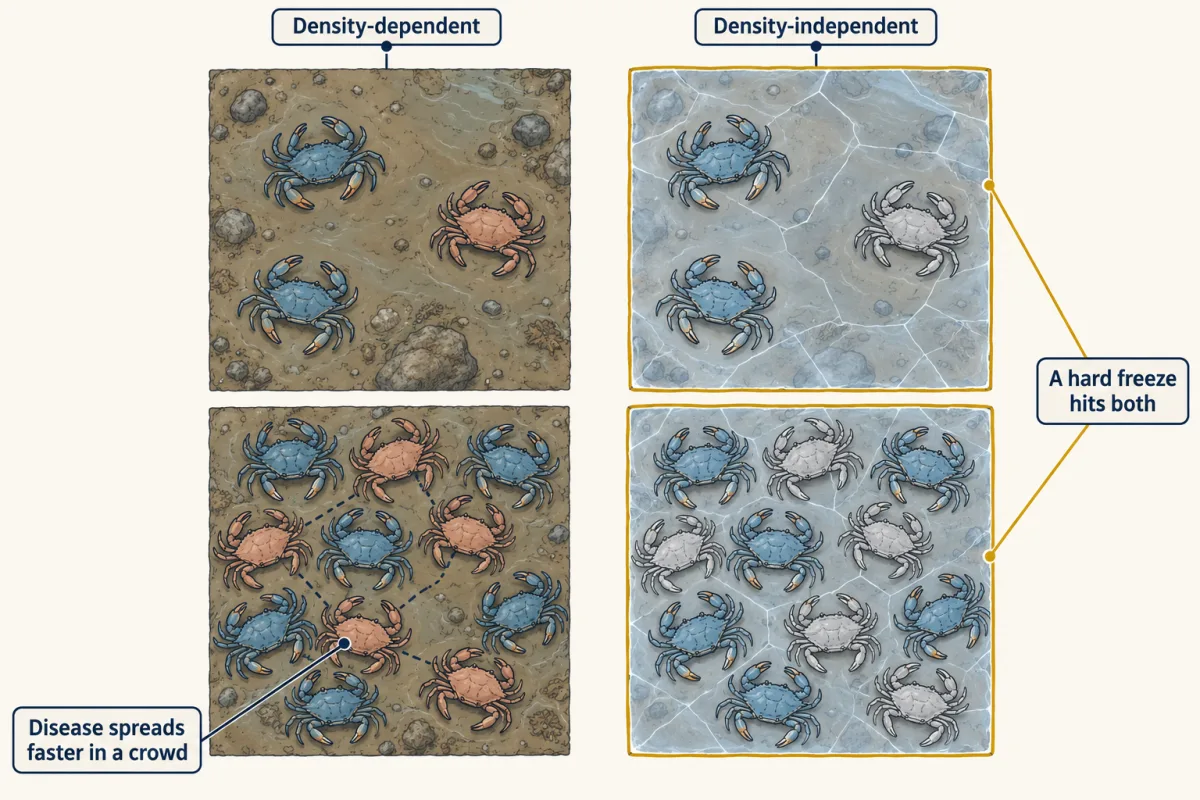
Some limits get stronger as a population becomes crowded. These are density-dependent factors, such as competition, disease and predators. Other limits hit a population whatever its size. These are density-independent factors.
Predict. A hard freeze kills the same share of crabs in a crowded creek and in a sparse one. Is the freeze density-dependent or density-independent?
Check your prediction
Density-independent. Its effect does not grow with crowding, and a storm is the same. Disease is different: it takes a bigger share of a crowded population.
Explain: carrying capacity can move
A freeze lowers a crab count whatever the crowding. Does it also lower how many crabs the Bay can support? That depends on what changes and for how long.
Hiding places matter for young crabs. In the Bay, adult crabs do nearly all the killing of young crabs, and in one tank test young crabs survived better among more stand-in grass stems (see Going deeper for both studies and their limits).
People can change carrying capacity and population size too. Crabbing removes crabs from the Bay each year, and shoreline building can remove marsh. The Chesapeake Under Pressure examines these pressures.
In every population, living things can produce more young than their environment can support, and the environment’s limits push back.
So a hard freeze and a lost marsh can both leave fewer crabs. Can the count alone tell them apart? The second film takes that up.
Read the transcript of “Did the Limit Move?”
Film transcript: Did the Limit Move?
The first film showed growth slowing near carrying capacity. But when a crab count falls, did the population move, did carrying capacity move, or both? Return to the same creek. This time, follow a pair of trackers: teal for population size and gold for carrying capacity.
Population size means how many individuals are present now. Carrying capacity means the largest population the environment can support over time. The trackers can move together, but they are not the same measurement. A low population can sit below either a high or low capacity. Begin with a brief cold event in this schematic creek. Some teal crabs disappear, so population size falls. Food, space, and shelter remain. Under that assumption, the gold support level stays put. The population may grow back toward it after the event passes. Now change the creek for the long term. Remove much of the green shelter and keep it gone. Young crabs have fewer hiding places, so in this model the environment supports fewer crabs over time.
The gold carrying-capacity tracker moves down, and population growth now slows near that lower level. Here is the prediction. Both windows now show the same low crab count. The left followed a brief event. The right lost shelter for the long term. Can the count alone tell you whether carrying capacity moved? Hold your answer.
No. The same abundance can come from different paths. To tell them apart, scientists need evidence about food, habitat, predators, weather, and survival across time. The count shows population size. It does not measure carrying capacity or identify which limiting factor caused a change. That matters for the winter dredge survey.
Crews sample buried crabs across the Bay and build a Bay-wide estimate. The estimate is not an exact count. It can show whether reported groups rose or fell. By itself, it cannot show why they changed. A lasting gain in food or shelter can raise environmental support. Lasting habitat loss can lower it. People can affect both trackers too. Harvest removes individuals, while shoreline building can remove marsh. Removing individuals does not automatically prove that the support level changed. Return to the paired trackers. A brief shock moved the teal population while gold support stayed. Lasting shelter loss moved the gold level too. Keep the distinction whenever a graph rises or falls.
Ask what changed, how long it lasted, and what evidence measured it.
From the film
- Lasting changes in resources or conditions can move carrying capacity.
- A brief freeze that leaves food, space and shelter unchanged lowers population size, not carrying capacity.
- A population count alone cannot reveal carrying capacity or identify a cause.
- The winter survey estimates crab abundance; it does not measure carrying capacity.
Elaborate: read the crab survey
The second film showed that a brief freeze that leaves food, space and shelter unchanged lowers population size, not carrying capacity. The survey gives only counts, so read it for which group changed, not why.
| Survey winter | Total crabs (millions) | Adult females (millions) | Juveniles (millions) |
|---|---|---|---|
| 2018–2019 | 594 | 191 | 324 |
| 2019–2020 | 405 | 141 | 185 |
| 2020–2021 | 282 | 158 | 86 |
| 2021–2022 | 227 | 97 | 101 |
| 2022–2023 | 323 | 152 | 116 |
| 2023–2024 | 317 | 133 | 138 |
| 2024–2025 | 238 | 108 | 103 |
| 2025–2026 | 349 | 81 | 228 |
Predict. For 2025–2026, do the adult females and juveniles add up to the total? What group is missing from the two smaller columns?
Check your prediction
No. Adult males are included in the total but do not have their own column here.
These are Bay-wide estimates from the Winter Dredge Survey. The Maryland Department of Natural Resources and the Virginia Institute of Marine Science run it each winter. The values are as published by Maryland DNR (series opened October 2026; the 2026 values also appear in the VIMS release of May 2026). They come from about 1,500 sites, not one station, and each is corrected for crabs the dredge missed.
- In which winter was the total lowest? In which was it highest?
- From 2024–2025 to 2025–2026, did the total and the adult females change in the same direction? By how much did each change?
- Find the mean total for the eight winters. Could that mean be the Bay’s carrying capacity? Explain why or why not.
Claim, evidence, reasoning
Use the survey table to explain which group contributed most to one change in the total, then state what the table cannot tell you about the cause.
Start with: From blank to blank, the total changed mostly because blank.
Start with: From blank to blank, juveniles changed from blank to blank million, while adult females changed from blank to blank million.
Start with: This supports my claim about the numerical change because blank. The table cannot tell us which limiting factor caused it because blank.
Compare with a model answer
In some years the total changes mostly because the number of juveniles changes a lot. From 2024–2025 to 2025–2026, juveniles rose from 103 to 228 million while adult females fell from 108 to 81 million, yet the total rose from 238 to 349 million. So young crabs drove that change. In other years adults mattered more: from 2020–2021 to 2021–2022, adult females fell from 158 to 97 million while juveniles rose a little, and the total fell. Limiting factors such as cold winters, salinity, predators and the amount of marsh cover can change how many young crabs survive. The table has limits: it shows estimates, not exact counts, it covers only eight winters, and it does not measure any cause directly. We would need temperature, habitat and predator data to test which factor mattered.
Saved in this browser only.
Design problem
You want to test whether salt in the water is a limiting factor for duckweed, a tiny floating plant that multiplies by budding. Plan a fair test that shows how salt affects the population’s growth and the level it reaches.
Predict. Why should the plan use several cups at each salt level and place the cups in random order under the lights?
Saved in this browser only.
Check your prediction
Repeated cups show whether a pattern is consistent instead of a chance result in one cup. Random order keeps one position under the lights from always going with one salt level.
One way to do it
- Question: How does the amount of salt in the water affect the growth of a duckweed population?
- Independent variable: salt added to each cup, for example 0, 1, 2 and 4 grams per liter.
- Dependent variable: the number of duckweed fronds (the tiny leaf-like parts), counted every two days for three weeks.
- Control: cups with no added salt.
- Constants: the same pond water and plant food, cup size, water volume, light, temperature and starting number of fronds (for example 10).
- Repeated trials: at least four cups for each salt level, placed in a random order under the lights.
- What results would mean: if the no-salt cups level off at the highest count and saltier cups grow more slowly, salt slows growth in these cups. If the saltier cups also level off lower, salt lowers the carrying capacity.
- Safety and ethics: wash your hands after handling pond water, and do not release the plants into a stream or pond afterwards.
Evaluate: check your thinking
The survey estimates abundance; it does not measure carrying capacity, so it cannot show whether carrying capacity changed. Cold, salinity, predators, food, hiding places and crabbing, which removes adult crabs every year, all change how many crabs are born and survive. In some winters, such as 2025–2026, most of the change came from young crabs; in others, adult females changed more.
Science practices you used: asking a question about a real pattern, using a model and naming its limits, reading a data table and finding a mean, planning a fair test with a control and repeated trials, and making a claim backed by evidence and reasoning.
Going deeper
Hiding places for young crabs
In a 2023 tank study, young blue crabs survived better when the tank held more wooden rods standing in for marsh grass stems, with adult crabs present as predators. The study was mainly a test of a method, and the authors said the result still needs testing with real plants. A 37-year field study in the Bay found that adult crabs did nearly all the killing of young crabs, and that shallow water near shore gave young crabs partial shelter.
Winter survival of crabs in the cold and fresh
In a 2021 laboratory study, scientists kept blue crabs at different winter water temperatures and salt levels. In the coldest, freshest condition tested (2 °C and a salinity of 5), only about 10% of the crabs were alive after 40 days. Warmer, saltier tanks had higher survival. At the same low salinity, crabs in water 2 °C warmer took about twice as long to fall to 10% survival. The 10% figure is one treatment’s survival after 40 days, not a carrying capacity for the whole Bay.
The longer decline in the Bay’s crabs
Scientists say the Bay’s crabs have declined since 2011, and a draft 2026 stock assessment found no clear cause.
Your notes
Select any text in the lesson to highlight it or add a note to it. Your highlights and notes are saved in this browser and collected in your notebook.
This browser is not letting the site save anything (a private window or strict privacy settings), so highlights and notes will be lost when you leave the page.
How we measure it
Winter dredge survey
In winter, when blue crabs bury in the mud and stay mostly still, boats tow a metal dredge along the bottom for a short time at randomly chosen sites across the Bay. The crabs caught at about 1,500 sites are measured and sorted into juveniles, adult males and adult females.
Abundance estimation
A dredge never catches every crab in its path, and some crabs die during the winter. Scientists correct the raw catches for both, then scale up from the sampled area to the whole Bay, which gives an estimate of the population rather than an exact count.
Controlled survival trials
Crabs are held in tanks where one factor, such as water temperature, salt level or the amount of hiding cover, is changed while the rest are kept the same. Counting survivors shows how strongly that one factor can limit survival.
Where this lesson fits
Before thisReview first
- Homeostasis in ActionThis course · Lesson 9
You need the idea of feedback holding a system steady to understand why a population levels off near carrying capacity.
After thisStudy next
- Energy in EcosystemsThis course · Lesson 30
Food supply is a main limit on carrying capacity, and this lesson shows how much energy reaches each level.
- The Chesapeake Under PressureThis course · Lesson 33
It applies the idea of lasting changes moving carrying capacity to real pressures on the Bay's crabs and fish.
- Succession in VirginiaThis course · Lesson 32
It shows how a lasting change in conditions reshapes which populations an area can support over time.
Elsewhere on the siteFilms, simulations and method films in other courses
- Run a crab cove for ten yearsSimulation · Life Science
You can run a model crab cove and see how additions and losses change a population over ten years.
- Four Ways a Population ChangesFilm · Life Science
It shows how births, deaths and movement raise or lower a population count.
Suggested by an AI model from the lessons themselves, then checked. How we use AI
Finish line
Test yourself
8 questions
Practice and MCAT-style, with explained answers.
Next · Lesson 30
Energy in Ecosystems
An osprey on the Chesapeake Bay eats fish, and the fish eat plankton, so how much of the sunlight the plankton caught ever reaches the osprey?
Continue →