Ecology and Evolution · Unit 2: Genomes, development and diversification
Human Evolutionary History: An African Origin and Archaic Ancestry
Rewritten on : new text, flashcards and film. Your notes and highlights stay, but the text around them may have moved.
If our species began in Africa, why do living people whose ancestors lived outside Africa carry a little Neanderthal DNA, and how can a genome tell when it got there?
Pause when the reading reaches a film, and offer to play it. Saved on this device.
Watch the film now, or keep listening
Builds on:Reading Phylogenetic TreesDrift, Gene Flow and Competing ExplanationsMolecular EvolutionWhy these?
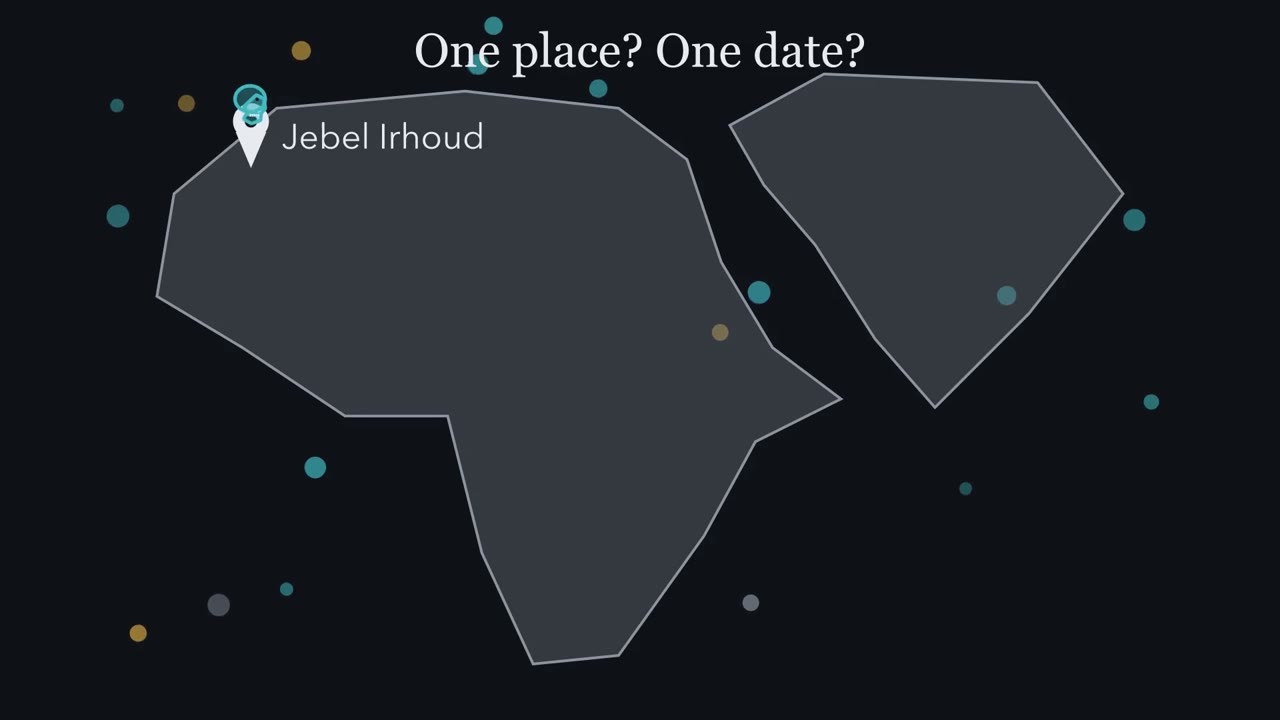 ▶ Watch What Was Dated? · 2:58
Read the transcript of “What Was Dated?”
Film transcript: What Was Dated?
Did our species begin in one place, on one date? A skull from Jebel Irhoud, in Morocco, seems to answer yes. It comes with a date that looks precise. It has a face you could pass in the street. Its braincase is more elongated than yours. It is a mosaic of modern and older features. Now ask the question that runs through this whole lesson. What was actually dated? Not the skull itself.
Flints lay beside the bones, and a fire had heated them. Enough heat resets the flint's signal. Afterward, radiation from the flint and its surroundings builds it back. The stored dose, divided by the yearly dose, gives the time since heating. So this date belongs to something beside the bones, not to the bones themselves.
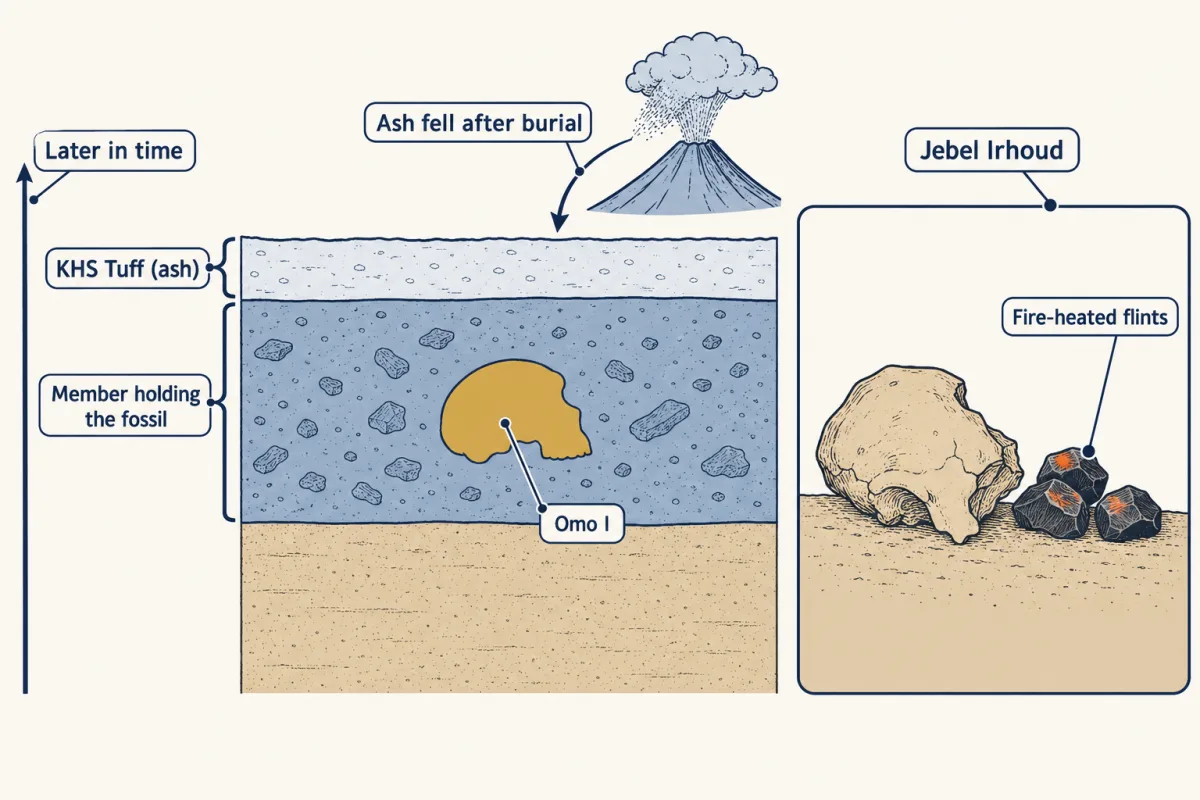
Every date in this story needs that same check. Travel east to Omo, in Ethiopia. Here a fossil lies in one layer, and a band of volcanic ash lies above it. The eruption that laid the ash has been dated too. The ash lies above the bone, and the date belongs to the ash. So is the bone older or younger than that date?
At least as old. The ash fell after the bone was buried. So its date is a minimum. Omo I is at least about that old, not dated directly. Now cross into western Asia. At Misliya Cave, in Israel, a jaw with teeth from our lineage turned up. It was dated far earlier than the dispersal many textbooks taught. Part of that dating has been challenged. Does that mean living people outside Africa descend from them? Not by itself. A fossil shows presence, not ancestry.
Genomes of living non-Africans point mainly to a later dispersal. So the dates do not mark one birthplace. People with partly modern anatomy lived in north Africa very early. They lived in east Africa by at least the Omo date. Genomes of living people agree that most of our ancestry traces to Africa. But the history is not one tree with one root. It is connected populations that split, and sometimes merged again. So whenever you meet a date in this story, ask two plain questions before you believe it. What was dated? And where did it lie?
From the film
- Homo sapiens arose in Africa from connected populations that split and sometimes merged, not at one birthplace on one date.
- A fossil's date usually belongs to something beside or above it, so ask what was dated and where it lay.
- An ash layer above a fossil gives a minimum age: Omo I is at least about 233,000 years old.
- People with partly modern anatomy lived in north Africa around 300,000 years ago.
- A fossil outside Africa, like Misliya's, shows presence there, not that living people descend from that group.
People whose ancestors lived outside Africa carry a little DNA from Neanderthals, an extinct human population of Europe and western Asia, yet our species arose in Africa. When did it get in? A fossil cannot say, and a genome carries no date stamp.
The one idea. Ask what each piece of evidence dates, and by which clock. An ash above a bone gives only a minimum age. A surplus of variants shared with Neanderthals is a clue to mixing, not proof and not a date. Segment length tests the clue and dates it: recombination breaks inherited Neanderthal DNA into shorter pieces, so long pieces mean recent mixing.
Scope, for the whole lesson: the clock gives an average for one main period of mixing, in the genomes sampled. It says when, not where, how often or how much ancestry came across: longer segments do not mean more Neanderthal ancestry.
An African origin, without one birthplace or birthday
The first film tied each date to what was dated and where it lay. Here are the rival model and the genetic evidence that decided between them.
Until the early 1990s many researchers favored a different model, multiregional evolution, in which populations in several regions evolved into Homo sapiens from older local groups while staying linked by gene flow. Genomes of living and ancient people now strongly support the African origin instead: living people trace most of their ancestry to African populations. What has changed is the picture of how, the first film’s braid of connected populations rather than one founding group (see reading phylogenetic trees).
Ancient DNA is genetic sequence recovered from bones tens of thousands of years old; it lets you compare an extinct population with living people site by site (sequencing itself belongs to sequencing and genomes). Present-day genomes record history in the pattern of shared and unshared variants, the sites where genomes differ: in a large worldwide sample, individuals from African-ancestry populations carried the greatest numbers of variant sites.
What the first film’s dates leave out
The Jebel Irhoud mosaic. Face, mandible and teeth align with early or recent anatomically modern humans, while the neurocranium (the braincase) and endocranial shape are more primitive (Hublin and colleagues, 2017). “Modern” anatomy did not arrive as one package; brain expansion is taught in human brain expansion.
How firm each date is. The flint and ash dates (Richter and colleagues, 2017; Vidal and colleagues, 2022) rest on methods whose assumptions Going deeper sets out. The Misliya date (Hershkovitz and colleagues, 2018) is partly contested: its uranium-series part was challenged the same year, and the authors replied that their other methods still give about 185,000 years.
Fossils show where people lived, not who had children with whom. That needs DNA, and a clock of its own.
Read the transcript of “A Clock Made of Cuts”
Film transcript: A Clock Made of Cuts
Fossils show where people lived, not who had children together. That needs DNA. If you carry Neanderthal DNA, when did it get there? Start with a clue. A draft Neanderthal genome was compared with genomes of living people. It shared more variants, sites where genomes differ, with sampled Eurasians than with sampled sub-Saharan Africans. The team read this as suggesting interbreeding after some people left Africa. But a clue is not proof, and it gives no date. An old African population, split into partly separate groups, could produce some of it. So look along a chromosome instead.
Picture one teal chromosome in a modern human. It carries one long orange block, inherited from a Neanderthal ancestor. At first the block is long and unbroken. Each time eggs and sperm are made, paired chromosomes swap pieces. This is recombination. A swap inside the orange block can split it, in the copy passed to a child. Generation after generation, the swaps pile up. Some descendants keep the orange block whole. Some keep a shorter piece, and some lose it. Across many descendants, the orange pieces that survive get shorter on average. That makes length a clock. Long orange segments mean the mixing happened recently.
Short flecks mean it happened long ago. Today, after far more generations, the Neanderthal pieces in living non-Africans are short. The cutting has run a long time. Now meet Ust'-Ishim, a man who lived in western Siberia long before us. Will his orange segments be longer or shorter than yours?
Longer. Fewer generations of cutting had passed since the mixing. From their lengths, Fu and colleagues worked out how long before his life the gene flow came. At Bacho Kiro Cave in Bulgaria, three early Homo sapiens were sampled. Each had a Neanderthal ancestor only a few generations back. That was a separate, recent contact in their own family trees. Their orange runs are the longest of all. Line the three up. Bacho Kiro, long runs. Ust'-Ishim, medium pieces. A living person, short flecks. The surplus was a clue. The lengths test it, and say when. One caution travels with this clock. It gives an average, for one main period of mixing. And it says when, not how much ancestry came across.
From the film
- Sampled Eurasian genomes share more Neanderthal variants than sampled sub-Saharan African genomes do: a clue to mixing, not proof.
- The surplus gives no date, and old population structure could produce some of it.
- Recombination breaks inherited Neanderthal DNA into shorter pieces, so long pieces mean recent mixing: segment length is the clock.
- Ust'-Ishim, who lived about 45,000 years ago, carried longer Neanderthal segments than people today: the mixing came 7,000-13,000 years before he lived.
- At Bacho Kiro, three early Homo sapiens each had a separate, recent Neanderthal ancestor only a few generations back.
Counting the clue: the D statistic
The second film showed the clue as two unequal stacks. The count behind them, the D statistic, produced the surplus Green and colleagues reported in 2010, and it is easy to misread.
Picture four genomes on a tree: a sampled African, a sampled Eurasian (a person with ancestry in Europe or Asia), a Neanderthal, and a chimpanzee as outgroup (a lineage outside the group, used to tell which allele is ancestral). In the population tree the African and the Eurasian are each other’s closest relatives. At each site, call the chimpanzee’s allele A (ancestral) and the other B (derived, a newer variant). Look only at sites where the Neanderthal carries B, and ask which modern genome shares it.
| Pattern | Who shares the new variant with the Neanderthal | Alleles: African, Eurasian, Neanderthal, chimpanzee |
|---|---|---|
| ABBA | the Eurasian | A, B, B, A |
| BABA | the African | B, A, B, A |
Both patterns disagree with the population tree, and both can arise with no gene flow at all, through incomplete lineage sorting. For example, a variant born in the population ancestral to all three can, by chance, survive in the African and Neanderthal lines and be lost in the Eurasian line: a BABA site with no interbreeding. (See molecular evolution.)
Predict. Suppose there was no gene flow after the populations split, and their common ancestor was one randomly mating population. Which count should be larger, ABBA or BABA?
Check your prediction
Neither. Chance favours neither modern genome, so incomplete lineage sorting makes ABBA and BABA equally likely, and the counts should come out even apart from noise.
D = (NABBA - NBABA) / (NABBA + NBABA)
Worked problem. These counts are hypothetical. At sites where the Neanderthal carries B, you count ABBA = 600 and BABA = 400.
- Compute D. D = (600 - 400) / (600 + 400) = 200 / 1,000 = 0.20. D has no units; it runs from -1 to +1.
- State the null. The no-gene-flow model above predicts D = 0. Here the Eurasian genome shares derived alleles with the Neanderthal more often than the African genome does.
- Test it. Neighbouring sites are inherited together, so sites are not independent. A block jackknife drops one large genomic block at a time and recomputes D to get a standard error. If that gives 0.05, then Z = 0.20 / 0.05 = 4; Z is how many standard errors D sits from zero. Studies of this kind commonly treat |Z| greater than 3 as significant, so the asymmetry is unlikely to be chance.
- Do not read D as a percentage. D = 0.20 does not mean 20% Neanderthal ancestry. An ancestry fraction needs a separate estimator.
- Ask what else could cause it. Old population structure could also produce one (Durand and colleagues, 2011): if the ancestors of Eurasians came from a part of an old, subdivided African population that was closer to the Neanderthal lineage, ABBA would exceed BABA with no interbreeding. And D says nothing about when. Segment length tests both.
- D = (ABBA − BABA) / (ABBA + BABA)
- 0.20
- Z = D / SE
- 4.0
- |Z| greater than 3?
- yes
In this sketch: the counts are hypothetical, and the standard error is set by hand instead of being computed by dropping genomic blocks. P1 is a sampled African genome, P2 a sampled Eurasian genome, P3 a Neanderthal, with a chimpanzee as outgroup.
Rule to keep: D is not percent ancestry, and ancestral structure can also give D above 0.
The algebra of gene flow belongs to population genetics; the competing-explanations logic is in drift, gene flow and competing explanations.
Segment length as a clock
The second film showed the pieces shrinking. The rule: after one pulse of mixing with no later gene flow, segments average about 1/t Morgans after t generations (the decay dating studies use; Sankararaman and colleagues, 2012). A Morgan is the stretch of chromosome that averages one crossover per generation; a centimorgan (cM) is a hundredth of it, so the average is about 100/t cM. Crossovers are commoner in some regions than others, so a centimorgan is no fixed number of bases and dating uses a recombination map.
| Genome | Which mixing | Generations back (model-based) | Average segment, 100/t cM |
|---|---|---|---|
| Bacho Kiro, Bulgaria, ~45,000 years ago | a recent Neanderthal ancestor in each individual’s own family tree | about 7 or fewer | over 10 cM (longest found: 17-54 cM) |
| Ust’-Ishim, western Siberia, ~45,000 years ago | Fu and colleagues’ fit of one pulse to his segments | 232-430 in that fit | about 0.2-0.4 cM under that fit |
| A present-day non-African | the main mixing shared by living non-Africans | about 1,500-2,000 | about 0.05-0.07 cM |
The rows are not one pulse seen three times. Bacho Kiro’s long segments come from a separate, recent contact, beside older, shorter pieces (Hajdinjak and colleagues, 2021). Ust’-Ishim’s row is a single-pulse fit; whether his mixing is exactly the one living people carry is not settled. The present-day range spans the two dating windows in Going deeper, at the 29 years a generation Fu and colleagues used.
Predict. The second film showed that Ust’-Ishim’s pieces are longer than yours. Now take the D section’s rival: no interbreeding, and the Neanderthal-like pieces came from a structured African population that split from the Neanderthal line hundreds of thousands of years ago. Would a 45,000-year-old genome still carry clearly longer pieces than yours?
Check your prediction
Barely. Under structure the shared pieces are as old as that split, so against hundreds of thousands of years, living 45,000 years earlier makes them only about a tenth to a fifth longer. Fu and colleagues (2014) found Ust’-Ishim’s segments roughly two to four times longer than present-day ones on average, and inferred gene flow 7,000-13,000 years before he lived; Going deeper gives the dating uncertainty.
Reviews treat segments longer in dated ancient genomes than old structure predicts as the strongest sign of recent interbreeding; Going deeper gives the other tests and why detection bias keeps the question debated.
Denisovans, and a child of two groups
Denisovans are a population known mostly from DNA: a finger-bone genome from Denisova Cave in Siberia placed them as sharing a common origin with Neanderthals (Reich and colleagues, 2010). Denisovan ancestry survives in living people too, most clearly in the sampled present-day Melanesians (Going deeper gives the estimate).
Denisova 11, a bone fragment from the same cave, had Neanderthal-type mitochondrial DNA and a nuclear genome with Neanderthal and Denisovan ancestry in roughly equal measure.
Predict. Roughly equal ancestry could mean a child of one Neanderthal and one Denisovan parent, or a member of a population mixed for many generations. What could you check in the DNA to tell them apart, and to tell which parent was which?
Check your prediction
Look at sites where the Neanderthal and Denisovan genomes differ. A first-generation offspring has had no generations in which the two lineages’ DNA could be cut together: one chromosome of each pair came from each parent, so DNA fragments overlapping such a site should carry one allele of each kind, across the genome. A member of a long-mixed population would not be expected to do so consistently. Denisova 11’s fragments did (Slon and colleagues, 2018). Mitochondrial DNA comes from the mother, so the mother was Neanderthal and the father Denisovan; he himself carried some Neanderthal ancestry.
Denisova 11 shows two archaic groups interbreeding; evidence that modern humans interbred with them comes from the Homo sapiens genomes above.
What the inherited DNA did: adaptive introgression
Archaic variants then met selection in their new genomic background. At EPAS1, which encodes a transcription factor involved in the response to low oxygen, the haplotype structure in Tibetans compared with Han Chinese (a haplotype is a combination of alleles carried together along one chromosome region, often inherited together) supported introgression from Denisovans or a Denisovan-related population (Huerta-Sánchez and colleagues, 2014). The authors concluded that admixture supplied variation that helped humans adapt to new environments, with Tibetans at high altitude as the case studied. This is adaptive introgression: an allele that entered by interbreeding and then rose in frequency because carriers did better in that environment. Reviews describe a wider follow-up literature, including evidence that interbreeding with Neanderthals or Denisovans influenced present-day immune responses, particularly to viruses.
One species: why genetic clustering does not make races
All people alive today belong to Homo sapiens. Here too, ask what was measured. With enough loci, individuals can be assigned to the populations they were sampled from, yet the share of variation between populations is modest, two people from different populations can be more alike than two from the same one, and most common variants are shared worldwide (Witherspoon and colleagues, 2007; 1000 Genomes, 2015). Assignment reflects the groups and categories a study chose to sample. The American Association of Physical (now Biological) Anthropologists’ 2019 statement holds that socially recognized races are not discrete biological groups or evolutionarily independent lineages. No ranking of populations follows from any of this evidence.
What remains open
Where in Africa did Homo sapiens arise, and was it one region at all? Ragsdale and colleagues (2023) found that weakly structured stem populations connected by gene flow over hundreds of thousands of years can explain patterns that had been attributed to an unsampled archaic population in Africa. Whether such an archaic contribution happened is open, as is how many contacts with Neanderthals and Denisovans there were, and where. The Denisovan skeleton is barely known, although proteins and mitochondrial DNA from dental calculus, both reported in 2025, suggested that the Harbin cranium from China belonged to a Denisovan population. African genomes are not free of Neanderthal ancestry either; Going deeper explains why.
Design problem
A new genome is recovered from a Homo sapiens individual who lived in Europe at about the same time as the Bacho Kiro individuals. Did this person have a Neanderthal ancestor, and roughly how many generations back? Name the comparisons you would make and what each possible answer would look like.
Saved in this browser only.
One way to do it
Start by finding archaic segments: compare the genome with sequenced Neanderthal genomes and with present-day genomes, and mark stretches that match the Neanderthal closely.
Then measure segment length against the table: longer than present-day segments, as in Ust’-Ishim, means gene flow closer to this individual; very long ones, as at Bacho Kiro, mean a Neanderthal ancestor only a few generations back.
Next, ask whether the person was a first-generation offspring. Use the Denisova 11 logic: at sites where Neanderthal and modern human genomes differ, a child of one Neanderthal parent and one modern parent would carry one allele of each kind across the genome.
Keep the conclusion to that individual: how many contacts there were, and where, needs many genomes.
Going deeper
Dating Jebel Irhoud and Omo I
Thermoluminescence divides the dose a heated flint has stored by its yearly dose, from its own radioactivity, the sediment and cosmic rays, corrected for factors such as past water content; it assumes the fire fully reset the signal. At Omo I, Vidal and colleagues (2022) matched the KHS Tuff chemically to a major eruption of the Shala volcano and dated sanidine crystals from its pumice by single-crystal 40Ar/39Ar, giving 233 +/- 22 thousand years at two standard deviations. The minimum-age logic does not depend on the uncertainty: the ash still lies above the fossil.
The multiregional model, fairly stated
As its proponents framed it, regional populations became Homo sapiens together, not in isolation. The archaic admixture now known shows that some gene flow from other human groups did happen, though most living ancestry still traces to Africa.
Timing the Neanderthal gene flow
Adding the Ust’-Ishim man’s age of about 45,000 years to the 7,000-13,000-year interval puts that gene flow roughly 52,000-58,000 years ago, inheriting the uncertainty of both numbers and of the recombination model. Using more than 300 ancient and present-day genomes, Iasi and colleagues (2024) attributed most Neanderthal gene flow in their sample to a shared, extended period about 50,500-43,500 years ago. That window sits later than the one from Ust’-Ishim alone; the two estimates rest on different samples and models, so they need not date one identical pulse; treat each as model-based. The simple 1/t rule also ignores selection, later gene flow and errors in the recombination map.
Telling gene flow from old structure: divergence and model fitting
Beside segment length in dated genomes, a second test is divergence. A segment that entered from Neanderthals recently should be close to the sequenced Neanderthal genomes, differing only by the split between the Neanderthals who interbred and those who were sequenced. Under old structure, shared segments should be as divergent from the Neanderthal as the deep split between the lineages implies.
Third, fit both histories as explicit models to the same data and compare how well each reproduces segment lengths, divergences and D. Reviews note that short, old segments are harder to detect, so how much of the signal ancestral structure might explain is still debated. The evidence supports Neanderthal gene flow into the ancestors of the sampled non-Africans and, by itself, says nothing about other contacts.
Archaic ancestry beyond the main line
Reviews describe admixture as a defining feature of human evolutionary history. Reich and colleagues (2010) inferred a 4-6% Denisovan contribution to the genomes of their sampled present-day Melanesians; later estimates vary with population and method, and all are inferred.
Using IBDmix, which finds introgressed sequence without assuming any modern population is unadmixed, Chen and colleagues (2020) detected a stronger signal in sampled Africans than had been recognized, explained partly by migration back into Africa and by earlier gene flow from modern humans into Neanderthals.
Study details
The worldwide variation figures come from the 1000 Genomes Project’s Phase 3 sample of 2,504 people from 26 populations. Green and colleagues’ 2010 draft Neanderthal genome combined sequence from three Neanderthal individuals and compared it with five present-day human genomes. The EPAS1 study compared haplotype structure in 40 Tibetans with 40 Han Chinese. The Ragsdale and colleagues (2023) models were fitted to genomes that included 44 newly sequenced Nama individuals. Hajdinjak and colleagues (2021) describe the Bacho Kiro individuals as Initial Upper Palaeolithic.
Next, life histories turns from ancestry to the trade-offs that shape how organisms grow and reproduce.
Your notes
Select any text in the lesson to highlight it or add a note to it. Your highlights and notes are saved in this browser and collected in your notebook.
This browser is not letting the site save anything (a private window or strict privacy settings), so highlights and notes will be lost when you leave the page.
How we measure it
Radiometric and luminescence dating
Thermoluminescence dates when flints were last heated, as at Jebel Irhoud; single-crystal 40Ar/39Ar dates volcanic sanidine, as for the eruption behind the ash above Omo I. Both date a material associated with a fossil, so you must ask whether the date sits with, above or below the bone.
Ancient-DNA sequencing and authentication
Short, damaged molecules are sequenced from bone. Miscoding cytosine changes concentrated at molecule ends mark old DNA, but damage alone does not prove a sequence is authentic; it is paired with contamination estimates.
D statistic (ABBA-BABA test)
Count sites where a derived allele is shared by an archaic genome and one or the other of two modern genomes. Under a no-gene-flow model with an unstructured ancestor the two counts are expected to be equal, and a block jackknife across the genome gives the uncertainty.
Archaic segment-length analysis
Recombination breaks introgressed segments into shorter pieces over the generations, so the length of archaic segments in a dated ancient genome constrains how long before that individual the gene flow happened.
Practice questions on this lesson (3) → MCAT-style, original, each with an explanation
Where this lesson fits
Before thisReview first
- Reading Phylogenetic TreesThis course · Lesson 2
You need to read a tree with an outgroup to follow the four-genome ABBA and BABA comparison here.
- Drift, Gene Flow and Competing ExplanationsThis course · Lesson 4
You need to weigh gene flow against other explanations to see why a positive D is only a clue.
- Molecular EvolutionThis course · Lesson 5
You need shared derived variants and lineage sorting from there to understand ABBA and BABA sites.
After thisStudy next
- Demography and SurvivorshipThis course · Lesson 13
Reading ancestry from data on who lived and had offspring leads into tracking cohort survival and reproduction by age.
Elsewhere on the siteFilms, simulations and method films in other courses
- Meiosis shufflerSimulation · Biology
Seeing how recombination shuffles chromosomes shows why inherited segments get shorter each generation, making length a clock.
- Rock layers and DNASimulation · Biology
Rock layers and dating show how a fossil's age depends on what was dated and where it lay.
Suggested by an AI model from the lessons themselves, then checked. How we use AI
Finish line
Test yourself
8 questions
Practice and MCAT-style, with explained answers.
Next · Lesson 10
Life Histories and Evolutionary Trade-offs
If breeding can cost a bird its future, why do birds that lay more eggs often survive better from one year to the next?
Continue →← Lesson 8 · History of Life: Transitions, Extinctions and Radiations