Developmental Neuroscience · Unit 3: Coordinates: patterning the tube
Mapping the Cortex: Areas and Arealization
Rewritten on : new text, flashcards and film. Your notes and highlights stay, but the text around them may have moved.
Add one secreted protein to the back of a mouse embryo's cortex and a second, partial whisker map can appear there.
Pause when the reading reaches a film, and offer to play it. Saved on this device.
Watch the film now, or keep listening
Builds on:Ventral to Dorsal: Sonic Hedgehog and BMP in the Neural TubeLocal Organizers: The Midbrain-Hindbrain BoundaryTranscription Factor Codes: Building a Motor NeuronWhy these?
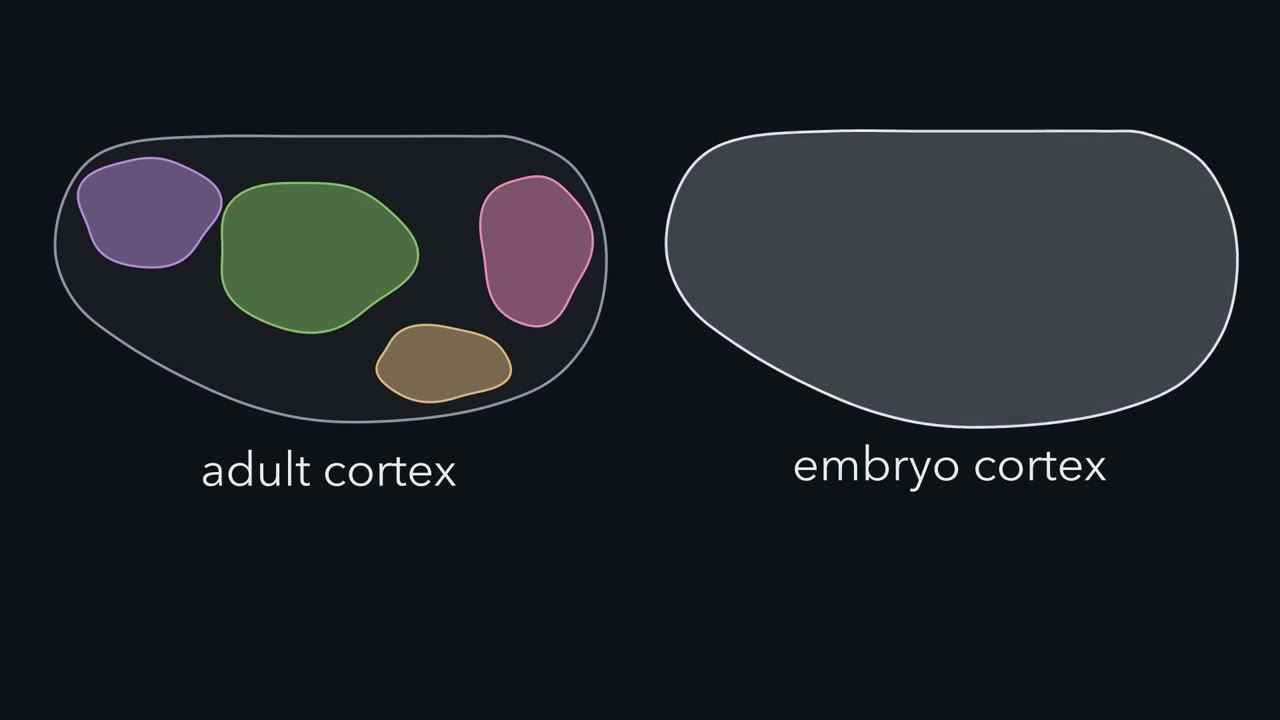 ▶ Watch A Sheet with No Borders · 3:02
Read the transcript of “A Sheet with No Borders”
Film transcript: A Sheet with No Borders
The adult cortex is divided into areas. The embryo's cortex shows no borders at all. So where do the areas come from? The cortex is the sheet of neurons on the surface of the forebrain. In 1909, Korbinian Brodmann divided the human cortex into areas by how its cells were packed and layered. Many of his borders match borders of function. His area 17 is primary visual cortex, the first cortical stop for signals from the eyes. This lesson works in the mouse. Here is the map we will use throughout. Front to back runs from the nose end to the back of the head. The medial edge runs along the midline. The lateral edge is the outer side. Motor cortex sits at the front.
Somatosensory cortex, the touch area, sits in the middle. Inside it lies the barrel field, the whisker map. Auditory cortex sits on the lateral side, toward the back. Visual cortex sits at the back. We will call motor and somatosensory the front-and-middle areas. Visual is the back area. The cortex grows from a smooth sheet of progenitors, cells that divide to make neurons. The sheet that will hold the whisker map and the visual map looks the same from front to back. Making the areas from it is called arealization. Signalling centres at the edges of the sheet are active by about embryonic day 9.5. They keep signalling as the first neurons are made.
Progenitors make the cortex's neurons from about embryonic day 11 to 17. The thalamus is the relay station for signals from the eyes, ears and skin. Which comes first: the neurons of the cortex, or the thalamic axons that reach them?
The first neurons are born first. Thalamic axons reach the developing cortex around embryonic day 14 to 15, and wait in the layer just under it. More neurons are still being made then. The axons grow into the cortex itself later, around birth. Barrels can be seen in the first postnatal week, around postnatal day 4. So the sheet is already patterned and making neurons before the thalamic axons arrive. Where do the borders come from, in a sheet that shows none? What tells a progenitor where it sits, and can that be changed so a border moves? And what does input from the thalamus add, if the sheet has already been marked? The takeaway: the areas are real, and the embryonic sheet shows no borders for them.
The next chapters ask what draws them, and when.
From the film
- The adult cortex has areas, but the embryonic sheet shows no borders for them.
- In the mouse, the sheet is already patterned and making neurons before thalamic axons arrive.
- Thalamic axons reach the developing mouse cortex around embryonic day 14 to 15, while neurons are still being made.
In the adult mouse, a patch of cortex near the middle of each hemisphere maps the whiskers and a patch near the back maps what the eyes see. In the embryo, the sheet that will hold both looks the same from front to back.
The cerebral cortex is the sheet of neurons on the surface of the forebrain. In 1909 Korbinian Brodmann divided the human cortex into numbered areas by how its cells were packed and layered, and many of his borders match borders of function: his area 17 is primary visual cortex, the first cortical stop for signals from the eyes. Each area has its own inputs and outputs, and many sensory areas hold an internal map of the body or the world. Yet the cortex grows from a smooth sheet of progenitors, cells that divide to make neurons, with no clear borders. Where do the areas come from? The process is called arealization.
The layout
Most arguments in this lesson happen on one map, which the first film draws. Picture one hemisphere of a mouse brain seen from above.
- Two axes. Front to back runs from the nose end to the back of the head. Medial is the edge along the midline, where the two hemispheres meet; lateral is the outer edge.
- Motor cortex sits at the front.
- Somatosensory cortex, the touch area, sits in the middle. Inside it lies the barrel field, the whisker map.
- Auditory cortex sits on the lateral side, toward the back.
- Visual cortex sits at the back.
In this lesson, “the front-and-middle areas” means motor and somatosensory cortex, and “the back area” means visual cortex.
When things happen (mouse, roughly):
- Signalling centres at the edges of the sheet are active by about embryonic day 9.5 (E9.5) and keep signalling as the first neurons are made.
- Progenitors make the cortex’s neurons from about E11 to E17.
- Axons from the thalamus, the relay station that passes signals from the eyes, ears and skin to the cortex, reach the developing cortex around E14 to E15 and wait in the subplate, a layer just beneath it, while neurons are still being made. They grow into the cortical plate itself later, around birth.
- Barrels can be seen in the first postnatal week, around postnatal day 4.
So the sheet is already patterned and making neurons before the thalamic axons arrive.
The map raises three puzzles.
- Where do the borders come from, in a sheet that shows none?
- What tells a progenitor where it sits, and can it be changed so that a border moves?
- What does input from the thalamus add, if the sheet has already been marked?
The one idea to carry through this lesson. Position draws the sketch; input finishes it. Each progenitor’s position is recorded as levels of graded signals (FGF8 from the front) and of transcription factors, proteins that switch genes on or off (such as Emx2 and COUP-TFI). In this lesson’s working model, a border falls where a level crosses a threshold, so a second source of the signal can repeat part of the pattern; real borders come from several interacting signals and factors. Thalamic input then sharpens the sketch, tells primary areas from higher-order ones, and helps shape the maps inside each area.
The strongest evidence for a factor. If losing a factor and adding more of it move borders in opposite directions, the factor is helping to allocate territory. A missing converse result does not rule a factor out, since redundancy or buffering can hide it.
What the rule covers. Where the primary-area borders sit front to back in the mouse cortex, as read from marker genes and thalamic connections at birth and from the barrel field in the first postnatal week. Its limits come at the end.
Two answers, and what each predicts
Read the transcript of “Two Answers, a Year Apart”
Film transcript: Two Answers, a Year Apart
Is the map already in the dividing cells, or is it brought in by the axons that arrive? Two answers were proposed a year apart. In 1988, Pasko Rakic proposed the protomap. Cortical progenitors lie in the ventricular zone, the layer of the brain wall next to the fluid-filled ventricle. Newborn neurons climb outward along radial glia, long scaffold cells that span the wall. So neurons born from one patch stack up in a column above it. If the patches already differ by position, the outline of the areas is laid down where the cells are made. Think of a city zoned into districts before a single house is built. In 1989, Dennis O'Leary proposed the protocortex.
Here the young sheet has broadly similar potential everywhere. Areas emerge mainly from the axons that arrive from the thalamus. Different thalamic nuclei send axons to different parts of the sheet. The input tells each part what to become. Suppose you found molecular differences across the progenitors, and a map that forms without thalamic input. Which idea would that support?
The protomap. That is what it predicts. The protocortex predicts something else. Young cortex given new input should take on features that match the input. Both predictions came true in part. So the field now treats the map as drawn twice. First a sketch from the sheet, then a copy refined by its inputs. One more thing before any result: how do you read a map in a newborn mouse? Mice lacking Emx2, and mice lacking working Pax6, die around birth, before the areas mature. So an area in these experiments means a proxy. First proxy: marker genes. A stain shows where a gene is switched on in a tissue section. Some genes have borders at birth that line up with future areas.
Second proxy: connections. A thalamic nucleus is a cluster of neurons. Each one projects mainly to its own part of cortex. Dye placed in one spot of cortex labels the thalamic neurons that project there, sometimes in more than one nucleus. Third proxy: the barrel field. In mice that survive past birth, a stain on flattened cortex shows the barrels as dark patches. In mice that die at birth, these proxies stand in for mature areas. Animals that survive allow later and adult measures too. The takeaway: the two ideas make different predictions, and early proxies are one way to test them.
From the film
- The protomap proposes that the outline of the areas is laid down in the progenitors; the protocortex proposes that it comes mainly from arriving thalamic axons.
- Both predictions came true in part: the map is drawn twice, sketched by the sheet and refined by its inputs.
- In newborn mice, areas are read through proxies such as marker genes, thalamic connections and the barrel field.
Two answers were proposed a year apart. In 1988 Pasko Rakic proposed the protomap. Cortical progenitors lie in the ventricular zone, the layer of the brain wall next to the fluid-filled ventricle, and newborn neurons climb outward along radial glia, long scaffold cells that span the wall. Neurons born from one patch of the ventricular zone therefore stack up in a column above it. If the patches already differ by position, the outline of the areas is laid down where the cells are made, like a city zoned into districts before a single house is built.
In 1989 Dennis O’Leary proposed the protocortex. Here the young cortex is a sheet with broadly similar potential, and areas emerge mainly from the axons that arrive from the thalamus. Different thalamic nuclei send axons to different parts of the sheet, and the input tells each part what to become.
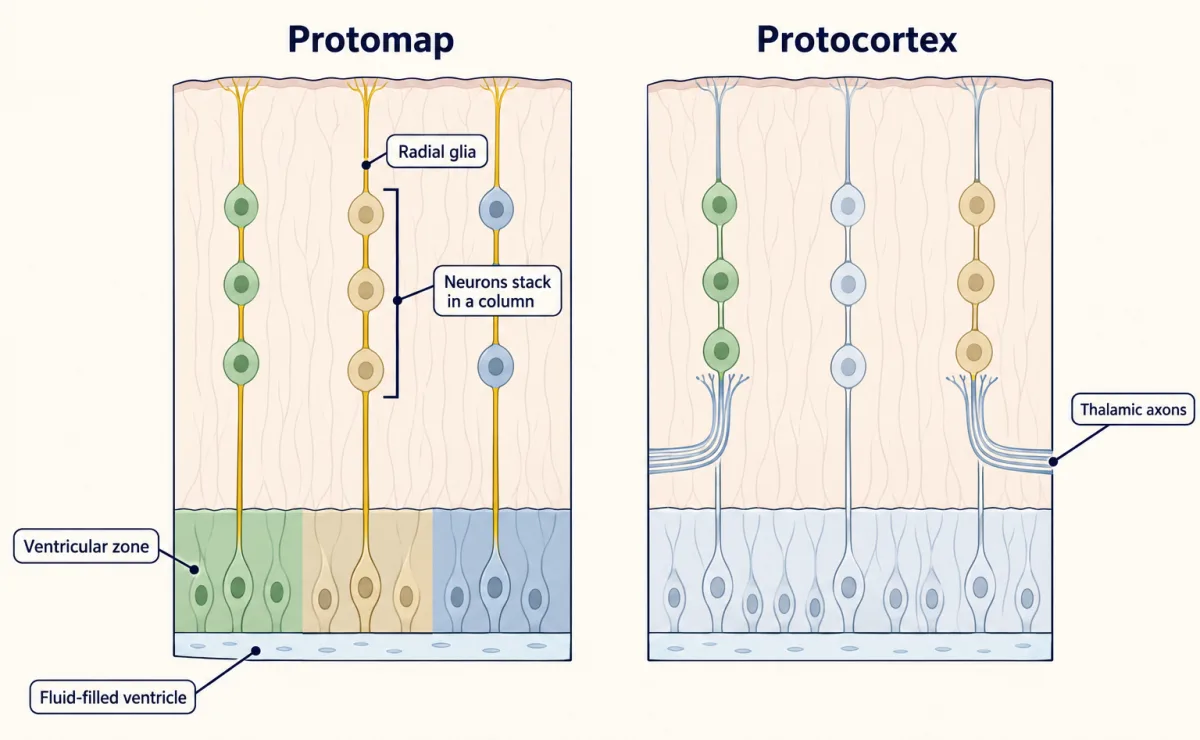
| Protomap (Rakic, 1988) | Protocortex (O’Leary, 1989) | |
|---|---|---|
| Where the first outline lies | in the progenitors | in the thalamic axons that arrive |
| What it predicts | molecular differences across the progenitors, and some map that forms without thalamic input | young cortex given new input takes on features that match the input |
Both predictions came true in part: the map is drawn twice, sketched by the sheet and refined by its inputs.
Reading a map in a newborn
First, how the maps were read. Mice lacking Emx2 or Pax6 die around birth, before the areas mature, so “an area” in those experiments means a proxy.
- Marker genes. In situ hybridization shows where a gene is switched on in a tissue section (see the techniques for this lesson). Some genes have expression borders at birth that line up with future areas. If a marker border moves in a mutant, the marker map has moved.
- Connections with the thalamus. A thalamic nucleus is a cluster of neurons, and each nucleus projects mainly to its own part of cortex. Dye placed in one spot of cortex labels the thalamic neurons that project there, sometimes in more than one nucleus, so you can ask whether a spot is wired like visual or like somatosensory cortex.
- The barrel field. In layer 4 of rodent somatosensory cortex, clusters of cells called barrels, one for each large whisker, sit in rows that copy the whisker rows on the snout. In mice that survive past birth, a stain for cytochrome oxidase on flattened cortex shows them in the first postnatal week as dark patches, a sharp landmark for where somatosensory cortex sits front to back.
Animals that survive, such as the grafted rats and rewired ferrets below, also allow later anatomy and adult function to be measured. Read each result at the age it was measured.
A lamp at the front: FGF8
Read the transcript of “A Lamp at the Front”
Film transcript: A Lamp at the Front
Can one signal at the edge of the sheet decide where a border falls? A gradient across the sheet needs a source of position. Part of it comes from signalling centres at the edges of the sheet. The cortical hem, at the medial edge, releases Wnt and BMP proteins. At the front is a source of a growth factor, FGF8. Necessary: remove or block it, and look for the loss or shift of what it controls. Sufficient: add it, or add more of it, and look for a structure induced, enlarged or moved. In 2001, Tomomi Fukuchi-Shimogori and Elizabeth Grove ran both kinds of test on FGF signalling. They used electroporation. Brief electric pulses drive injected DNA into progenitors at a chosen spot.
Their readout was the barrel field, one cluster of cells for each large whisker. Picture FGF8 as a lamp at the front of a room. Cells judge how far forward they sit by how bright it is. Turn the lamp up. Add extra FGF8 at the front. Which way should the barrel field move?
Toward the back. Cells read themselves as farther forward, so each border falls farther back. That is what they found. Later work showed FGF8 can act directly on cells at a distance. Cells also respond through the gradients it helps set. Now block the lamp. They used a soluble receptor fragment that binds FGF8, and probably related FGFs. Where does the field go?
Toward the front. More FGF8 moves it back. Less FGF signalling moves it forward. Opposite shifts mark a signal allocating territory. One more test. Put a new lamp at the back, far from the first. What should happen? Near the new lamp, cells read a high level, as if they sat near the front. Part of the pattern repeats there. They found a partial second barrel field, behind the normal one. How far does a border move? A simple model helps. Its numbers are illustrative. Let the level fall by the same fraction over each step back. The decay length is the step that leaves a little over a third. Double the lamp, keeping the decay length and thresholds fixed.
Every border on the sheet moves back by the same distance. That distance is about seven tenths of a decay length. Halve the lamp, and each border moves forward by the same amount. A border pushed past the edge is lost. The equal steps belong to the exponential shape. A straight-line ramp gives unequal steps.
What survives both shapes is the direction, and a graded response to dose. The takeaway: graded signals help place the areas. In our working model, change the dose and the borders slide.
From the film
- In the mouse, extra FGF8 at the front moved the barrel field back, and blocking FGF signalling moved it forward.
- A new FGF8 source at the back gave a partial second barrel field.
- In the working model, a border falls where a graded level crosses a threshold, so changing the dose slides the borders.
A gradient needs a source. In the mouse, part of it comes from signalling centres at the edges of the cortical sheet: the cortical hem at the medial edge, which releases Wnt and bone morphogenetic protein (BMP) proteins, and a source of the growth factor FGF8 at the front. FGF8 acts through fibroblast growth factor (FGF) receptors, which are receptor tyrosine kinases (see that lesson).
Two kinds of test ask whether a signal places a border.
- A test of whether it is necessary: remove or block it and look for the loss or shift of what it controls.
- A test of whether it is sufficient: add it where it is normally absent, or add more of it, and look for a structure induced, enlarged or moved.
In 2001 Tomomi Fukuchi-Shimogori and Elizabeth Grove ran both kinds of test on FGF signalling in mouse embryos, adding FGF8 itself in the gain experiments and a receptor-fragment blocker in the loss experiment. They used electroporation, injecting DNA into the brain and driving it into progenitors at a chosen spot with brief electric pulses. Their readout was the barrel field.
Think of FGF8 as a lamp at the front of a room: cells judge how far forward they sit by how bright it is.
Predict. Add extra FGF8 at the front, so the lamp burns brighter. Which way should the barrel field move?
Check your prediction
Toward the back. Under a brighter lamp, cells read themselves as farther forward than they are, so each border falls farther back. That is what Fukuchi-Shimogori and Grove found. Later work (Toyoda and colleagues, 2010) showed that FGF8 can act directly on cells at a distance from its source; cells also respond through the transcription factor gradients it helps set, the subject of the next section.
Design problem
You can place an extra source of FGF8 anywhere in the mouse cortical primordium. Put one at the back, far from the normal source, and predict what happens to the barrel field. Then predict the map if you reduce FGF8 at the front instead. Say which result tests sufficiency and which tests necessity.
Saved in this browser only.
One way to do it
Near the new source, progenitors read a high FGF8 level, as if they sat near the front. Between the two sources the level rises toward each end, so, for a suitable source strength and distance, the profile dips in the middle and climbs again at the back. If FGF8 level sets identity, part of the pattern should repeat there, giving a second barrel field. That is what Fukuchi-Shimogori and Grove found: a partial second barrel field, posterior to the normal one. An extra source inducing an extra area is a test of sufficiency.
To reduce FGF8 at the front, add a blocker there. They used a soluble fragment of an FGF receptor, which binds FGF8, and probably related FGFs, before they reach the cells. With less of the signal, cells at the front read themselves as farther back, so the front areas should shrink and the posterior areas expand forward; the barrel field moved toward the front. That is a test of necessity.
More FGF8 and less FGF signalling move the field in opposite directions, the strongest kind of evidence.
How far does a border move?
A simple model makes the lamp quantitative. In 2010 Grove’s laboratory (Toyoda and colleagues) measured FGF8 protein in the early mouse cortex and found that it falls off roughly exponentially beyond a plateau near the source. The model borrows that shape; its decay length and thresholds are illustrative. Let the level fall exponentially from the front, C = C₀e−x/λ, where x is the distance from the front and λ, the decay length, is the distance over which the level falls to about 37 percent (1/e). A border sits where the level equals that border’s threshold T, at x = λ ln(C₀/T).
Predict. Double the source, from C₀ to 2C₀, and leave the thresholds alone. Does a border near the lamp move farther than a border far from it?
Check your prediction
No. With the decay length and thresholds fixed, every border that stays on the sheet moves back by the same distance, λ ln 2, about 0.7 decay lengths, because ln(2C₀/T) = ln(C₀/T) + ln 2 whatever the threshold. Halving the source moves each border forward by the same amount, and a border pushed past an edge is lost. With λ set at a fifth of the sheet and three borders, A, B and C, placed a quarter, a half and three quarters of the way back:
| Border | Normal source | Doubled | Halved |
|---|---|---|---|
| A (front) | 0.25 | 0.39 | 0.11 |
| B | 0.50 | 0.64 | 0.36 |
| C (back) | 0.75 | 0.89 | 0.61 |
Positions are fractions of the sheet’s length from the front. The four bands are abstract; the real auditory area lies off this axis. The bands between A and C keep their width; the front band grows and the back band shrinks, or the reverse.
Put sizes on it. If λ were a fifth of a 5 mm cortex, 1 mm (again illustrative), a doubling would move a border about 0.7 mm, comparable in size to the hypothetical 0.6 mm shift in the MCAT practice question. The measured decay is much steeper relative to the sheet; this λ is chosen for easy arithmetic.
The equal shifts come from the exponential shape. If the level instead fell along a straight line, a doubling would move borders by different distances at different positions (worked in Going deeper). What survives either shape is the direction of the shift and its graded response to dose.
The cells’ own record of position
Read the transcript of “The Cells' Own Record”
Film transcript: The Cells' Own Record
The lamp is outside the cells. How does each cell record where it sits? Inside the cells, position is recorded as levels of transcription factors, proteins that switch genes on or off. Two of them run in opposite directions along the front-to-back axis.
Emx2 is highest at the back. Pax6 is highest at the front. Each also varies from the midline outward, and two more factors join them. The levels of these proteins are each progenitor's record of where it sits. The record and the lamp are linked. Changing FGF8 shifts the gradients. Whether Emx2 acts back on it is still argued. A gradient alone is only a correlation. So run both tests: remove the factor, then add more.
Emx2 is highest at the back. Delete it. Which way should the borders move, and which areas should grow? The borders move back. The front-and-middle areas grow, and the visual area shrinks. In 2000, Kathie Bishop, Guy Goudreau and Dennis O'Leary found this in mice lacking Emx2. Without working Pax6, the shift went the other way. Front areas shrank, and the visual area grew forward. Now raise Emx2 everywhere, keeping its slope. What would show that it allocates territory?
The map should move the opposite way, with the whole cortex about the same size. In 2004, Tadashi Hamasaki and colleagues in O'Leary's laboratory found this. The visual area grew and the front areas shrank. Total cortical area did not change significantly. Loss and gain move the borders in opposite directions. That is strong evidence for allocating territory, not simply permitting cortex to exist. COUP-TFI tells a similar story for loss. In 2007, Michèle Studer's laboratory removed it from cortex alone. Frontal motor areas spread across most of the sheet, and the sensory areas were squeezed toward the back. Pax6 is the cautionary case. In 2007, David Price's group raised it up to three times normal.
The map barely moved. A knockout limited to cortex shifted the markers. Yet the area-specific connections with the thalamus stayed normal. So Pax6 may bias how markers are expressed more than it decides where an area sits. But in 2013, a cortex-only knockout shrank the touch area. Its role is still unsettled. The takeaway: when losing a factor and adding it move borders in opposite directions, that is the strongest evidence the factor helps allocate territory. A missing converse result does not rule a factor out.
From the film
- Position is recorded in progenitors as levels of transcription factors such as Emx2 and Pax6, which run in opposite directions front to back.
- Losing Emx2 moved the borders back, and raising it moved them the other way with total cortical area unchanged, so Emx2 allocates territory.
- Pax6 is the cautionary case: losing it shifted markers but raising it barely moved the map, so its role is unsettled.
FGF8 is a signal outside the cells. Inside them, position is recorded as levels of transcription factors that bind DNA. Two of them run in opposite directions along the front-to-back axis of the mouse sheet. Emx2 is highest at the back. Pax6 is highest at the front. Each also varies from the midline outward, and two more factors join them:
| Factor | High along front-to-back | High along medial-to-lateral |
|---|---|---|
| Emx2 | back | medial |
| Pax6 | front | lateral |
| COUP-TFI (also called NR2F1) | back | lateral |
| Sp8 | front | medial |
The record and the lamp are linked: reducing Fgf8 shifted early gradients of gene expression toward the front (Garel, Huffman and Rubenstein, 2003). That link helps explain how a single source at one edge can shift gene expression across the whole sheet, though not every readout of the map moves with it. Whether Emx2 also acts back on fibroblast growth factor (FGF) signalling is still argued.
A gradient is only a correlation. To show that a factor helps place the borders, run both tests from the last section: remove it, and add more of it.
Predict. Emx2 is highest at the back. Delete it, and the cells at the back lose part of their record of being at the back. Which way should the borders move, and which areas should grow?
Check your prediction
Back: the front-and-middle areas, motor and somatosensory, grow toward the back and the visual area shrinks. In 2000 Kathie Bishop, Guy Goudreau and O’Leary found this in mice lacking Emx2. The same year Antonello Mallamaci, Edoardo Boncinelli and colleagues independently reported shifts of area identity in the early cortex of mice lacking Emx2. In mice without working Pax6 (the Small eye mutant), the shift went the other way: the front areas shrank and the visual area expanded forward.
Predict. Now raise Emx2 across the progenitors while keeping its normal slope. What result would show that Emx2 allocates territory, rather than simply being needed for cortex to grow?
Check your prediction
The map should move opposite to the knockout, with the total cortex about the same size. In 2004 Tadashi Hamasaki and colleagues in O’Leary’s laboratory found this: the visual area grew and the front areas shrank, with no significant change in the total area of cortex. Emx2 shows both halves of the test, so it allocates territory rather than simply permitting cortex to exist.
| Factor | Where it is high | Lose it | Raise it | Verdict |
|---|---|---|---|---|
| Emx2 | back | front-and-middle areas grow, visual shrinks (2000) | visual grows, front shrinks, total size unchanged (2004) | allocates territory |
| COUP-TFI | back (and lateral) | frontal motor areas spread across most of the sheet (cortex-only knockout, 2007) | not covered here | needed for sensory territory |
| Pax6 | front | front areas shrink, visual grows (markers, 2000) | map barely moves (2007) | loss and gain disagree; role in placing borders unsettled |
COUP-TFI tells a similar story for the loss half. In 2007 Michèle Studer’s laboratory removed it from cortex alone, in a conditional knockout (a gene deleted only in chosen cells), and the sensory areas were squeezed toward the back as motor areas spread.
Pax6 is the cautionary case: its gain does not mirror its loss. In 2007 David Price’s group raised Pax6 up to three times its normal level and the area map barely moved, and in 2008 a knockout limited to cortex shifted the marker genes while the area-specific connections with the thalamus stayed normal. Mice without Pax6 also have other forebrain defects. So Pax6 may bias how markers are expressed more than it decides where an area sits. A later cortex-only knockout from O’Leary’s laboratory (Zembrzycki and colleagues, 2013) did report a smaller somatosensory area, so Pax6’s part in placing borders is still unsettled.
Input finishes the drawing
Read the transcript of “Input Finishes the Drawing”
Film transcript: Input Finishes the Drawing
The sheet draws a sketch before thalamic axons arrive. Does the sketch need those axons at all? Start with a mouse that lacks the transcription factor Gbx2. In these mice, thalamic axons never reach the cortex. If areas came only from thalamic input, what should the marker borders look like at birth?
They should be missing or misplaced. They were not. In 1999, Emily Miyashita-Lin, John Rubenstein and colleagues found normal borders for several area markers at birth. The marker sketch forms without thalamic input. The limit is the readout. Markers at birth are a sketch, and adult borders could still need input. Now ask the other question. What does input add? In 1991, Bradley Schlaggar and O'Leary grafted visual cortex from fetal rats into newborn rat somatosensory cortex. Thalamic axons carrying whisker signals grew into the graft. What should the graft build?
It formed barrels. Tissue that would have become visual cortex built a feature of the area whose input it received. Mriganka Sur's laboratory went further, in ferrets, which are born with immature visual pathways. In newborns, the retina's normal targets were reduced. The normal inputs to the auditory thalamus were removed. Retinal axons then grew into the auditory thalamus. Auditory cortex received visual activity. Normal auditory cortex has no map of edge orientation. What did the rewired cortex build?
Neurons tuned to edge orientation, arranged in a map like visual cortex, though less regular. A companion paper reported that the animals responded to light through the rewired pathway as a visual stimulus. Input also sharpens the sketch. In 2013, Shen-Ju Chou and colleagues in O'Leary's laboratory removed the axons from the visual thalamus. The genetic distinction between primary visual cortex and the higher-order areas around it failed to develop. Spontaneous and sensory activity then refine the maps inside each area. Later lessons take that up. The takeaway: the marker sketch forms without input by birth. Input then sharpens it, and shapes what each area builds.
From the film
- In mice whose thalamic axons never reach the cortex, marker borders were still normal at birth.
- Given new input, grafted visual cortex formed barrels and rewired ferret auditory cortex built an orientation map.
- Input also sharpens the sketch, as in the split between primary visual cortex and the higher-order visual areas.
The sheet sketches a map before thalamic axons arrive. Does the sketch need them at all?
Predict. In mice lacking the transcription factor Gbx2, thalamic axons never reach the cortex. If areas emerged only from thalamic input, as a strict protocortex would have it, what should the marker borders look like at birth?
Check your prediction
They should be missing or misplaced, and they were not. In 1999 Emily Miyashita-Lin, John Rubenstein and colleagues found that several area marker genes still had their normal borders at birth in Gbx2 mutants. The marker sketch forms without thalamic input. The limit is the one from the readout: markers at birth are a sketch, and adult borders could still need input.
Input then shapes much of what the sketch becomes. In 1991 Bradley Schlaggar and O’Leary grafted visual cortex from fetal rats into the somatosensory cortex of newborn rats. Thalamic axons that carry whisker signals grew into the graft, and the graft formed barrels. Tissue bound for visual cortex could still build a feature of another area when given that area’s input.
The ferret experiments from Mriganka Sur’s laboratory went further. Ferrets are born with immature visual pathways, so in newborns the retina’s normal targets could be reduced and the normal inputs to the auditory thalamus removed; retinal axons then grew into the auditory thalamus, and auditory cortex received visual activity. In 2000 Jitendra Sharma, Alessandra Angelucci and Sur reported that in adult ferrets this rewired auditory cortex held neurons tuned to edge orientation (each responding best to an edge at one angle), arranged in a map like that of visual cortex, though less regular. A companion paper reported that the animals responded to light seen through the rewired pathway as a visual stimulus.
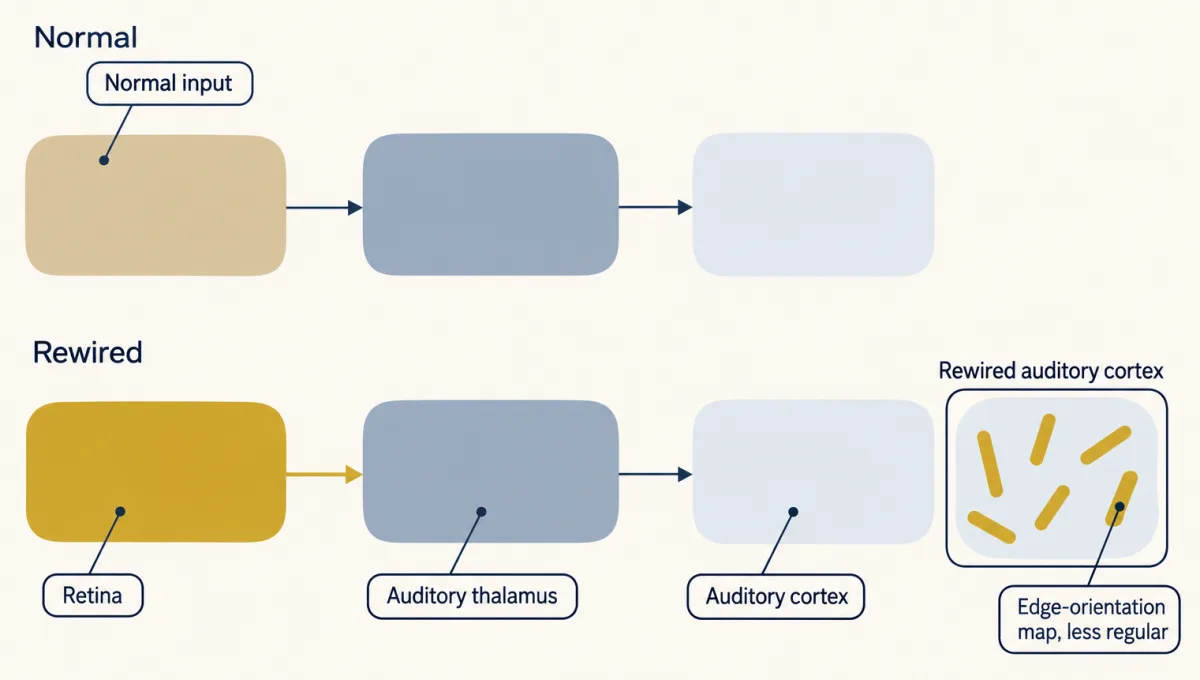
Input also sharpens the sketch. In 2013 Shen-Ju Chou and colleagues in O’Leary’s laboratory removed the axons from the visual thalamus by gene deletion in mice, and the genetic distinction between primary visual cortex and the higher-order visual areas around it, which further process what primary visual cortex passes on, failed to develop. Spontaneous and sensory activity then refine the maps inside each area, the subject of later lessons in this course.
Putting it together
Read the transcript of “One Rule, and Where It Stops”
Film transcript: One Rule, and Where It Stops
We have moved borders many ways. Can one idea tie the results together? More FGF8 at the front: the barrel field moved back. FGF8 blocked: it moved forward. A new source at the back: a partial second barrel field. No Emx2: the front-and-middle areas grew back, and the visual area shrank. More Emx2, same slope: the visual area grew, with total size unchanged. No thalamic axons: marker borders in place at birth. New input: barrels in grafted visual tissue, and an orientation map in auditory cortex. Which factor's loss and gain results did not mirror each other?
Pax6. Losing it shifted the markers, but raising it barely moved the map. Here is the idea that ties them together. Position draws the sketch; input finishes it. Each progenitor's position is recorded as levels of graded signals and transcription factors. In our working model, a border falls where a level crosses a threshold. Change the dose, and the border slides. Add a second source, and part of the pattern can repeat. Thalamic input then sharpens the sketch, tells primary areas from higher-order ones, and helps shape the maps inside. And the strongest evidence for a factor: loss and gain that move borders in opposite directions. A missing converse result does not rule a factor out.
The rule has limits. It covers where the primary area borders sit, front to back, in the mouse. It does not cover total cortical growth, which some of these factors also change. Its threshold model does not explain the maps inside an area. Input and activity build those with the cortex's own cells. it is drawn from mice. It does not claim to explain area sizes in primates or humans. One question stays open. A gradient is smooth, yet mature borders are sharp. How does the smooth gradient become a sharp border? And how much happens in progenitors, and how much in neurons under input? The takeaway: position draws the sketch, and input finishes it.
How the sketch becomes a sharp line is not yet fully understood.
From the film
- Position draws the sketch; input finishes it.
- The strongest evidence for a factor is loss and gain moving borders in opposite directions; a missing converse result does not rule a factor out.
- The rule covers primary-area borders front to back in the mouse, not total cortical growth, the maps inside an area, or area sizes in primates or humans.
The manipulations in this lesson test different things: a border’s position, a marker pattern, connections, or a map inside an area.
| Manipulation | What the map did | Reading |
|---|---|---|
| More FGF8 at the front | barrel field moved back | more FGF8 is enough to move a border |
| FGF8 blocked at the front | barrel field moved forward | FGF signalling at the front, by FGF8 and probably related FGFs, is needed for its position |
| New FGF8 source at the back | partial second barrel field | the starkest sufficiency test: part of the pattern repeats |
| No Emx2 | front-and-middle areas grew back, visual shrank | the loss half of the test |
| More Emx2, same slope | visual grew, front shrank, total size unchanged | the gain half: opposite shifts, so Emx2 allocates territory |
| No Pax6, or more Pax6 | without it, front areas shrank and visual grew (markers); excess barely moved the map | loss and gain do not mirror each other |
| No thalamic axons (Gbx2) | marker borders in place at birth | the marker sketch does not need input |
| New input (graft, rewired ferret) | barrels in visual tissue; an orientation map in auditory cortex | input shapes what an area builds |
Back to the three puzzles. Borders come from graded levels in the progenitors crossing thresholds, in the working model (1). Edge signals such as FGF8 set those levels and factors such as Emx2 record them, so changing either moves borders (2). Input sharpens borders, separates primary from higher-order areas, and helps build the maps inside them (3).
Where the rule stops. It does not cover total cortical growth, which some of the same factors, Pax6 among them, also change. Its threshold model does not explain the maps inside an area, such as barrels and orientation modules; those depend on input and activity working with the cortex’s own cells. And it is drawn from mice, so it does not claim to explain area sizes in primates or humans.
One question stays open. Gradients are smooth, yet mature borders are sharp. How the conversion happens, and how much of it in progenitors and how much in neurons under thalamic input, is not yet fully understood.
Going deeper
Pax6, the eye gene
Pax6 has an older fame: it is needed to build the eye. Mice with one broken copy have small eyes, which named the Small eye mutant; mice with two broken copies have no eyes. People with one broken copy of PAX6 have aniridia, an eye lacking most of its iris. When the fly version, eyeless, was switched on in places where it is normally off, flies grew eyes on their legs and wings. That is sufficiency in its starkest form. In the cortex its role is less clear: it may bias position within a tissue that already exists. The 2007 overexpression study also reported that the added Pax6 turned down the cell’s own Pax6 gene.
Does Emx2 act through FGF signalling?
In 2003 Fukuchi-Shimogori and Grove reported that Emx2 shapes the map by regulating fibroblast growth factor (FGF) signaling. O’Leary’s group disagreed: when they raised Emx2 in progenitors, Fgf8 did not change, and they argued that Emx2 acts on the progenitors directly. Both routes may contribute.
A shifted map, or a smaller sheet?
Later work, including a 2002 study from Luca Muzio, Mallamaci and colleagues, suggested that the late area changes in both kinds of mutant, Emx2 and Pax6, may partly reflect a poorly growing cortical sheet and not only a shifted map, since several of these factors also change progenitor proliferation. This is one reason the Emx2 gain result, with total cortical area unchanged, carries so much weight.
The other two points of the compass
COUP-TFI belongs to the nuclear receptor family but has no known ligand, so it is called an orphan receptor (see that lesson). This lesson’s argument runs along the front-to-back axis, where Emx2 and Pax6 form the clearest pair of opposing gradients, though their experiments differ in how cleanly they can be read.
What the threshold model does and does not say
In the exponential model, multiplying the source by any factor adds λ ln(factor) to every border’s position; a tripled source moves every border that stays on the sheet back by λ ln 3, about 1.1 decay lengths. A straight-line profile behaves differently. If the level falls as C = C₀(1 − x/L) across a sheet of length L, doubling C₀ moves the three borders of the earlier table back by 0.375, 0.25 and 0.125 of the sheet. Halving it, compared with the normal source, moves them forward twice as far, by 0.75, 0.5 and 0.25. That would push border A off the sheet (to −0.5) and park border B exactly at the front edge. (Halving a doubled source simply restores the original.)
A second source in the same model adds to the level everywhere between the two sources, so the lowest-level bands between them can shrink or vanish. Near the new source the level climbs again, and any threshold it reaches is crossed a second time, in reverse order. Which bands repeat depends on the new source’s strength and distance. With the same decay length and thresholds, and a source a tenth as strong at the back edge, the model loses its lowest band (no level falls below the lowest threshold) and gains a narrow band at the back edge with the same level range as the second band from the front. That would resemble a partial repeat, but it is a prediction of the toy model, not a reported result; the reported result is a partial second barrel field behind the first.
Your notes
Select any text in the lesson to highlight it or add a note to it. Your highlights and notes are saved in this browser and collected in your notebook.
This browser is not letting the site save anything (a private window or strict privacy settings), so highlights and notes will be lost when you leave the page.
How we measure it
In situ hybridization for area markers
A labelled strand of RNA or DNA binds the messenger RNA of one gene in a tissue section, showing where that gene is on. Genes whose expression borders line up with future areas let you read an area map at birth, before the areas can be recognized by their anatomy or function.
In utero electroporation
DNA is injected into the fluid-filled ventricle of an embryo's brain and brief electric pulses drive it into the progenitor cells next to the positive electrode. It adds a gene, or a blocker, to one chosen spot of the cortical sheet in a living mouse embryo.
Cytochrome oxidase staining of flattened cortex
The cortex is removed, flattened and cut parallel to its surface, and stained for a mitochondrial enzyme that is rich where thalamic axons end. In rodent somatosensory cortex the stain shows the barrels as dark patches, a sharp landmark for where an area lies.
Cortical transplantation
A piece of young cortex from one area is grafted into another area of a host animal. What the graft becomes, under its new inputs, tests whether its identity was already fixed or could still be set from outside.
Practice questions on this lesson (3) → MCAT-style, original, each with an explanation
Where this lesson fits
Before thisReview first
- Ventral to Dorsal: Sonic Hedgehog and BMP in the Neural TubeThis course · Lesson 10
It teaches how a secreted signal's level sets position along an axis, the logic FGF8 and Emx2 gradients reuse here.
- Local Organizers: The Midbrain-Hindbrain BoundaryThis course · Lesson 9
It shows a localized FGF8 source acting as an organizer, which this lesson moves to the cortex's front edge.
- Transcription Factor Codes: Building a Motor NeuronThis course · Lesson 11
It shows transcription factor levels recording position and setting fate, as Emx2 and Pax6 do for areas.
After thisStudy next
- The Ventricular Zone: Radial Glia as Stem CellsThis course · Lesson 13
It covers the progenitors and radial glia whose columns carry the position record that sketches the area map.
- Birth Order and Fate: Temporal Identity and the Inside-Out CortexThis course · Lesson 16
It extends how cortical progenitors make neurons over time, which adds a timing axis to the area map.
- Topographic Maps: Sperry's Eye and Eph GradientsThis course · Lesson 26
It takes up map formation by gradients of graded cues, here for axon targets in a map inside an area.
Elsewhere on the siteFilms, simulations and method films in other courses
- Where is the lesion?Simulation · Neuroscience
It shows how one primary visual area represents the visual field, which is the kind of area this lesson maps.
Suggested by an AI model from the lessons themselves, then checked. How we use AI
Finish line
Test yourself
8 questions
Practice and MCAT-style, with explained answers.
Next · Lesson 13
The Ventricular Zone: Radial Glia as Stem Cells
In rodents, radial glia, long seen as mere scaffolding, make most cortical neurons. Why does such a progenitor copy its DNA in one place and divide in another?
Continue →← Lesson 11 · Transcription Factor Codes: Building a Motor Neuron