Cell Biology · Unit 5: Cells in tissues
Designing a Cell Biology Experiment
Rewritten on : new text, flashcards and film. Your notes and highlights stay, but the text around them may have moved.
Stretched cells glow green. What would it take to show that stretch made them divide?
Pause when the reading reaches a film, and offer to play it. Saved on this device.
Watch the film now, or keep listening
Builds on:Experiments That Distinguish MechanismsCyclin-CDK Control of the Cell CycleMicroscopy and Quantitative ImagesWhy these?
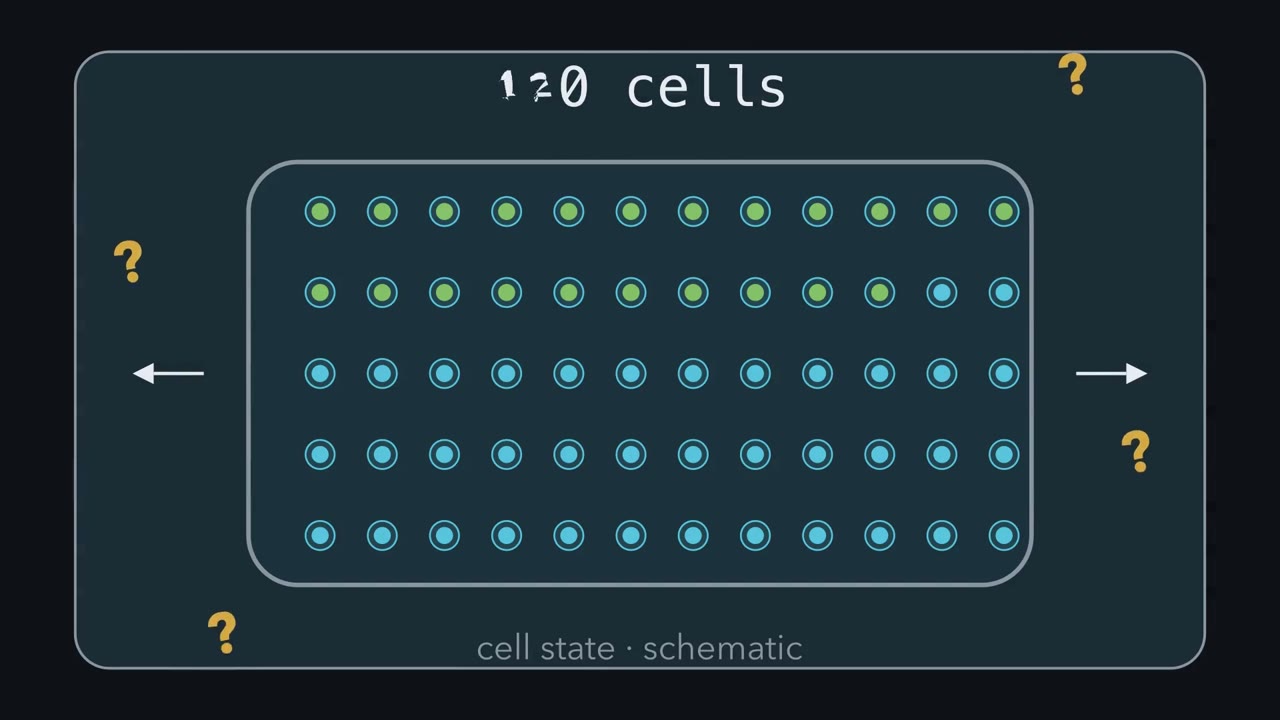 ▶ Watch Before the Data Arrive · 3:28
Read the transcript of “Before the Data Arrive”
Film transcript: Before the Data Arrive
Did stretch cause these cells to divide, or did the experiment only make more cells glow green? And how many experiments are hidden inside one dish? Watch one bench before any results appear. Place two competing models beside the dish.
Model A says stretch is enough for division. Model B says stretch starts the cycle, but another signal is needed for completion. Both predict more green cells. The green snapshot cannot choose between them. A useful prediction sits where the models disagree. A shared prediction cannot test the choice. Here, the disagreement is completed division. The first gold lock closes: write each model's numerical prediction before collecting an image. Now predict. Both paths are real observations, but only one separates these models. Is it more green cells now, or more tracked divisions later? Hold your answer while the two paths move.
Fucci is a two-color cell-cycle reporter. In its simplest picture, green marks entry into S phase, not completion of the cycle. The camera must follow one cell's identity across time. Follow that cell until it becomes two daughters. For division claims, track cells to division instead of counting green cells. Next, ask what received treatment independently.
Every cell here shared one dish, one pipetting, and one stretch. If the dish is odd, every cell carries that oddity. When treatment is applied to a whole dish, the dish is the experimental unit. Measuring more cells describes that dish more precisely, but it does not repeat treatment. Fresh runs do. A new day with new dishes can expose run-to-run variation. Three separately treated dish pairs give three independent summaries per condition. A SuperPlot keeps both levels visible. Small dots show cells, while large symbols show run summaries. Run two now stands out instead of disappearing in the pool. A SuperPlot keeps cell variation visible while comparing independent runs.
The three locks now align. In shared-dish cell experiments, lock the prediction, endpoint and independent unit before the data arrive. Break one link, and the conclusion changes meaning. With all three aligned, the claim, measurement and analysis answer the same question. Controls then test whether a dull explanation could produce that answer. Return to the opening dish.
Six hundred glowing cells can be valuable observations. They are still one treated unit, and green still marks S-phase entry. More dots cannot repair a mismatched endpoint. Trust the conclusion only when all three locks fit.
From the film
- In shared-dish cell experiments, lock the prediction, endpoint and independent unit before the data arrive.
- For division claims, track cells to division instead of counting green cells.
- When treatment is applied to a whole dish, the dish is the experimental unit.
- A SuperPlot keeps cell variation visible while comparing independent runs.
The first film showed that 600 cells sharing one dish do not make 600 experiments. A p-value—a measure of incompatibility with a specified no-effect model—computed from those cells as if they were independent uses the wrong units. What the chapter leaves out are the numbers behind each lock. The running case uses MDCK cells—Madin-Darby canine kidney cells grown as an epithelial sheet—to ask whether stretch makes cells proliferate. All findings below are from those cultured cells.
Make the models disagree
The first film’s Model A said stretch alone is sufficient for division; Model B said stretch starts the cycle but a Wnt signal is needed to finish. Now turn that disagreement into a numerical test. Quiescent cells are not actively cycling.
Wnt proteins are secreted signals. Here, Wnt3A stabilizes beta-catenin, which switches on target genes; the lesson on Wnt signaling covers the pathway. Because the models agree at S-phase entry and disagree at division, completion is the primary endpoint.
Before collecting an image, write each model’s numerical prediction for the chosen endpoint and the range that would favour neither. An experiment that can only confirm is not a test. The lesson on experiments that distinguish develops the same logic.
Predict. In a two-by-two design, Wnt3A alone raises completed divisions as much as stretch plus Wnt3A. What happens to Model B’s claim that stretch and Wnt cooperate?
Check your prediction
It fails Model B’s prediction. If Wnt3A alone matches stretch plus Wnt3A, stretch adds nothing in Wnt3A medium. Model B instead predicts that stretch adds at least 10 percentage points more in Wnt3A medium than in control medium. The result points to Wnt3A adding divisions on its own, not to stretch starting the cycle and Wnt finishing it. This is why the Wnt3A-alone arm is required.
Read the endpoint before interpreting it
The first film’s Fucci picture was the simple case; here is the fuller one. Fucci means fluorescent ubiquitination-based cell-cycle indicator. In these MDCK cells, red mKO2-Cdt1 marks G0 and G1, while green mAG-Geminin marks cells from S phase, when DNA is copied, until mitosis (see cell-cycle control). The green signal can switch on a little before or after DNA replication starts: a green cell has roughly entered S, while only the path to an observed division directly shows completion here.
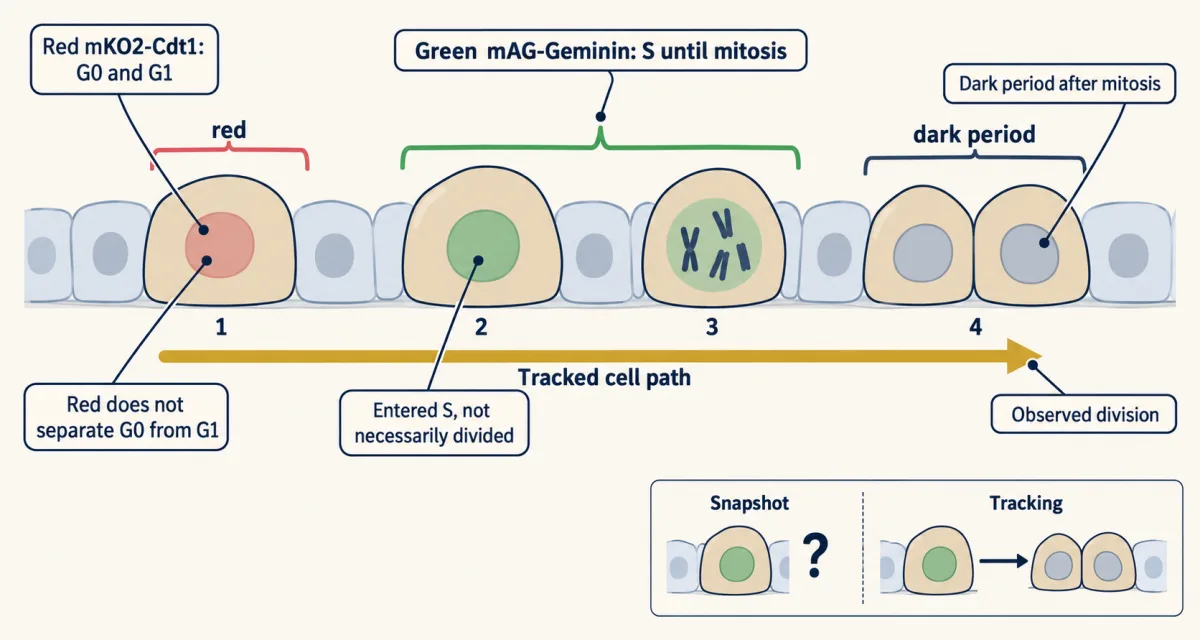
Benham-Pyle and colleagues found in 2016 that about 10% of cells in unstretched, quiescent MDCK-II monolayers were Geminin-positive. Strain alone increased cells in S and G2—the interval before mitosis—without increasing cells tracked from G1 through S to division. Wnt3A alone did not move quiescent cells into S phase in this preparation. Strain plus Wnt3A raised mitotic entry above either input alone. Thus more green meant more cells in S and G2, not more divisions within the 24 hours watched.
EdU supplies a separate endpoint: it is a thymidine analogue that cells build into DNA during the labelling window. Because the Fucci transition is approximate, agreement between green Fucci and EdU supports entry into S without turning either measure into a division count.
Predict. Green cells start to rise only after about 8 hours and keep rising through the 24 hours watched. Can that 24-hour window rule out extra divisions later?
Check your prediction
No. A cell that enters S at 20 hours cannot finish S, G2 and mitosis by 24 hours. A negative division result holds only for the period watched; the window must cover the delay plus the time S, G2 and mitosis take.
Area creates a second endpoint trap. Suppose two circular MDCK tissues, 1.7 and 3.4 mm across—the sizes Heinrich and colleagues used in 2020—each have an edge moving outward at a constant 30 micrometres per hour for an idealized 10 hours. Their radii move from 850 to 1,150 micrometres and from 1,700 to 2,000.
Predict. With the same edge speed, which tissue has the larger percentage area increase? Does that prove faster proliferation?
Check your prediction
The smaller tissue. Its area ratio is (1150/850)² = 1.83, an 83% increase; the larger tissue gives (2000/1700)² = 1.38, a 38% increase. No division rate appears in the calculation. Geometry alone creates the difference, so percent area growth does not prove proliferation.
Count nuclei, as microscopy and images describes, and track divisions. Heinrich and colleagues measured tissue area and cell number and found different changes: over 46 hours, small tissues grew about 6.4-fold in area but about 9.2-fold in cell number.
Read repeatability at the independent-unit level
Formally, the experimental unit is the thing independently assigned to a condition: a dish, stretch device or mouse. The observational unit is what is measured: a cell or field. N is the number of experimental units (Lazic and colleagues, 2018). Treating cells that share a dish as independent replicates is pseudoreplication.
Repeating the whole procedure on separate days supplies information that extra cells from one dish cannot. Lazic and colleagues call choosing days rather than wells a scientific judgement because it asks whether an effect survives a fresh run. They also distinguish the biological unit, the entity the conclusion concerns; with one cell line, the conclusion is about that line.
Worked problem: six hundred cells, three runs
Here is a made-up data set, invented for teaching. Each of three independent days has one control dish and one treated dish, with 200 cells scored per dish for EdU.
| Run | Control (% EdU-positive) | Treated (% EdU-positive) | Treated − control |
|---|---|---|---|
| 1 | 20 | 34 | +14 |
| 2 | 25 | 27 | +2 |
| 3 | 15 | 28 | +13 |
Pooling erases the run labels. Runs 1 and 3 show large differences; run 2 barely moves. Summarizing each dish preserves that disagreement, and the dish-level interval spans a small decrease to a large increase; the calculation is in Going deeper.
Predict. The paired analysis gives p = 0.13. Which statement is justified: “there is no effect,” or “these runs leave the effect uncertain”?
Check your prediction
These runs leave the effect uncertain. A non-significant result does not show no effect, and the wide interval makes the uncertainty visible. Scoring 2,000 cells per dish would shrink some counting noise, but N would remain three and run-to-run variation would remain. More independent runs address that uncertainty.
Use the SuperPlot below (Lord and colleagues, 2020) to switch between pooled cells and run summaries. Only the independently treated run summaries supply N for the comparison.
| Quantity | Lesson’s table (expected) | This draw (observed) |
|---|
N is the number of independent runs, not the number of cells. The data are invented for teaching; Resample redraws each dish’s cells from its percentage, so observed counts wobble around the expected ones. This is a sketch of the logic, not a result.
The three locks are necessary, not sufficient: controls test whether a dull alternative could produce the result.
Even a correct N leaves one question open: what else, besides stretch, differed between the dishes?
The second film picks up here: it asks what a control must match to rule out the dull explanations.
Read the transcript of “Ruling Out the Dull Explanations”
Film transcript: Ruling Out the Dull Explanations
Stretched dishes show more tracked divisions. What else, besides stretch, changed in those dishes? Chapter one locked three things: the prediction, endpoint and independent unit. A control is how you find out. Look at what the stretched dish went through. Someone assembled the device, mounted it and carried it to the microscope. If the control dish skipped those steps, stretch now includes every handling difference. So unstretched devices are assembled, mounted and imaged identically. The medium raises the same problem. Wnt3A medium comes from mouse L cells engineered to make Wnt3A. The matched control is medium from the parental L cells, prepared the same way.
Even that cannot promise Wnt3A is the only difference. So add a readout of the pathway itself. TOPdGFP is a short-lived green reporter driven by beta-catenin-responsive sites. Its signal asks whether the Wnt medium engaged beta-catenin-dependent transcription in these cells. If it stays flat, the medium may not have done its job. Each of these follows one rule. A good control matches the treatment in every step except the one being tested. Without that match, the dull explanation and the interesting one predict the same result. Then a difference between them can point to that step. A drug control gets the vehicle, the drug's solvent without drug, at the same concentration. Whoever scores the cells fixes positivity thresholds before analysis and scores blind to condition.
Otherwise expectations can slip into the counts, one borderline cell at a time. Stretch itself must be checked. Measure the strain the cells actually feel, and analyze only the strained region. In the 2016 study, two biaxial devices reached about 8.5% and 15%. percent. Those results should not be merged. Each device is its own condition. Now predict. Suppose stretched cells stall, and you suspect DNA damage. You stain for a damage marker, and it stays blank. Does that blank marker show there was no damage?
Only if the assay could have seen damage. Benham-Pyle and colleagues ran methyl methanesulfonate, a DNA-damaging chemical, as a positive control. It shows the assay detects damage when damage is present. Even then, one missing marker cannot rule out every kind of damage. Return to the stretched dish and its unstretched twin. They share the handling, medium, vehicle and blinded scorer. The strain itself was measured. Only the stretch differs. Now a difference in tracked divisions can point to stretch, for the period watched.
From the film
- A good control matches the treatment in every step except the one being tested.
- Unstretched devices are assembled, mounted and imaged identically, with matched medium and vehicle.
- A pathway readout such as TOPdGFP asks whether Wnt medium engaged beta-catenin-dependent transcription.
- Scorers fix thresholds before analysis and score blind; strain is measured, and devices are not merged.
- A blank damage marker means something only if a positive control shows the assay detects damage.
Controls that rule out the boring explanations
The second film matched handling, medium, vehicle and scoring one at a time, measured strain, and checked the pathway with TOPdGFP. In practice, assemble, mount and image unstretched devices identically; prepare parental L-cell medium the same way as Wnt3A-conditioned medium; give a drug control the same concentration of vehicle; fix positivity thresholds before analysis, keep them unchanged across conditions and score blind; and analyze only the measured strained region without merging devices that impose different strains. TOPdGFP is a destabilized GFP driven by beta-catenin-responsive sites, so it reports beta-catenin-dependent transcription (hacking the cell covers reporters). A drug concentration copied from a paper is a condition, not a measure of potency. What a single inhibitor cannot settle is whether its intended target did the work.
Predict. One inhibitor produces the expected phenotype. What addition best tests whether inhibiting its intended target caused that phenotype?
Check your prediction
Use an independent genetic perturbation of the target, then restore the target with a rescue version the perturbation cannot touch. A second dish of the same drug or a higher dose still carries the same off-target concern. See CRISPR and functional genomics and drugs against a part.
Putting it together
Now the prediction, endpoint and independent unit return as one design, with controls added to test alternative explanations.
Design problem
A student claims “stretch makes epithelial cells proliferate” from more green Fucci cells after stretching an MDCK monolayer. Redesign the experiment.
Saved in this browser only.
One way to do it
Design. A 2 × 2 factorial—every combination of no stretch or stretch with control (parental L-cell) or Wnt3A-conditioned medium. Run all four arms on each day, assigning devices to arms at random within the day. N is the number of independent days, chosen from a pilot’s run-to-run variation.
Primary endpoint, fixed in advance. The fraction of cells red at the start that are tracked through green (S/G2) to an observed division within a set window, long enough to cover the delay before S entry plus the time S, G2 and M take. Call it Q.
Predictions, with invented thresholds (they are teaching choices, not values from any paper).
- Model A: Q(stretch) - Q(control) is at least 10 percentage points.
- Model B: Q(stretch) - Q(control) is at most 2 points, and the stretch effect in Wnt3A medium, Q(stretch + Wnt3A) - Q(Wnt3A), is at least 10 points larger than the stretch effect in control medium. The Wnt3A-alone arm is what separates “Wnt3A is needed to finish” from “Wnt3A adds divisions on its own”; in the 2016 study, Wnt3A alone briefly raised mitoses in unstretched monolayers.
- Inconclusive: a stretch-alone difference between 2 and 10 points, or confidence intervals wide enough to fit both models.
Secondary endpoints. Nuclear counts and density, EdU, TOPdGFP, and cell loss, each reported separately.
Controls. Identically handled unstretched devices; L-cell medium; vehicle for any drug; fixed thresholds; blinded scoring; measured strain. For molecular claims, a genetic perturbation of beta-catenin signaling with rescue alongside any inhibitor.
Analysis. Day-paired device means, shown as a SuperPlot.
Compare with the published result. The evidence above fits Model B’s pattern in quiescent canine MDCK-II monolayers held under static strain in culture. Whether the same holds with another starting state, another kind of stretch, another epithelium or in tissue is a separate experiment.
Going deeper
These details show where reporter timing, arithmetic, pathway tools and biological context limit the main design.
Reporter limits and biological scope
Red Fucci does not distinguish G0 from G1, so red alone cannot prove that a cell is quiescent. The construct also has a dark period after mitosis, when neither color is bright, so a snapshot undercounts cells that have just divided. These limits are why reporter fractions are not rates and why the main design tracks individual cells.
Other work in MDCK cells points the other way: stretch alone pushed cells paused in G2 into mitosis within about an hour through the channel Piezo1 (Gudipaty and colleagues, 2017). The answer depends on the cells’ starting state and the kind of stretch, so a design must state both.
The paired calculation
Pooling the invented data gives 120 of 600 control cells and 178 of 600 treated cells: 20.0% and 29.7%, a 9.7-point difference. If all cells are wrongly treated as independent, the standard error is
SE = sqrt(0.20 × 0.80 / 600 + 0.297 × 0.703 / 600) = 0.0248, about 2.5 points
and z is about 3.9, which looks decisive. With the dish as the unit, the last column of the table has mean 29 / 3 = 9.67 points. Its deviations from the mean are 4.33, −7.67 and 3.33; their squared sum is 88.7. Dividing by n − 1 gives variance 44.3, SD 6.66 and SE 6.66 / sqrt(3) = 3.84. Thus t = 2.51 with 2 degrees of freedom, and the two-sided p is about 0.13. Using the critical t value 4.303, the 95% interval is 9.67 ± 16.5, or about −6.9 to 26.2 points.
Pathway controls and device details
Wnt3A-conditioned medium comes from mouse L cells engineered to make Wnt3A. Parental L-cell medium matches its preparation, but cannot guarantee that Wnt3A is the only difference; a Wnt-pathway readout or blocker tests whether the pathway did the work.
Benham-Pyle and colleagues compared SU6656 at 10 µM, which inhibits Src-family kinases, with a DMSO vehicle control and found that it blocked strain-induced EdU incorporation. A casein kinase I inhibitor, which allows beta-catenin to build up, raised mitotic entry with strain; iCRT3, which blocks beta-catenin-dependent transcription, prevented that rise. The authors flagged possible off-target effects of the casein kinase I inhibitor, so one inhibitor does not prove its nominal target.
The two devices in the 2016 study reached different strain maxima, about 8.5% and 15%. Their results should not be merged.
These habits carry into the rest of the unit. The lessons on epithelia, stem cells and cell state and disease all rest on claims about proliferation and identity, and each claim is only as good as its unit, its endpoint and its controls. For the probability behind the statistics, see the lesson on probability and crosses.
Your notes
Select any text in the lesson to highlight it or add a note to it. Your highlights and notes are saved in this browser and collected in your notebook.
This browser is not letting the site save anything (a private window or strict privacy settings), so highlights and notes will be lost when you leave the page.
How we measure it
Fucci live imaging with single-cell tracking
Cells carry two fluorescent reporters: red mKO2-Cdt1 in G0 and G1, green mAG-Geminin from S phase until mitosis. Filming the same cells and following each one separates entry into S and G2 from completion of a cycle with an observed division.
EdU incorporation
EdU, a thymidine analogue, is built into DNA by cells replicating during the labelling window and is then detected in fixed cells. It reports DNA replication, a distinct endpoint from reporter colour or division.
TOPdGFP transcriptional reporter
A destabilized GFP is placed under control of TCF-binding sites, so that its level reports beta-catenin-dependent transcription. Comparing it across conditions asks whether a treatment engaged the Wnt pathway at the level of gene expression.
Experimental-unit analysis and SuperPlots
Identify the thing independently assigned to treatment, summarize each unit, and do the statistics on those summaries. A SuperPlot shows the cells as dots and each run's mean as a large symbol, so the true N is visible in the figure.
Practice questions on this lesson (3) → MCAT-style, original, each with an explanation
Where this lesson fits
Before thisReview first
- Experiments That Distinguish MechanismsThis course · Lesson 3
You need its logic of making two models predict different results before designing a test between them.
- Cyclin-CDK Control of the Cell CycleThis course · Lesson 17
The Fucci and EdU endpoints here assume you know G1, S, G2 and mitosis and how cells enter each.
- Microscopy and Quantitative ImagesThis course · Lesson 2
Counting nuclei and scoring images blind rests on how quantitative images are made and read.
Elsewhere on the siteFilms, simulations and method films in other courses
- Chi-square tester: do these counts fit the ratio?Simulation · Genetics and Molecular Biology
Chi-square testing shows how real counts scatter around a prediction, which helps you set a threshold in advance.
- Chi-square testMethod film
It gives a worked test of whether counts differ from a prediction by more than chance.
Suggested by an AI model from the lessons themselves, then checked. How we use AI
Finish line
Test yourself
8 questions
Practice and MCAT-style, with explained answers.
That's the last lesson · Next course
Genetics and Molecular Biology
How traits are inherited, and how DNA stores, copies and uses the information.
Start the next course →Before you move on: review the questions you missed , or go back to all lessons in this course.