Ecology and Evolution · Skim version
Movement and Spatial Populations
Read the full lesson → Skim the whole course →
The guiding idea
If each pond's frogs last only about a decade, why can a region still have frogs a century later?
A region can keep a species even though no patch keeps its population, as long as the colonization rate c is greater than the extinction rate e: in the Levins model occupancy then settles at p* = 1 − e/c, where patches refounded balance patches lost.
From the film: A Region Outlasts Its Ponds
- In the Levins model each patch is simply occupied or empty, and p is the fraction occupied.
- Occupancy rises by colonization, c p (1 − p), which needs both occupied and empty patches, and falls by local extinction, e p.
- Occupancy settles where gains balance losses, at p* = 1 − e/c, so a region keeps a species only while colonization beats extinction: c greater than e.
- Which patches are occupied keeps changing even when the fraction occupied does not.
- The model assumes many identical, equally reachable patches with constant rates; a small network can still lose every patch by chance.
From the film: Two Kinds of Zero
- A survey zero can mean the species is absent, or that it was there and missed.
- A history such as 010 shows a site that was occupied and missed on two of three visits.
- If each visit independently detects an occupied site with probability 0.5, three visits all miss it one time in eight.
- Visiting each site several times, while occupancy stays fixed, lets a model estimate detection and occupancy separately.
- In Maryland in 2000, American toads were detected at 10 of 29 wetlands analysed, about 0.34, but estimated to occupy 0.49.
-
The ledger: colonization against extinction
-
What sets the rates: dispersal, sources and rescue
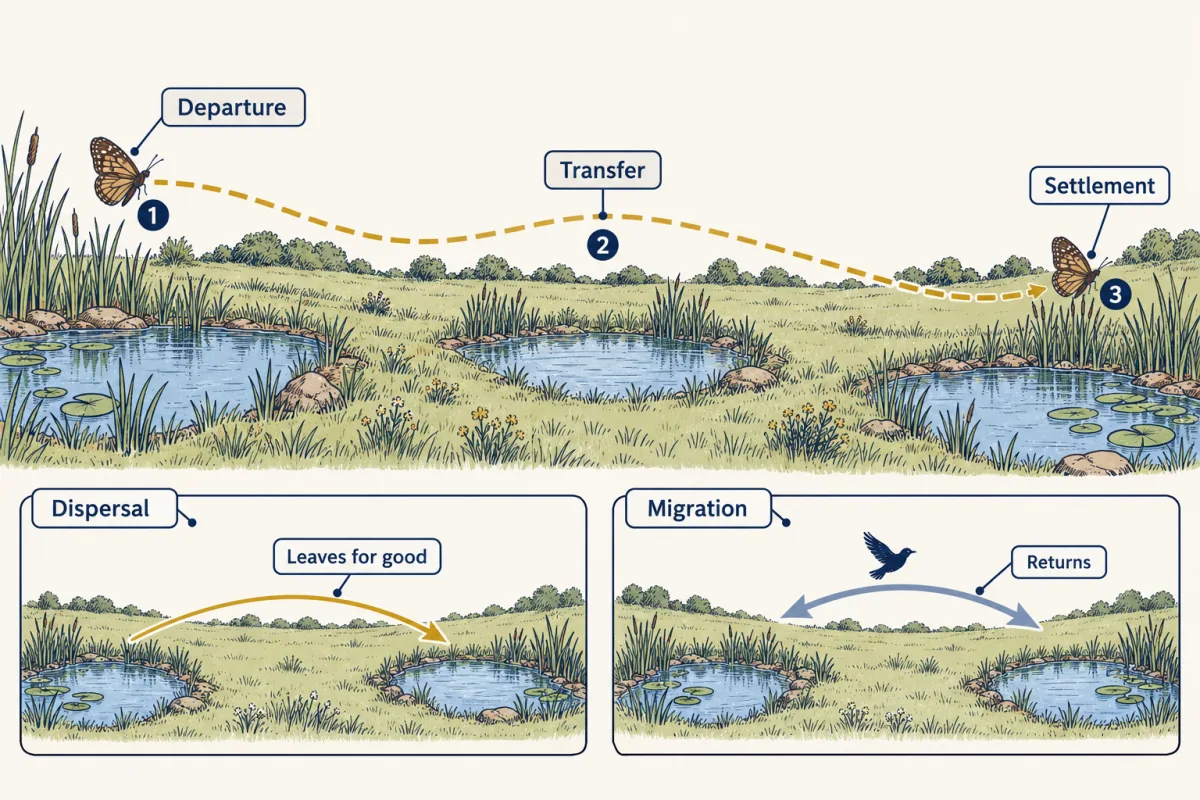
Dispersal has three stages that can be measured separately: departure, transfer and settlement. Migration is a seasonal round trip; dispersal changes where an animal breeds. AI-generated illustration 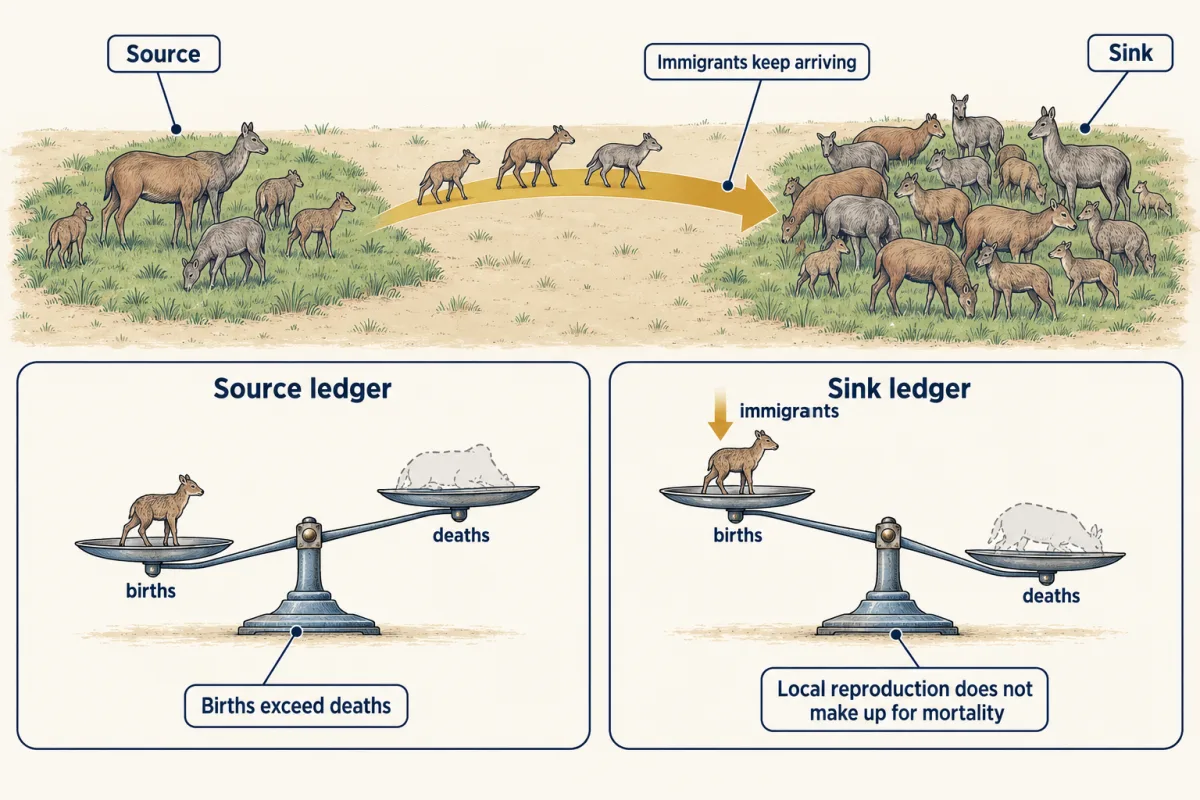
A source exports its surplus; a sink persists only because immigrants keep arriving, so it can be full of animals. Abundance does not label a source; birth and death rates do. AI-generated illustration -
Two kinds of zero: occupancy
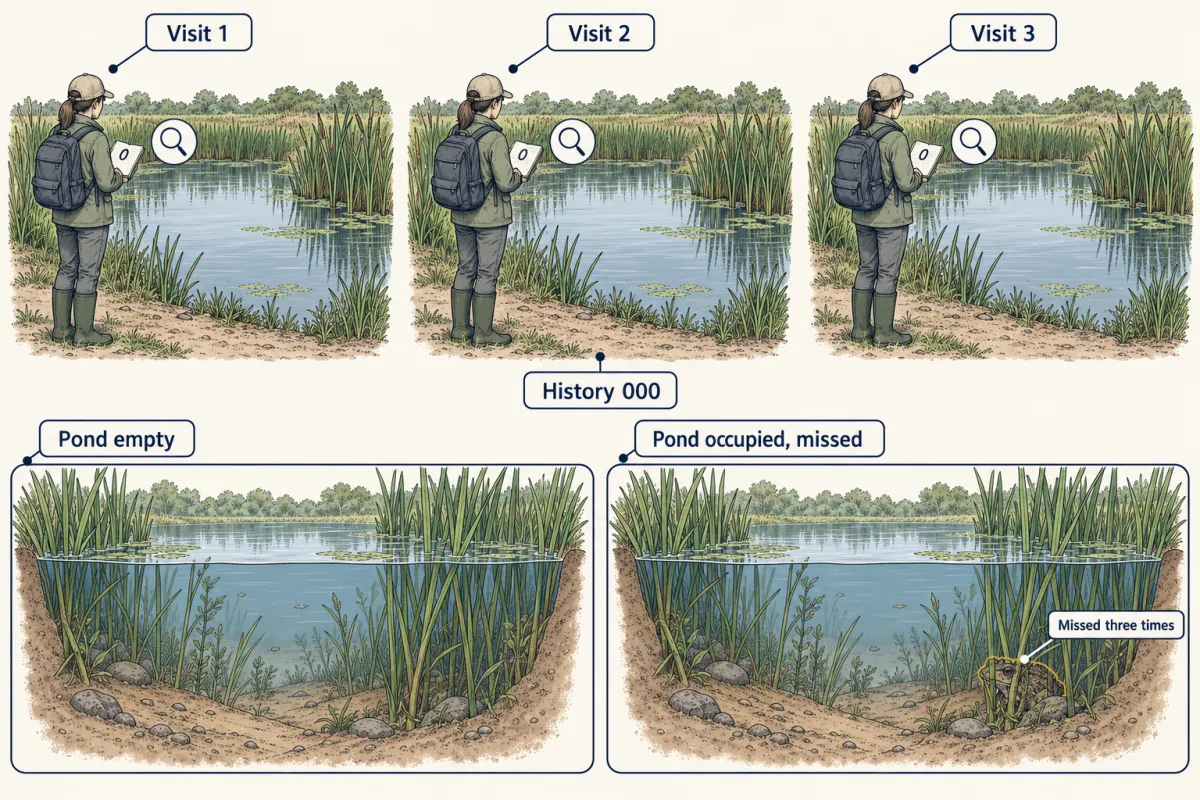
A history of 000 fits an empty pond or an occupied one missed on every visit, so a survey zero is not proof of absence. AI-generated illustration -
Counting animals: mark-recapture
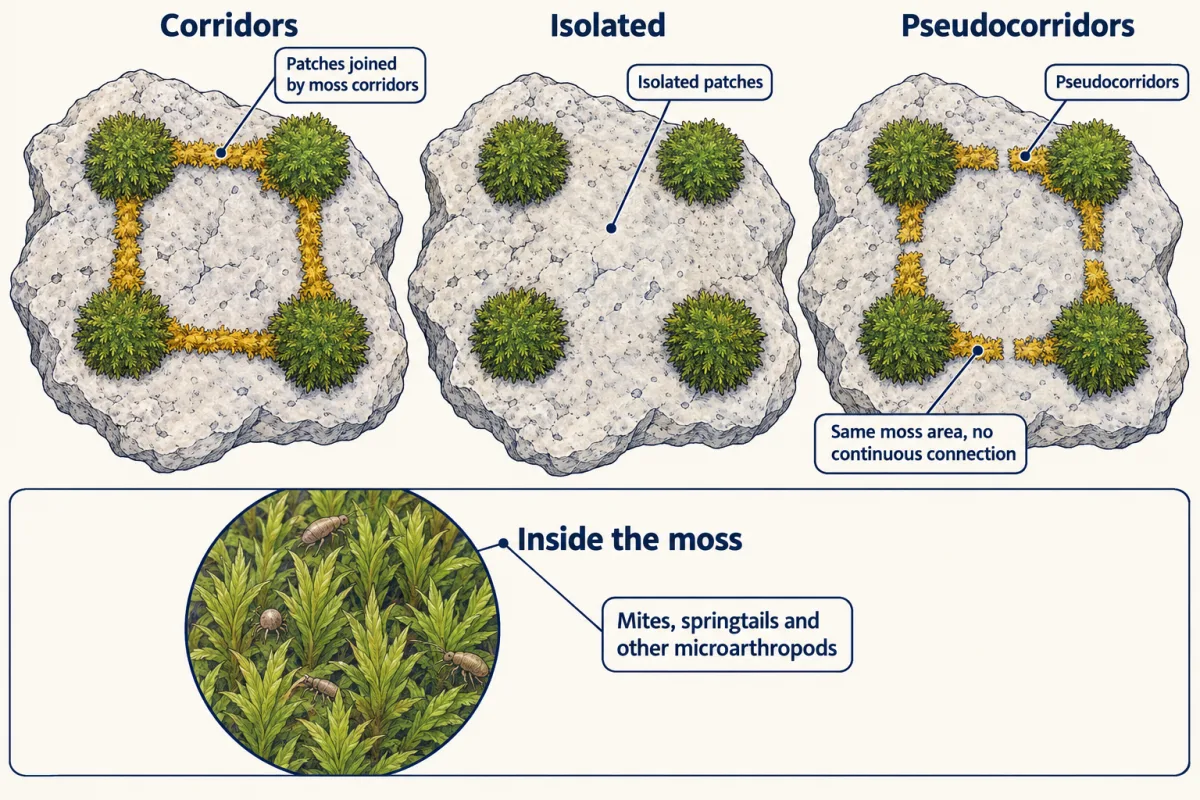
A pseudocorridor adds about as much moss as a corridor but no continuous connection, which is how the moss experiment separated connection from added area. Schematic, not to scale. AI-generated illustration -
Going deeper
Where this lesson fits
Before thisReview first
- Population Growth and RegulationThis course · Lesson 14
You need growth factor lambda and constant per-capita rates from there before treating colonization and extinction as rates.
- Demography and SurvivorshipThis course · Lesson 13
Birth and survival rates from there are what the source and sink ledger of births and deaths uses.
- Distributions, Niches and TolerancesThis course · Lesson 12
You need to know why a species occupies some places and not others before asking which patches are occupied.
After thisStudy next
- Predation and Community EffectsThis course · Lesson 17
Spatial structure can prolong predator-prey cycles, which this lesson first showed with Huffaker's oranges.
- Island BiogeographyThis course · Lesson 20
Colonization balancing extinction sets species number on islands, the same ledger applied to species instead of patches.
- Conservation and RestorationThis course · Lesson 25
Corridors, rescue and small networks lost by chance are used there to judge how to protect fragmented populations.
Elsewhere on the siteFilms, simulations and method films in other courses
- Grow a population, then add limitsSimulation · Biology
Shows how a single population levels off, a contrast to a region's occupied fraction settling at balance.
Suggested by an AI model from the lessons themselves, then checked. How we use AI