Biology · Unit 7: Ecosystems
The Chesapeake Under Pressure
Rewritten on : new text, flashcards and film. Your notes and highlights stay, but the text around them may have moved.
How can fertilizer spread on a field far upstream leave crabs and fish short of oxygen at the bottom of the Chesapeake Bay?
Pause when the reading reaches a film, and offer to play it. Saved on this device.
Watch the film now, or keep listening
Builds on:Matter CyclesRespiration and ATPPopulations and Carrying CapacityWhy these?
Where this lesson sits
- Virginia SOL BIO.8d
- Practices BIO.1a, BIO.1b, BIO.1c, BIO.1d, BIO.1e, BIO.1f
Essential question: How do human actions change ecosystems, and what can we do about it in our own watershed?
-
Life Science (grade 7) LS.9 a-c and LS.8 c
Review it at grade 7 level
In Life Science you learned that people change ecosystems through habitat destruction, pollution, invasive species and climate change, and that ocean water is becoming more acidic. You also learned that not all human impacts are negative, because people can protect and restore habitats. An ecosystem may recover after a disturbance, depending on how severe it was and how resilient the ecosystem is. Chesapeake Bay blue crabs and menhaden were one Virginia example. Biology adds the step-by-step chain of eutrophication, real Bay data, and how to design and test a fix for a watershed.
-
Biology BIO.8d You are here
This lesson
-
Biology II Biology II: Ecology, EC.2 d and f, EC.7 c; Advanced Topics, BIOII.6 f
Preview where it goes next
Virginia's Biology II Ecology course pairs each threat from people with ways to remediate it. It adds the laws and agreements behind conservation, such as the Endangered Species Act of 1973 and the United Nations Convention on Biological Diversity, and has you run a biosurvey of a local area. It studies invasive species in a local ecosystem, which this lesson left out. The Advanced Topics course adds ecosystem services: the clean water, fisheries, flood control and other benefits people get from working ecosystems. Those services give a way to weigh the cost of a buffer or a reef against what the Bay gives back.
-
College
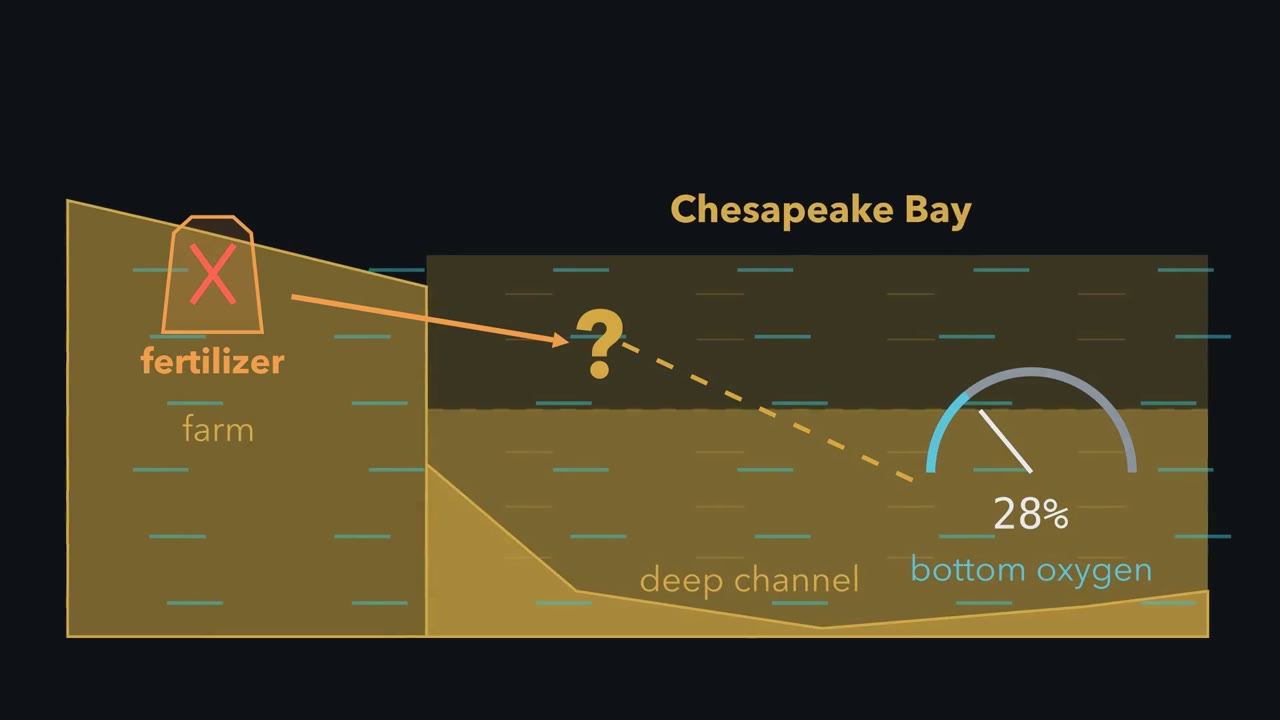 ▶ Watch Where the Bay's Oxygen Goes · 3:29
Read the transcript of “Where the Bay's Oxygen Goes”
Film transcript: Where the Bay's Oxygen Goes
How can fertilizer spread far upstream leave the Bay's bottom short of oxygen? The fertilizer never grabs oxygen itself. Follow this cross-section from a field to the Bay's deep channel. The missing oxygen comes from a living chain, helped by summer water.
A watershed is all the land that drains into one river, lake, or bay. Rain becomes runoff when it flows over the ground. Orange nutrient markers join that water from fields, lawns, wastewater, and the air. Here, nutrients mean nitrogen and phosphorus. The orange markers reach sunlit surface water. Green algae multiply, turning a thin layer into a thick bloom. The bloom shades the gold grass below. Some algae also grow on grass blades. Less light reaches the leaves, while dead algae begin sinking. At the bottom, bacteria break down the dead algae. Bacteria are decomposers, living things that break down dead matter. They use blue dissolved oxygen while they work.
Dissolved oxygen is oxygen gas mixed into water. Fish, crabs, and oysters need it. Now split the Bay into a cyan surface layer and a navy bottom layer. Both begin with oxygen. If the layers barely mix, which oxygen gauge will fall first?
The bottom gauge falls first. Fresh river water floats above saltier, heavier seawater in summer. The boundary slows mixing. Surface water still exchanges oxygen with the air. Below, decomposition keeps using oxygen, but replacement is slow. Water this low in oxygen is hypoxia. Warm water holds less dissolved oxygen, and bacteria decompose faster when it is warm. That strengthens the summer shortage. So the deep channel runs shortest on oxygen in summer, not winter. The chain also has a delay. Much nitrogen arrives with high river flow in late winter and spring. Algae grow, die, and sink over time. Decomposition can continue into summer, so scientists use spring nutrient inputs when forecasting summer hypoxia.
This process is eutrophication: nutrient enrichment feeds too much algae and can lead to oxygen loss. Animals that can leave low oxygen move away. Others may sicken or die. Follow the cause carefully. Nutrients start the chain, while living things use the oxygen. Low oxygen is not the only effect. The surface bloom and algae on grass blades block sunlight. That can weaken underwater grass habitat, a second harm that does not depend on low oxygen. Weather changes the outcome, but human nutrient inputs remain a pressure people can reduce.
From the film
- Extra nutrients feed algae; bacteria use oxygen while poor mixing limits replacement.
- Runoff can carry nitrogen and phosphorus from a watershed into the Bay.
- Bacteria use dissolved oxygen while decomposing dead algae.
- Summer layering slows the replacement of oxygen in deep water.
Each summer, water near the bottom of the Chesapeake Bay’s deep channel typically holds too little oxygen for crabs and fish to stay. People call it a dead zone.
No one pours in a chemical that soaks up oxygen. How can fertilizer on fields far up the Susquehanna, Potomac and James leave the Bay’s floor short of oxygen, and can people fix it?
What do you think? Decide before you read.
-
Scientists disagree: Scientists measure nutrients in Bay water and the rivers that feed it. A 2018 study found that nitrogen in Bay water fell about 23 percent after 1984 as pollution was cut, and underwater grass regained about 17,000 hectares. Human choices moved those numbers.
What scientists think
Scientists disagree: Scientists measure nutrients in Bay water and the rivers that feed it. A 2018 study found that nitrogen in Bay water fell about 23 percent after 1984 as pollution was cut, and underwater grass regained about 17,000 hectares. Human choices moved those numbers.
-
Scientists disagree: Rain washes lawn fertilizer and manure into streams, wastewater plants release treated water into rivers, and air pollution drops nitrogen onto land and water. Stream gauges and water samples track these nutrients downstream to the Bay.
What scientists think
Scientists disagree: Rain washes lawn fertilizer and manure into streams, wastewater plants release treated water into rivers, and air pollution drops nitrogen onto land and water. Stream gauges and water samples track these nutrients downstream to the Bay.
-
Scientists disagree: In Virginia’s Great Wicomico River, researchers built oyster reefs starting in 2004, and by 2009 they estimated about 185 million oysters there. Underwater grass has also partly come back. Recovery is real, but slow and usually partial.
What scientists think
Scientists disagree: In Virginia’s Great Wicomico River, researchers built oyster reefs starting in 2004, and by 2009 they estimated about 185 million oysters there. Underwater grass has also partly come back. Recovery is real, but slow and usually partial.
From a watershed to bottom water
- watershed
- runoff
- nutrient
- eutrophication
- dissolved oxygen
- decomposer
- hypoxia
- riparian forest buffer
- submerged aquatic vegetation
- restoration
- criteria
- constraints
The first film followed nutrients from a field to bacteria on the Bay floor. Its terms:
- A watershed is all the land that drains into one river, lake or bay. The Bay’s covers parts of six states and Washington, D.C. In Virginia, the Potomac, fed by the Shenandoah, and the Rappahannock, York and James drain to the Bay.
- Runoff is rainwater that flows over the ground instead of soaking in, carrying what it picks up. A nutrient is a substance living things need to grow; here, nitrogen and phosphorus.
- Dissolved oxygen is oxygen gas mixed into water, measured in milligrams per liter (mg/L). Fish, crabs and oysters take it in through their gills. Water too low in oxygen for most animals, usually below 2 mg/L, is hypoxia; in the Bay it forms mostly in bottom water.
- An algal bloom is a sudden, thick growth of algae. A decomposer is a living thing that breaks down dead matter.
- Eutrophication is the enrichment of water with nutrients, which feeds too much algae growth and can lead to oxygen loss.
extra nutrients → algal bloom → algae die and sink → bacteria decompose them and use oxygen → low-oxygen bottom water
Animals that can swim away leave; others may sicken or die. Because the chain takes months, scientists forecast each summer’s dead zone from the nutrients rivers carried in spring.
Why deep water runs short
The first film showed how summer layers keep new oxygen from reaching the bottom. Picture that bottom water as a closed room full of breathers.
Predict. A storm mixes the layers before the nutrient supply changes. What should happen first to oxygen near the bottom?
Check your prediction
It should rise. Mixing brings oxygen-rich surface water down before the dead algae change. Here the closed-room picture breaks down: a storm opens the door.
Shallow, well-stirred water usually escapes the long summer dead zone, but not always.
Predict. In a shallow, nutrient-rich cove, should oxygen be lower near sunset or just before sunrise?
Check your prediction
Just before sunrise. At night algae stop photosynthesis but keep using oxygen, so oxygen can drop very low even where the water is shallow.
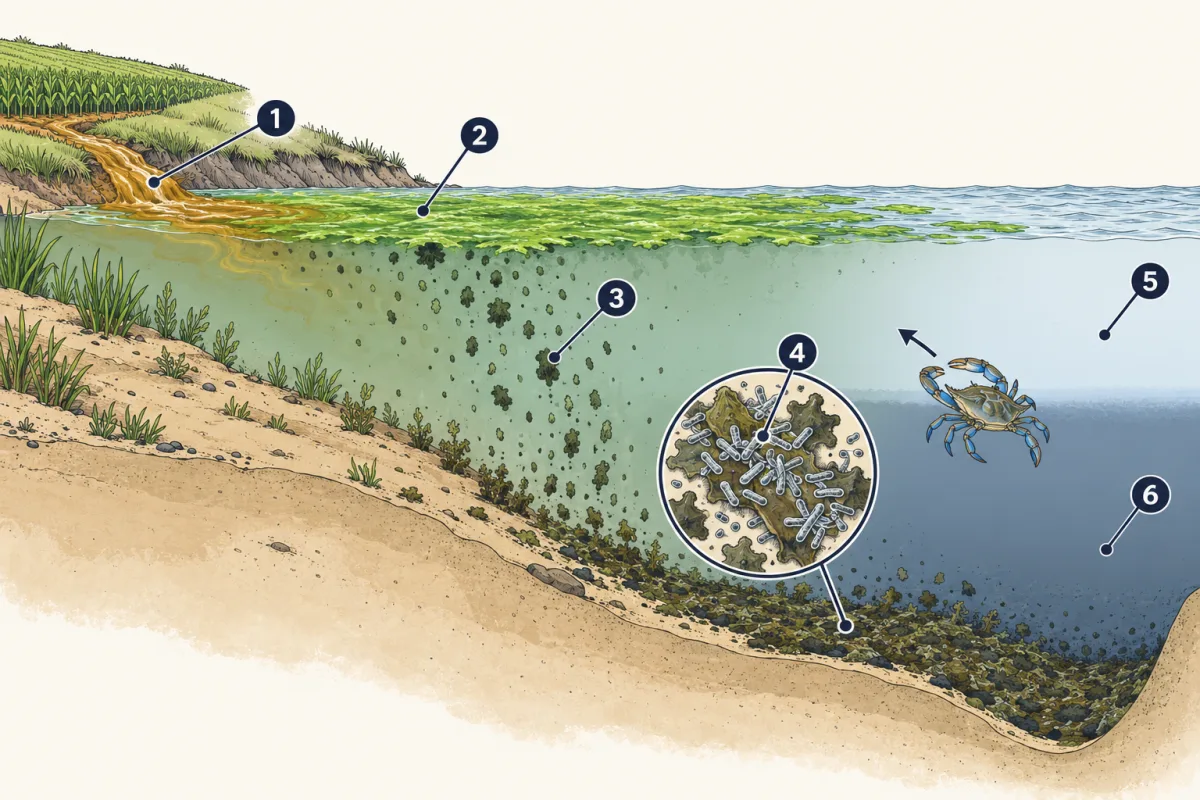
- runoff
- algal bloom
- dead algae
- bacteria
- fresh river water
- hypoxia
- runoff
- algal bloom
- blank
- blank
- blank
- blank
Word bank: bacteria, dead algae, fresh river water, hypoxia
- blank
- blank
- blank
- blank
- blank
- blank
Check your labels
- runoff
- algal bloom
- dead algae
- bacteria
- fresh river water
- hypoxia
People and nature both change ecosystems
An ecosystem’s capacity to support life depends on habitat, light, oxygen and food. Large disruptions include eutrophication, climate shifts and catastrophes.
| Change | Cause | One effect |
|---|---|---|
| Clearing forest for farms, roads and houses | People | More runoff and soil reach streams |
| Intensive farming with fertilizer and manure | People | Extra nutrients, some stored in soil and leaking out years later |
| Releasing chemicals in wastewater and from industry | People | Nutrients; some contaminants can harm wildlife reproduction |
| Burning fuel in cars and power plants, and ammonia gas from manure and fertilizer | People | Nitrogen falls from the air onto land and water |
| Wildfire | Nature, sometimes people | Storms afterward wash ash and soil into streams |
| Drought or flood | Nature | Changes how much fresh water and nutrient reach an estuary |
| Climate shift (warming) | Mostly people today; nature in the past | Warmer water holds less oxygen and speeds oxygen use |
People cannot stop heavy rain, but the first four rows are choices people make. The second film shows where a cleanup budget can act on them.
Read the transcript of “Design a Fix That Can Be Tested”
Film transcript: Design a Fix That Can Be Tested
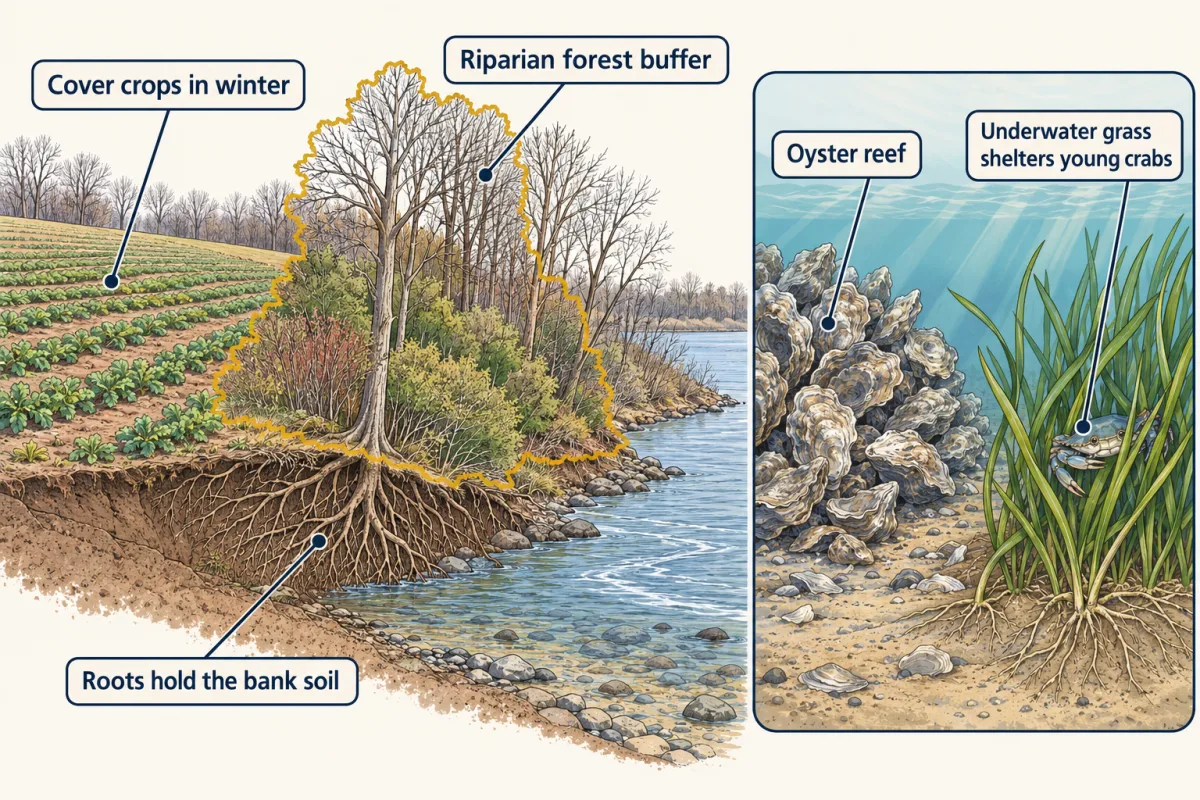
The first film followed nutrients from land to low oxygen. Where should a limited cleanup budget act? A useful plan cuts the cause first, rebuilds habitat, and works within real limits. Restoration means returning a damaged ecosystem toward health. Criteria say what a solution must achieve, such as lowering nitrogen or adding habitat. Constraints are limits, including money, land, and time. The budget bar is one constraint, so every choice has a trade-off. Start upstream. A forest buffer is a strip of trees and shrubs beside a stream. It slows runoff, traps soil, and can remove nitrate from water underground.
Winter cover crops hold soil and take up leftover nitrogen. Both act before nutrients reach the Bay. Wastewater upgrades remove more nitrogen at a treatment plant. Oyster reefs work differently. Oysters filter particles, and the reef shelters other animals. Reefs rebuild habitat, but they do not replace cutting nutrients. In this plan, underwater grass is a readout, not a tool. Cleaner water can let it return where conditions suit it. Place each tool beside the step it can change.
Land and treatment tools can reduce orange nutrient flow. Reefs add habitat directly, and cleaner water can let underwater grass return. So a plan cuts nutrients first, then adds habitat as its criteria and budget allow. No single readout tells the whole story. Nitrogen load, the total delivered over time, tracks a pressure entering the Bay.
Summer oxygen tracks a condition animals need. Underwater grass tracks habitat. A plan may improve one before another, so keep all three gauges beside the same map. Suppose nutrient flow drops after a new fix. Which change should appear first: less nutrient pressure, or a fully regrown grass bed?
Less nutrient pressure can appear first. Grass recovery often lags: the water must clear, and plants need time to spread back. Stored nitrogen can also keep leaking from soil for years, so even the nutrient drop can be slow.
Track each criterion over time instead of judging one sample. A strong plan states what evidence would count before work begins. Measure the pressure, the condition, and the habitat response. Repeat measurements across several years. Keep the comparison fair, and report when the evidence supports only part of the plan. Build the plan, measure the results, and compare them with a place that received no fix. If results are unclear, refine the design and test again. The causal chain tells you where to act. Measured criteria tell you whether the plan works.
From the film
- Effective fixes cut nutrients first, rebuild habitat, and track recovery over time.
- Criteria say what a plan must achieve; constraints limit the plan.
- Buffers, cover crops and wastewater upgrades can reduce nutrient inputs.
- Oyster reefs rebuild habitat but do not replace cutting nutrients.
Fixing a watershed by design
Human activity is not always harmful. In the second film’s terms, restoration is returning a damaged ecosystem toward health. Criteria are what a solution must achieve, such as cutting a set amount of nitrogen. Constraints are limits such as money, land and time. What the film left out:
- A riparian forest buffer also holds the bank with its roots. Its plants and soil microbes remove nitrate from water seeping through the ground. How much nitrogen it stops depends on its width, soil and water flow.
- Cover crops are planted after the fall harvest and grow through winter.
- A 2022 study linked large drops in city nutrient pollution to wastewater plant upgrades. It also found that nitrogen falling from the air declined across the watershed from 1985 to 2019.
- Virginia has rebuilt oyster reefs in the Lafayette, Lynnhaven and Piankatank rivers.
The habitat these tools aim to bring back includes submerged aquatic vegetation, underwater grass usually rooted in shallow bottoms. It shelters young crabs and needs light. A 2018 study found that as nitrogen in Bay water fell, underwater grass regained about 17,000 hectares, roughly 42,000 acres.
Test a cleanup plan
The model gives you a fixed budget for five fixes: forest buffers, cover crops, wastewater upgrades, oyster reefs and stormwater ponds. Each fix has a cost and a nitrogen effect. Its readouts are the second film’s three gauges: nitrogen load, summer oxygen and underwater grass. The values are relative, and real responses often lag by years.
- Predict. Which single fix will lower nitrogen most for its cost? Write the reason from the causal chain, then spend the full budget on that fix.
- Reset and split the same budget across three fixes. Decide first whether the plan should cut more nitrogen, rebuild more habitat or balance both. Predict better or worse, then test it.
- Reset and spend the whole budget on oyster reefs. Predict the change in nitrogen load, then check all three readouts.
Budget: 10 units. Drag a slider to spend on a fix, or press “All in”. Move several sliders to split the budget.
| In this sketch (relative units) | Start | Early years | Many years later |
|---|---|---|---|
| Nitrogen load | 100 | 100 | |
| Low-oxygen bottom water, summer | 100 | 100 | 100 |
| Underwater grass | 20 | 20 | 20 |
Load = 100 − 0 = 100
No money spent yet. The nitrogen load stays at 100, so the low-oxygen zone and the grass stay as they are.
In this sketch: costs, cuts and responses are made-up relative units that show the logic, not measurements of any real place. Land limits how much buffers and cover crops can take. Low-oxygen water falls in step with the nitrogen load. Grass starts at 20 and rises 2 for every 1 the load falls, up to 100. Early years show 40% of the final change. Warming and weather are left out.
Rule to keep: less nitrogen feeds fewer algae, so decomposers use less oxygen and more light reaches the grass, and real responses can lag by years.
Read the Bay’s evidence
Ask three questions of the table. Did nutrient pressure fall? Did habitat respond? Did oxygen follow a smooth path?
Predict. If modeled nitrogen load falls, must the modeled hypoxic volume fall in every following year?
| Measure | Year | Value | Units | Kind of number |
|---|---|---|---|---|
| Total yearly hypoxic volume | 2023 | 199 (± 26) | km³·days | model estimate |
| Total yearly hypoxic volume | 2024 | 497 (± 65) | km³·days | model estimate |
| Total yearly hypoxic volume | 2025 | 462 (± 60) | km³·days | model estimate |
| Nitrogen load to the Bay | 2009 | 297.1 | million lb per year | model estimate |
| Nitrogen load to the Bay | 2025 | 252.7 | million lb per year | model estimate |
| Nitrogen goal | goal in the 2026 progress release | 219.5 | million lb per year | target, not a measurement |
| Underwater grass, areas mapped in both years | 2024 | 76,835 | acres | aerial mapping |
| Underwater grass, areas mapped in both years | 2025 | 82,968 | acres | aerial mapping |
| Lafayette River restored reefs beating oyster targets | 2022 | 2 of 3 | reefs surveyed | field survey |
Hypoxic volumes come from the Virginia Institute of Marine Science Chesapeake Bay Environmental Forecast System historical table, read in October 2026. They are whole-Bay model estimates of water below 2 mg/L added up day by day. One km³·day is one cubic kilometer of hypoxic water lasting one day. A separate VIMS recent-years table gives different values for the same years, so compare only numbers from one table.
Nitrogen numbers come from the Chesapeake Bay Program’s 2026 progress release. Its model of the whole watershed estimates what the practices do under average weather. It does not report the nitrogen rivers carried in one wet or dry year. Grass areas come from the VIMS 2025 preliminary survey. Reef results come from NOAA Fisheries’ report of VIMS monitoring.
Check the prediction
No. River flow, temperature and wind vary, so yearly oxygen estimates can bounce even while nutrient pressure falls. Two years are too few to judge a trend or test a cleanup.
- How much did the modeled nitrogen load fall from 2009 to 2025? What percent of the 2009 load is that, and how much more must it fall to reach the goal?
- Nitrogen loads fell, yet 2024’s hypoxic volume was about two and a half times 2023’s. Name two other things that could explain this.
- Why compare grass only in areas mapped in both years?
Claim, evidence, reasoning
Make a claim that answers the essential question: how do human actions change the Bay, and can we do anything about it? Use this data.
Start with: The data show that people blank the Bay, and that blank.
Start with: Modeled nitrogen loads fell from blank to blank million pounds per year, underwater grass in matched areas went from blank to blank acres, and blank of 3 surveyed reefs beat their targets.
Start with: Less nitrogen feeds blank algae, so decomposers use up blank oxygen and more light reaches blank.
Compare with a model answer
The data show that people change the Bay and that cutting pollution can help it recover. Modeled nitrogen loads fell from 297.1 million pounds per year in 2009 to 252.7 in 2025, about 15 percent. In areas mapped in both years, underwater grass grew from 76,835 acres in 2024 to 82,968 in 2025, and 2 of 3 surveyed Lafayette River reefs beat their oyster targets. Less nitrogen feeds fewer algae, so decomposers use less oxygen and more light reaches the grass. One limit: hypoxic volume rose from 2023 to 2024, so three years of model estimates cannot show a trend, and one year of grass data cannot prove what caused the gain.
Saved in this browser only.
Design problem: test a buffer
Does a strip of plants between a field and a stream reduce the nitrogen in runoff? Plan a fair test with trays of soil, and say how you would refine it if the result is unclear.
Predict. Buffer and control runoff have the same nitrate concentration, but the buffer tray makes less runoff. Did the buffer reduce the nitrate leaving the tray?
Check your prediction
Yes. The nitrate leaving equals concentration times runoff volume, so the same mg/L in less water means less nitrate left the tray.
One way to do it
Set up six identical trays of the same soil, tilted to the same angle. Three get a strip of grass sod at the low end, the buffer. Three stay bare, the control.
- Independent variable: buffer strip or no buffer strip.
- Dependent variables: nitrate in the runoff, measured in mg/L with aquarium test strips, and runoff volume.
- Constants: soil, slope, the amount of dilute plant fertilizer containing nitrate (check the label) on each tray, the water poured and the waiting time.
- Repeated trials: three trays of each kind, repeated on a second day. Compare means.
- Safety: wear gloves and goggles, never taste the water, wash your hands, and dispose of runoff as your teacher directs.
Lower mean nitrate and runoff from buffer trays on both days supports the buffer. If results overlap, widen the strip, add trays or try another plant. Trays are a model, not a stream; they test only water flowing over the surface. A real buffer also works underground, and it has a constraint: the farmland it takes.
Going deeper
A law, a model and a distant disturbance
In 2010, the U.S. Environmental Protection Agency set a limit on nitrogen, phosphorus and sediment entering the Bay: the Chesapeake Bay TMDL, or total maximum daily load. Each state wrote a Watershed Implementation Plan for its share.
In one computer-model study of the Bay, warming cancelled roughly 6 to 34 percent of the oxygen gain from cutting nitrogen. The story “A Bay that never happened,” under Stories & asides, tells what else that study found.
Natural disturbances can also arrive from far away. The 2002 Denali Fault earthquake in Alaska sloshed a Nevada desert pool and disturbed spawning areas of the Devils Hole pupfish.
Check your thinking
The one idea again: extra nutrients feed algae; bacteria use oxygen while poor mixing limits replacement; effective fixes cut nutrients first, rebuild habitat, and track recovery over time. Judge them over years, because weather makes single years bounce.
Science practices you used: asking a question about a Virginia problem, planning a fair test with a control and repeated trials, reading a data table and calculating a percent change, using a model and naming its limits, and making a claim from evidence.
Your notes
Select any text in the lesson to highlight it or add a note to it. Your highlights and notes are saved in this browser and collected in your notebook.
This browser is not letting the site save anything (a private window or strict privacy settings), so highlights and notes will be lost when you leave the page.
How we measure it
Dissolved-oxygen profiling
A sensor lowered on a cable reads dissolved oxygen, temperature and salinity at each depth. Readings repeated at many places and dates show where and when bottom water runs low on oxygen, and they are used to check computer models of the Bay.
Aerial and satellite mapping of underwater grass
Pictures taken from aircraft and satellites show where beds of underwater grass grow, and the area of each bed is measured from the images. Comparing only areas mapped in both years keeps a gap in the pictures from looking like lost grass.
Stream gauging with water sampling
A stream gauge measures how much water flows past a point, and water samples measure how much nitrogen each liter carries. Together they give a load, the total amount of nitrogen a river delivers over a year.
Where this lesson fits
Before thisReview first
- Matter CyclesThis course · Lesson 31
You need how nitrogen and other matter move from land to water to follow nutrients into the Bay.
- Respiration and ATPThis course · Lesson 5
Bacteria use oxygen to break down dead algae, which is the respiration idea behind low-oxygen water.
- Populations and Carrying CapacityThis course · Lesson 29
The Bay's blue crab numbers and limits help you see how conditions cap how much life a place supports.
Elsewhere on the siteFilms, simulations and method films in other courses
- Extra Nutrients, Less Deep OxygenFilm · Life Science
It shows the same chain of extra nutrients, algae bloom and low deep-water oxygen.
- Ecosystem mass and energy budgetsMethod film
This lesson's watershed model tracks nitrogen inputs and outputs, which is how ecosystem budgets work.
Suggested by an AI model from the lessons themselves, then checked. How we use AI
Finish line
Test yourself
8 questions
Practice and MCAT-style, with explained answers.
That's the last lesson · Next course
Organismal Biology
How animals and plants are built and how their organs keep them alive.
Start the next course →Before you move on: review the questions you missed , or go back to all lessons in this course.