Biology · Skim version
Populations and Carrying Capacity
Read the full lesson → Skim the whole course →
The guiding idea
Why can the number of blue crabs in the Chesapeake Bay change by more than 100 million from one winter to the next?
Limits slow population growth near carrying capacity, and lasting changes in resources or conditions can move carrying capacity.
From the film: Why Growth Bends
- Limits slow population growth near carrying capacity.
- A population is one species living in the same area at the same time.
- Exponential growth increases a population by the same fraction each step while resources are plentiful.
- Carrying capacity is the largest population an environment can support over time with its resources and challenges.
From the film: Did the Limit Move?
- Lasting changes in resources or conditions can move carrying capacity.
- A brief freeze that leaves food, space and shelter unchanged lowers population size, not carrying capacity.
- A population count alone cannot reveal carrying capacity or identify a cause.
- The winter survey estimates crab abundance; it does not measure carrying capacity.
-
Explore: grow a population, then add limits
-
Explain: who lives together and what holds them back
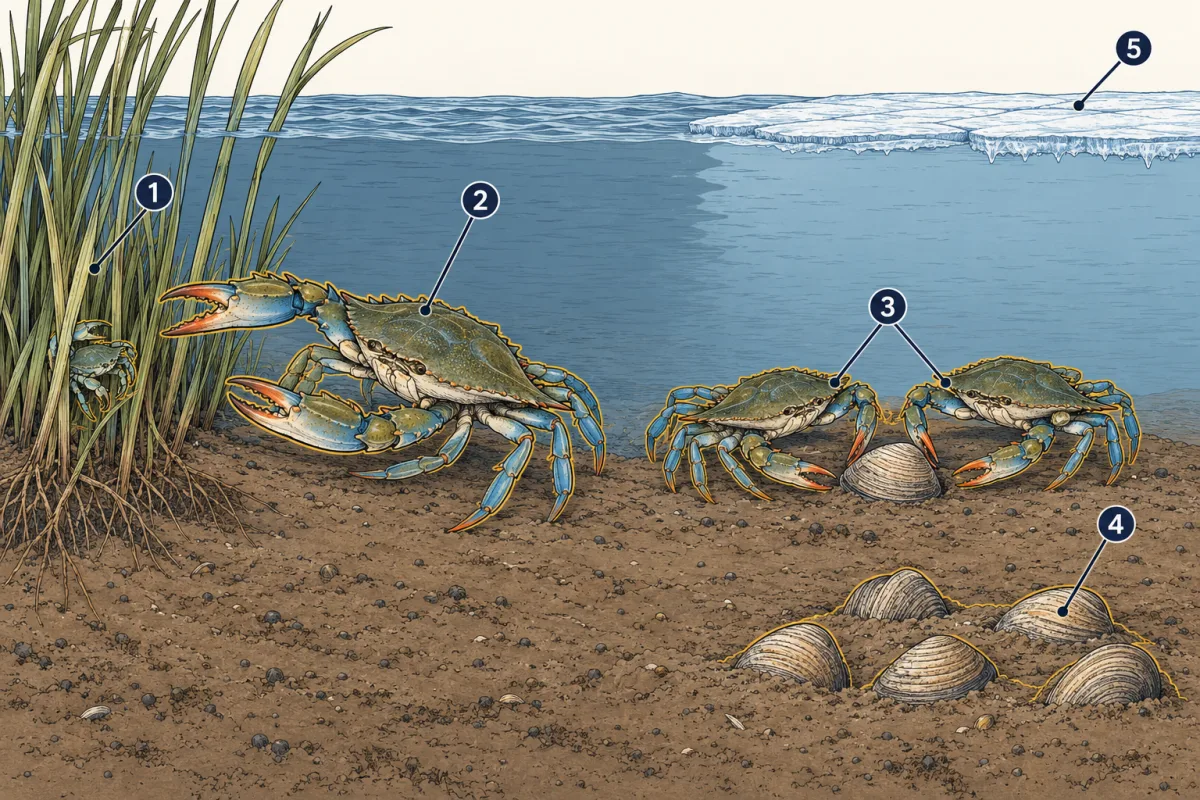
- hiding places
- predators
- competitors
- food
- cold water
-
Explain: J-shaped and S-shaped growth
-
Explain: which limits change with crowding
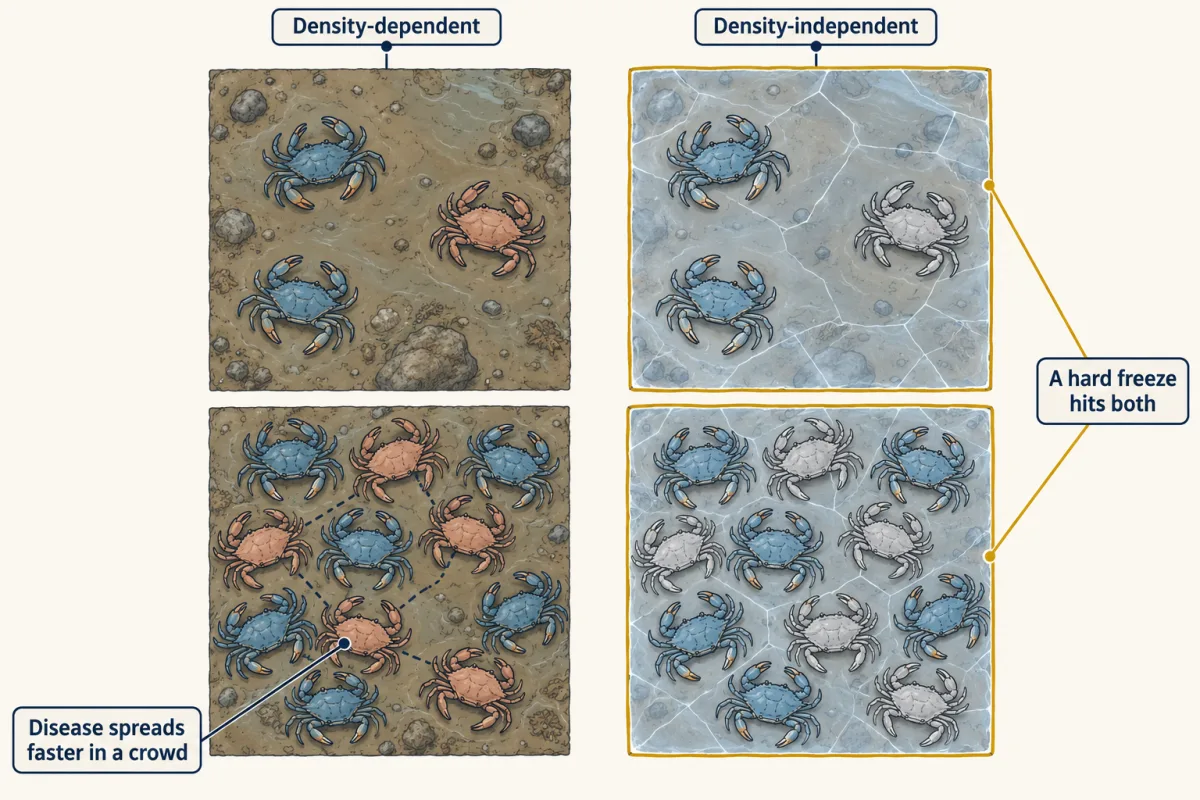
A sketch, not data: disease hits a crowded population harder, while a hard freeze hits a sparse and a crowded population alike. AI-generated illustration -
Explain: carrying capacity can move
-
Elaborate: read the crab survey
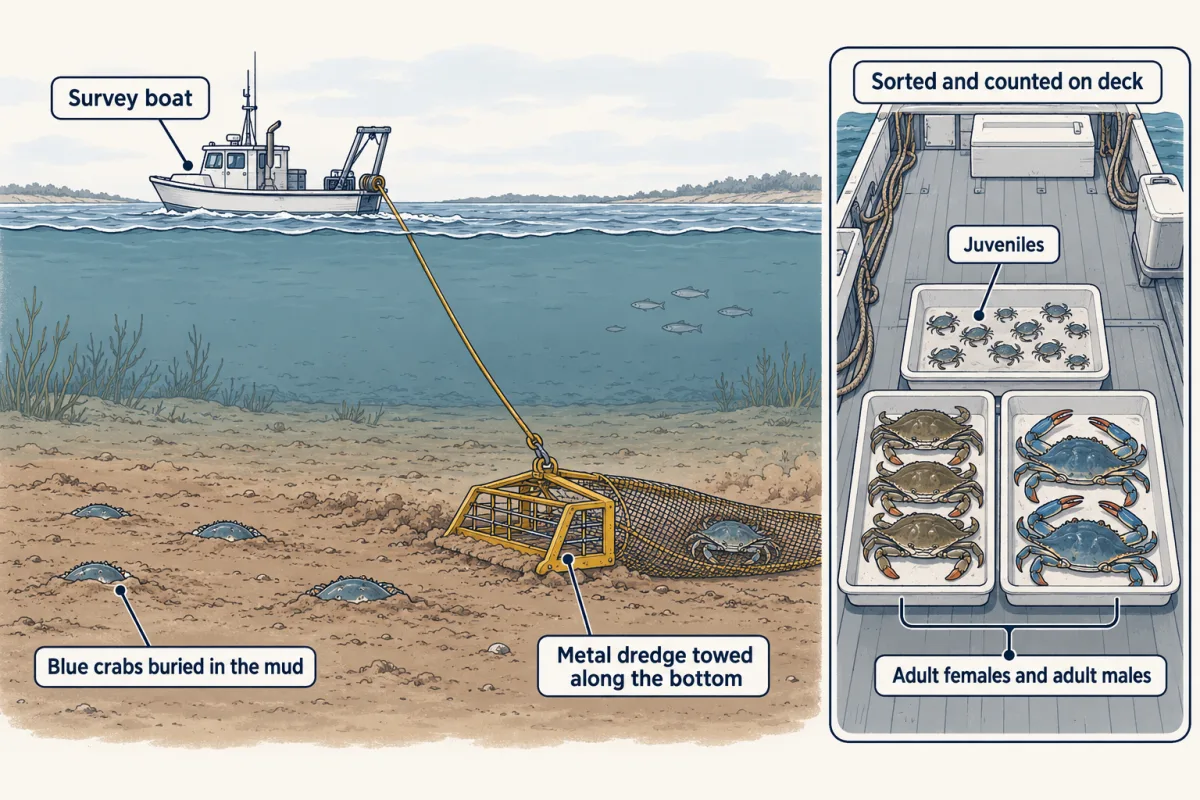
The winter dredge survey turns samples of buried crabs into Bay-wide abundance estimates, not exact counts or measurements of carrying capacity. AI-generated illustration -
Evaluate: check your thinking
-
Going deeper
Where this lesson fits
Before thisReview first
- Homeostasis in ActionThis course · Lesson 9
You need the idea of feedback holding a system steady to understand why a population levels off near carrying capacity.
After thisStudy next
- Energy in EcosystemsThis course · Lesson 30
Food supply is a main limit on carrying capacity, and this lesson shows how much energy reaches each level.
- The Chesapeake Under PressureThis course · Lesson 33
It applies the idea of lasting changes moving carrying capacity to real pressures on the Bay's crabs and fish.
- Succession in VirginiaThis course · Lesson 32
It shows how a lasting change in conditions reshapes which populations an area can support over time.
Elsewhere on the siteFilms, simulations and method films in other courses
- Run a crab cove for ten yearsSimulation · Life Science
You can run a model crab cove and see how additions and losses change a population over ten years.
- Four Ways a Population ChangesFilm · Life Science
It shows how births, deaths and movement raise or lower a population count.
Suggested by an AI model from the lessons themselves, then checked. How we use AI