Ecology and Evolution · Skim version
Predation and Community Effects
Read the full lesson → Skim the whole course →
The guiding idea
If predators eat prey, why do predator numbers keep climbing after the prey have started to fall?
Every kill is entered in two ledgers, a death for the prey and food that, on average, predators turn into births, so each population's per capita growth rate is set by the other's numbers, and a predator can affect species it rarely or never eats, and can even help some species it also eats.
From the film: Two Ledgers, One Kill
- Each kill is a death for the prey and food that, on average, predators turn into births, so each population's per capita growth rate is set by the other's numbers.
- Prey increase while predators are fewer than P* = r/a; predators increase while prey are more than N* = m/(ea).
- Predators keep rising after prey have peaked, so predator peaks come after prey peaks, though the model builds in no delay.
- In the classical Lotka-Volterra model each start with both populations present and away from the equilibrium keeps its own closed loop, so the start sets the size of the cycle.
From the film: Fifteen to Eight
- Paine kept the sea star Pisaster ochraceus off one patch of shore at Mukkaw Bay, Washington, beside an untouched control.
- Without Pisaster, mussels, the strongest competitors for space on the rock, spread, and the species holding space on the rock fell from 15 to 8.
- Pisaster's effects ran through the mussels it ate to the species they compete with: it kept space open, including for some species it also ate.
- A keystone species has an effect on its community that is large relative to its abundance.
- This was one removal patch and one control: a strong local result, not yet a general law.
-
Two ledgers, written as equations
-
What the classical cycle leaves out
-
What one shore can and cannot show
-
Cascades through killing and through fear
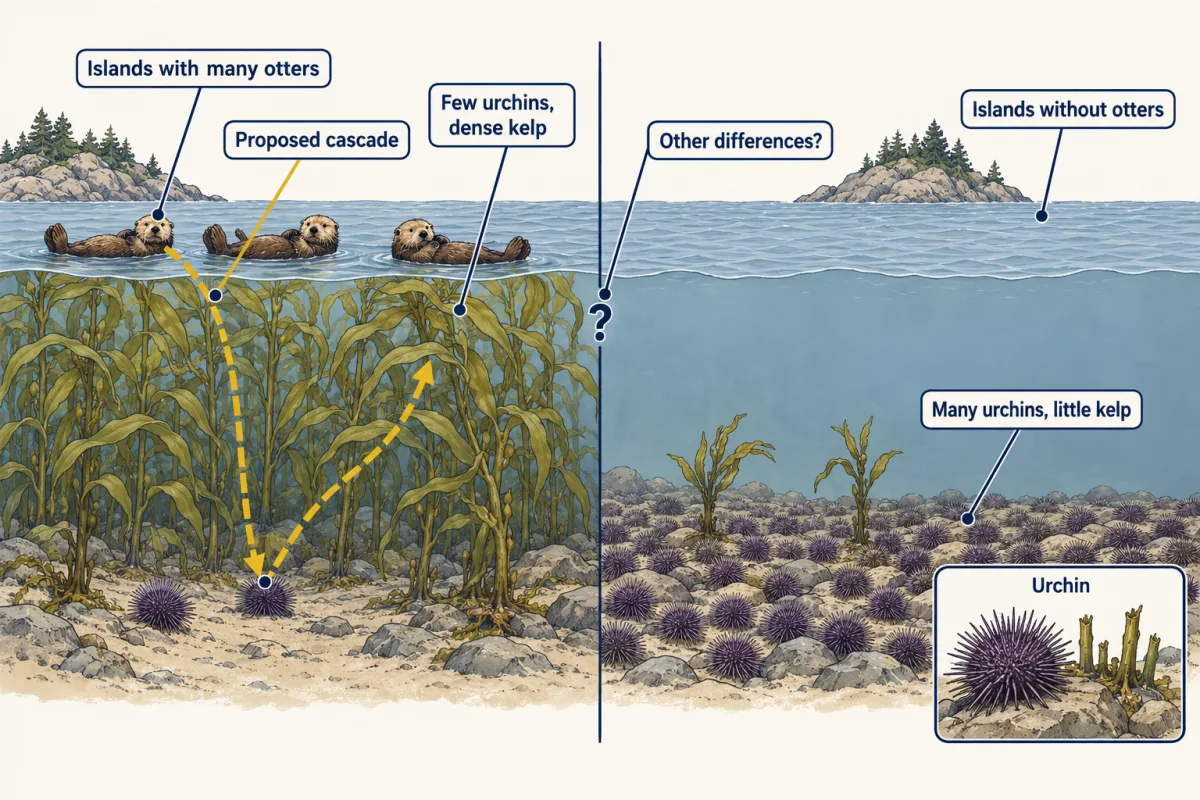
Amchitka, with many otters, had few urchins and dense kelp; Shemya, without otters, had many urchins and little kelp. No one removed otters, so the contrast fits a cascade but leaves room for other differences between the islands. AI-generated illustration 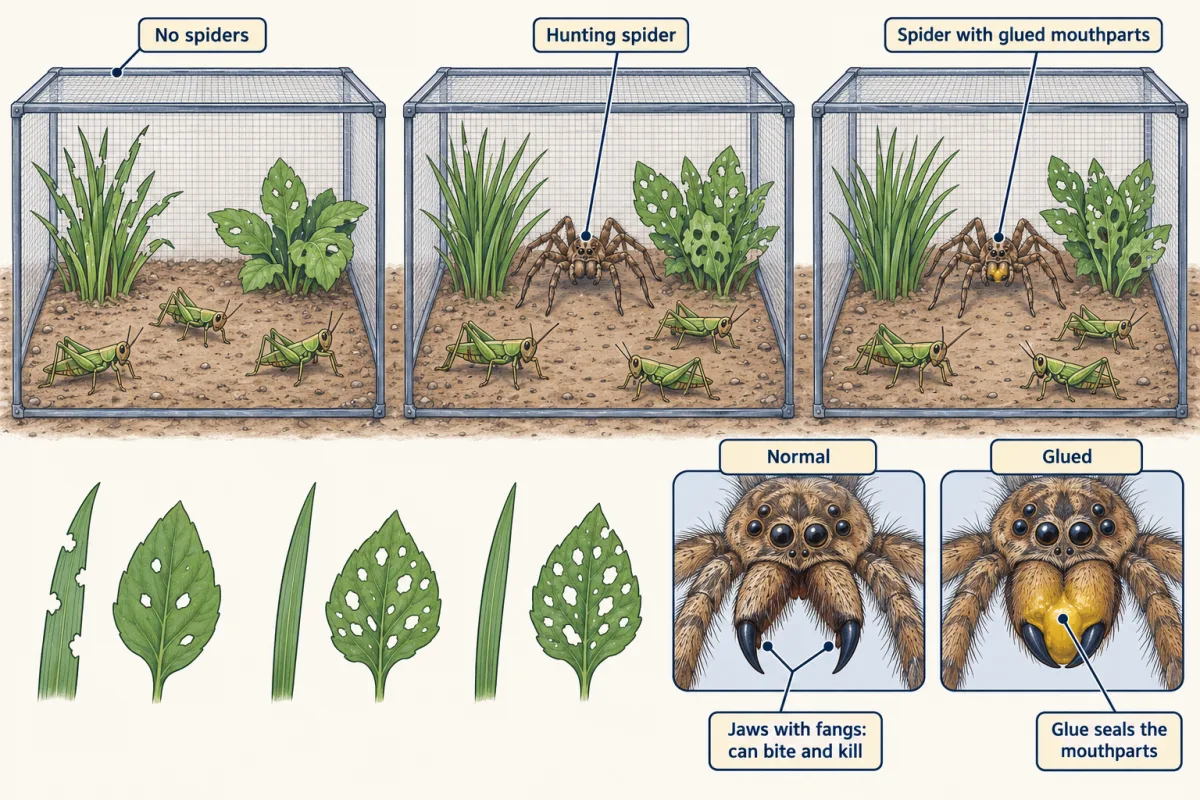
Spiders with glued mouthparts could be sensed but could not kill, yet with either kind of spider grasses were damaged less and herbs more, while grasshopper densities did not differ significantly: a cascade carried by risk, not deaths. AI-generated illustration -
How far one system generalizes
-
Going deeper
Where this lesson fits
Before thisReview first
- Population Growth and RegulationThis course · Lesson 14
The prey's exponential growth rate r and the idea of per capita rates come from there.
- CompetitionThis course · Lesson 16
Paine's result depends on mussels outcompeting other species for space on the rock.
After thisStudy next
- Mutualism, Parasitism and CoevolutionThis course · Lesson 18
It reads the predator-prey phase lag in real data and shows how evolving prey defences reshape cycles.
- Diversity, Disturbance and SuccessionThis course · Lesson 19
A keystone predator changes how many species coexist, which this lesson measures with richness and disturbance.
- Energy Flow and ProductivityThis course · Lesson 21
It takes trophic levels further by tracking how much energy passes from plants to herbivores to predators.
Elsewhere on the siteFilms, simulations and method films in other courses
- Island of wolves and mooseSimulation · Life Science
The island wolf and moose model lets you watch predator and prey numbers rise and fall together.
- Follow the Energy ArrowsFilm · Life Science
It shows how effects of eating pass along food-web arrows, a basis for trophic cascades.
Suggested by an AI model from the lessons themselves, then checked. How we use AI