Life Science · Unit 6: Changing ecosystems
People Change Habitats
Rewritten on : new text, flashcards and film. Your notes and highlights stay, but the text around them may have moved.
People put blue catfish into Virginia rivers for fishing, so what could that mean for the crabs and native fish already living there?
Pause when the reading reaches a film, and offer to play it. Saved on this device.
Watch the film now, or keep listening
Builds on:Food Webs and EnergyCompetition and CooperationPopulations Rise and FallWhy these?
Where this lesson sits
- Virginia SOL LS.9 a
- Virginia SOL LS.9 b
- Practices LS.1 c, LS.1 d, LS.1 e, LS.1 f
Essential question: What happens to a river when people bring in a big new fish?
-
Life Science (grade 7) LS.9 a, LS.9 b You are here
This lesson
-
Biology
Preview it at high school level
In Biology you follow one human impact step by step: how extra nitrogen and phosphorus from farms, lawns and wastewater feed algae, and how bacteria breaking down the dead algae use up oxygen in deep Bay water. You read real Chesapeake Bay numbers for nitrogen, low oxygen and underwater grass. Then you treat the problem as a design challenge. You choose fixes such as forest buffers along streams, cover crops on fields, better wastewater plants and oyster reefs. A good fix must meet goals within limits of money, land and time, and you learn to judge one plan against another.
-
Biology II Biology II: Ecology, EC.2 d and f, EC.7 c; Advanced Topics, BIOII.6 f
Preview where it goes next
Virginia's Biology II: Ecology course lists the threats people pose to biodiversity and pairs each one with a way to fix it. It adds the laws and agreements that protect species, such as the Endangered Species Act, and has you survey the living things in a local area. It also studies an invasive species in a local ecosystem in more depth. The Advanced Topics course asks how biodiversity helps an ecosystem resist a disturbance or bounce back from it.
-
College
 ▶ Watch One Change, Many Ripples · 3:22
Read the transcript of “One Change, Many Ripples”
Film transcript: One Change, Many Ripples
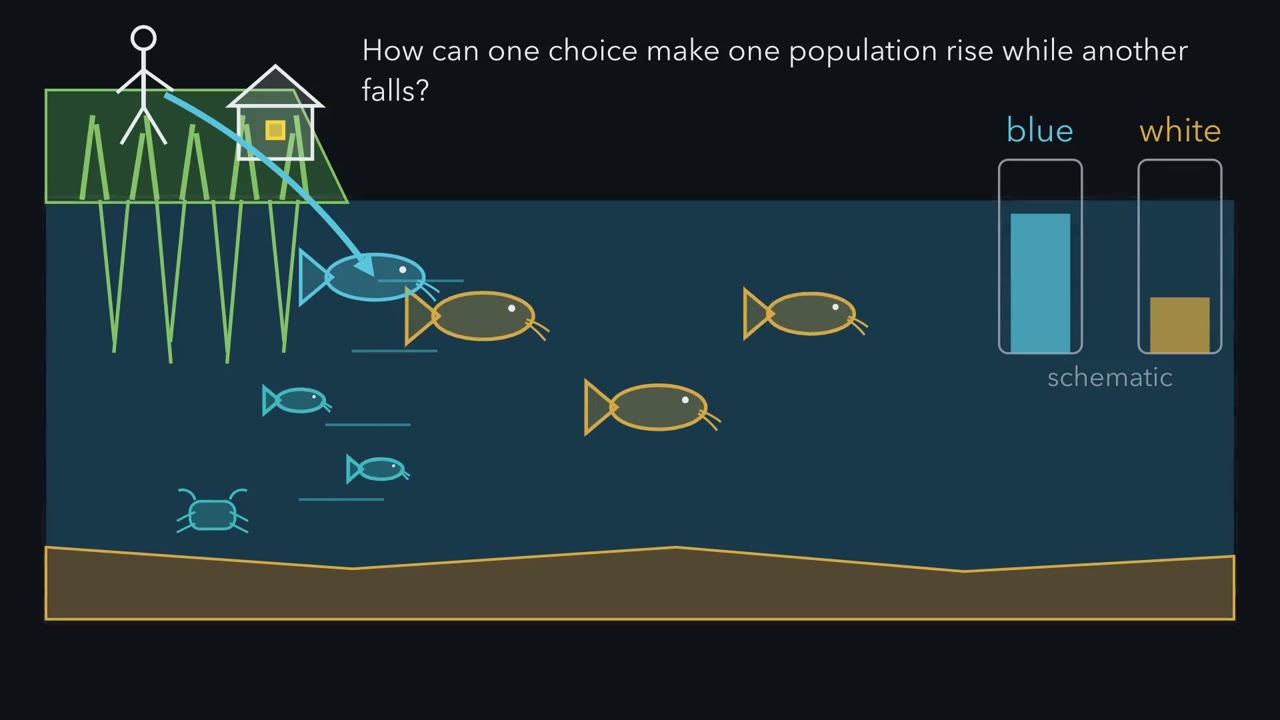
How can one human choice make one river population rise while another falls? Watch one Virginia river as people change who lives there and what each population can use. Start with one river edge. Green marsh plants provide habitat along the bank. Teal crabs and small fish move below. Gold white catfish are native here. All the white catfish in this river form one population. The shoreline shelters animals while the moving water carries food. People belong inside this ecosystem, too. They depend on it for food, water, energy and other resources. Their choices can change habitat, available resources, or which species are present. A habitat is where an organism finds the food, water and shelter it needs.
Now people release blue catfish, shown in blue. These fish came from waters outside Virginia's Bay rivers. Here they spread and cause harm, so they are invasive, not merely new. Being new is not enough. Blue catfish eat plants and animals, including fish and sometimes blue crabs.
Scientists report that white catfish eat similar prey. When species need the same limited resource, they may compete, even without a fight. One fish can simply eat food another fish needed. Both catfish now use the teal prey pool. If the blue population grows, what do you predict happens to the food remaining for white catfish?
More blue catfish feed, and the shared prey pool may shrink. Less food may remain for white catfish. That is a possible competition pathway, not proof of what caused a real population change. Other habitat changes may matter at the same time. People also fill part of the green marsh for homes.
Habitat disappears, so some animals must move or die. Runoff enters the water, and extra fertilizer can later lower oxygen. Both changes may affect several local populations. Watch the whole river, not one arrow. Blue catfish rise.
Shared prey and shoreline habitat change. Crabs, small fish and white catfish may respond differently because food-web effects spread. A change can reach species people catch and eat. Human actions can help, too. People can restore habitat or remove some invasive fish. How far each population recovers is a question to test. A model lets us change one thing at a time. Here is the rule to carry forward. When people change an ecosystem, populations may rise or fall. The rule guides predictions, but evidence must show what changed in a real river.
From the film
- When people change an ecosystem, populations may rise or fall.
- A habitat is where an organism lives and finds the food, water and shelter it needs.
- Species may compete when they need the same limited resource, even without a fight.
- An invasive species is brought to a new place, spreads and causes harm; being new is not enough.
In the 1970s and 1980s, people put blue catfish into Virginia’s James, Rappahannock and York river systems. Today these big fish are common in parts of those rivers.
Blue catfish are native to the Mississippi River basin and other waters outside Virginia’s Bay rivers. People stocked them here to give anglers big fish to catch. Their numbers grew fast in the 1990s. What could this new fish mean for the crabs, small fish and native catfish already living there?
The one idea to carry through this lesson. When people change an ecosystem, populations may rise or fall. Use this rule for changes in land, resources, pollution, introduced species or restoration. It does not predict which population will change or prove what caused a survey pattern.
What do you think? Decide before you read.
-
Scientists disagree: People are part of ecosystems and depend on them for food, water and energy. When people clear land, pollute water or bring in a new species, populations may change. People can also help by restoring habitats.
What scientists think
Scientists disagree: People are part of ecosystems and depend on them for food, water and energy. When people clear land, pollute water or bring in a new species, populations may change. People can also help by restoring habitats.
-
Scientists disagree: Rain carries fertilizer from farms and lawns into rivers, and fishing removes fish. People also carried blue catfish into Virginia rivers.
What scientists think
Scientists disagree: Rain carries fertilizer from farms and lawns into rivers, and fishing removes fish. People also carried blue catfish into Virginia rivers.
-
Scientists disagree: Competition can happen without a fight. If one species eats food that another species needs, less is left. Scientists report that blue catfish and native white catfish eat similar prey, so they may compete for it.
What scientists think
Scientists disagree: Competition can happen without a fight. If one species eats food that another species needs, less is left. Scientists report that blue catfish and native white catfish eat similar prey, so they may compete for it.
Explore: test a model river
Test the first film’s pathway: more blue catfish, less shared prey, less food for white catfish. The model river’s bars use relative units, not measurements.
In this sketch, nothing has changed, so every bar stays on its dashed line.
Made up for this sketch, in relative units, not measurements: a few and many releases, the food supply, the share of blue catfish fished each year, and how much each kind loses to habitat loss or to being eaten. In this sketch, blue catfish are made to use the shared food slightly better; the lesson does not say why they spread. Catfish are not changed by lost habitat, and the food bar does not change with habitat loss. Small fish losing habitat is an assumption of this sketch. In this sketch, blue catfish are made to take more small fish than crabs. Four species, the same food every year, no seasons, no random scatter. Not to scale.
Rule to keep: when two species use the same limited food, more of one leaves less for the other, and people can raise or lower a population by what they do to its habitat and its competitors.
Predict 1. Release many blue catfish. Will the white catfish bar fall, hold steady or rise? Does the model follow the film’s pathway?
Predict 2. Keep the blue catfish and also take away half the shoreline habitat. Will crabs and small fish fall further than with blue catfish alone?
Predict 3. Will heavy fishing for blue catfish bring the other bars back all the way, partway or not at all? Play 20 years and check.
A model shows possible effects, not what caused a change in a real river.
Explain: follow the change
- habitat
- population
- land use
- habitat destruction
- pollution
- native species
- invasive species
- competition
- A habitat is where an organism lives and finds the food, water and shelter it needs (more on habitats). A population is every member of one species in one area at one time.
- Land use means how people use land: for farms, homes, roads or forest. Rain can carry fertilizer and manure from farm fields into streams.
- Taking wood, coal, fish or gravel changes an ecosystem. Digging gravel out of a stream changes the streambed.
- Habitat destruction removes or ruins habitat, such as filling a marsh. Animals there must move or die, so local populations often drop.
- Pollution is harmful material added to air, water or soil. Extra fertilizer can feed fast algae growth. Later, the water can run low on oxygen (follow the steps).
Habitat destruction, pollution and invasive species are three ways people disrupt ecosystems. A food web links species by who eats whom (food webs), so one change can spread: some populations go up, and others go down.
People and ecosystems also affect each other through climate, water supply, air quality, energy production, ocean acidification and waste management. Ocean acidification means ocean water becomes more acidic as it takes in carbon dioxide from the air.
Human effects are not always negative. In Virginia’s coastal bays, people spread eelgrass seeds. A 2020 study reported that underwater grass returned and the total mass of fish rose (Helping Ecosystems Recover).
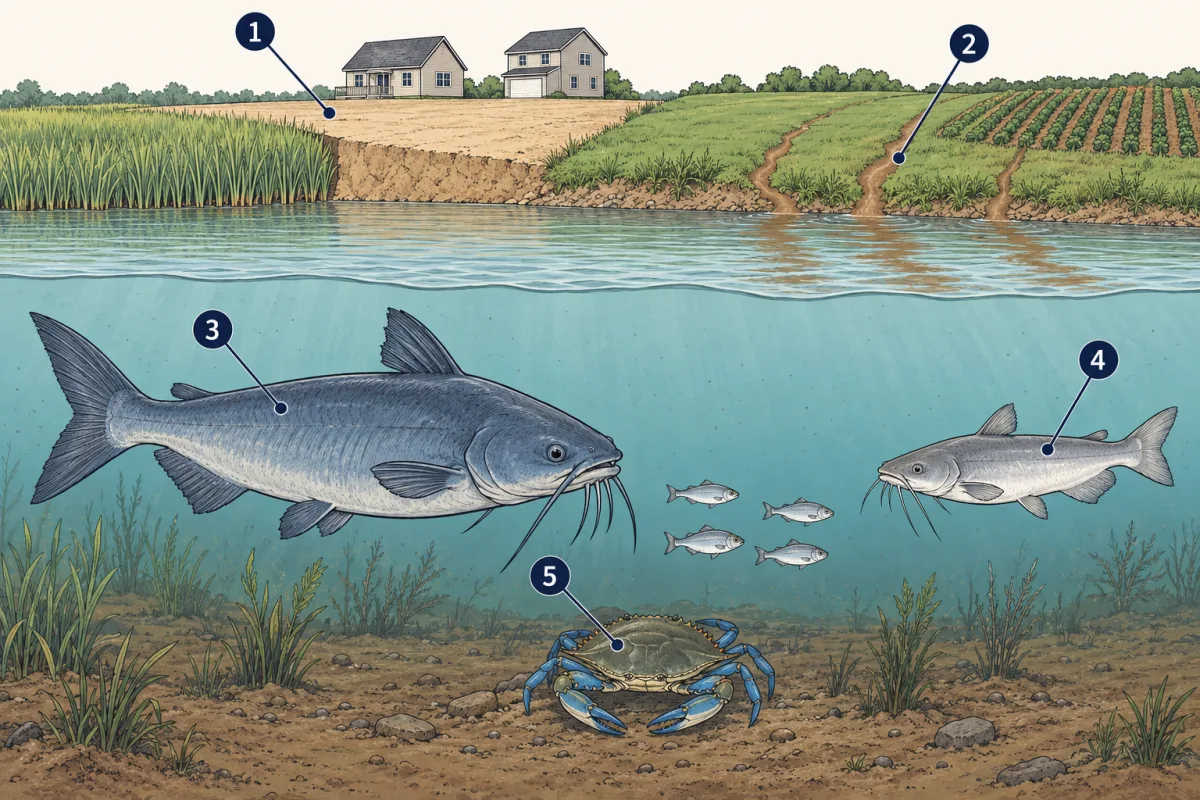
- habitat destruction
- pollution
- blue catfish
- white catfish
- blue crab
- blank
- blank
- blue catfish
- blank
- blue crab
Word bank: habitat destruction, pollution, white catfish
- blank
- blank
- blank
- blank
- blank
Check your labels
- habitat destruction
- pollution
- blue catfish
- white catfish
- blue crab
Explain: a new fish and shared food
A native species lives in a place naturally, without people bringing it. An invasive species is brought to a new place, spreads and causes harm to native species or people; being new is not enough.
| Blue catfish | White catfish | |
|---|---|---|
| Native to Virginia’s Bay rivers? | No (Mississippi River basin and other waters) | Yes |
| How it got here | People stocked it: James and Rappahannock in the 1970s, York River system in 1985 | Already here |
| What it eats | Plants and animals, including fish and sometimes blue crabs | Prey similar to what blue catfish eat |
Blue catfish can grow about as long as many adults are tall.
The first film showed competition: species need the same limited resource, such as food or space (more on competition). No fight is required. Scientists report that the two catfish eat similar prey, so they may compete.
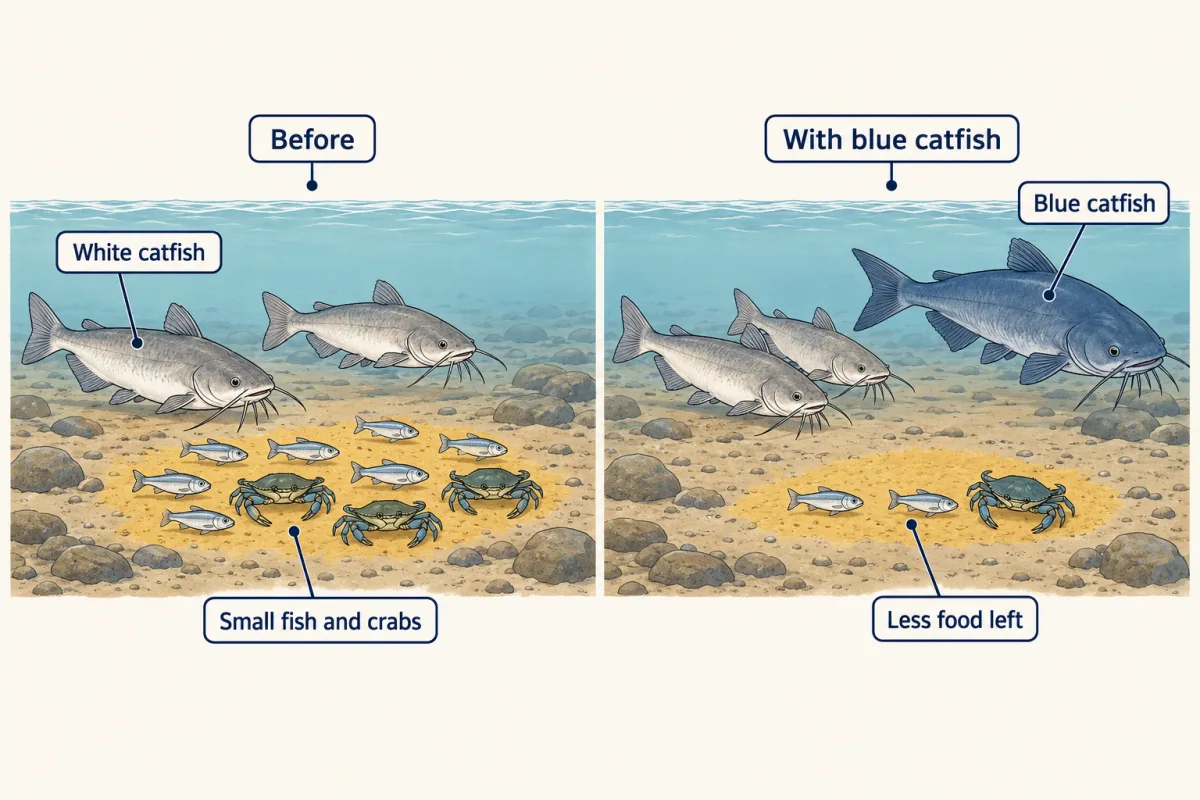
Shared food is like pizza at a party: a new guest can leave less for others. Unlike pizza, river prey reproduce, move and change with the seasons.
If blue catfish eat many blue crabs, fewer may remain for other crab eaters, including people.
- Blue catfish are invasive in Virginia because blank.
- Blue catfish and white catfish may compete because blank.
- If blue catfish eat many crabs, then blank.
Competition is a possible explanation, not an observation. Checking whether real catfish populations changed takes years of river records.
Read the transcript of “Reading the River's Record”
Film transcript: Reading the River's Record
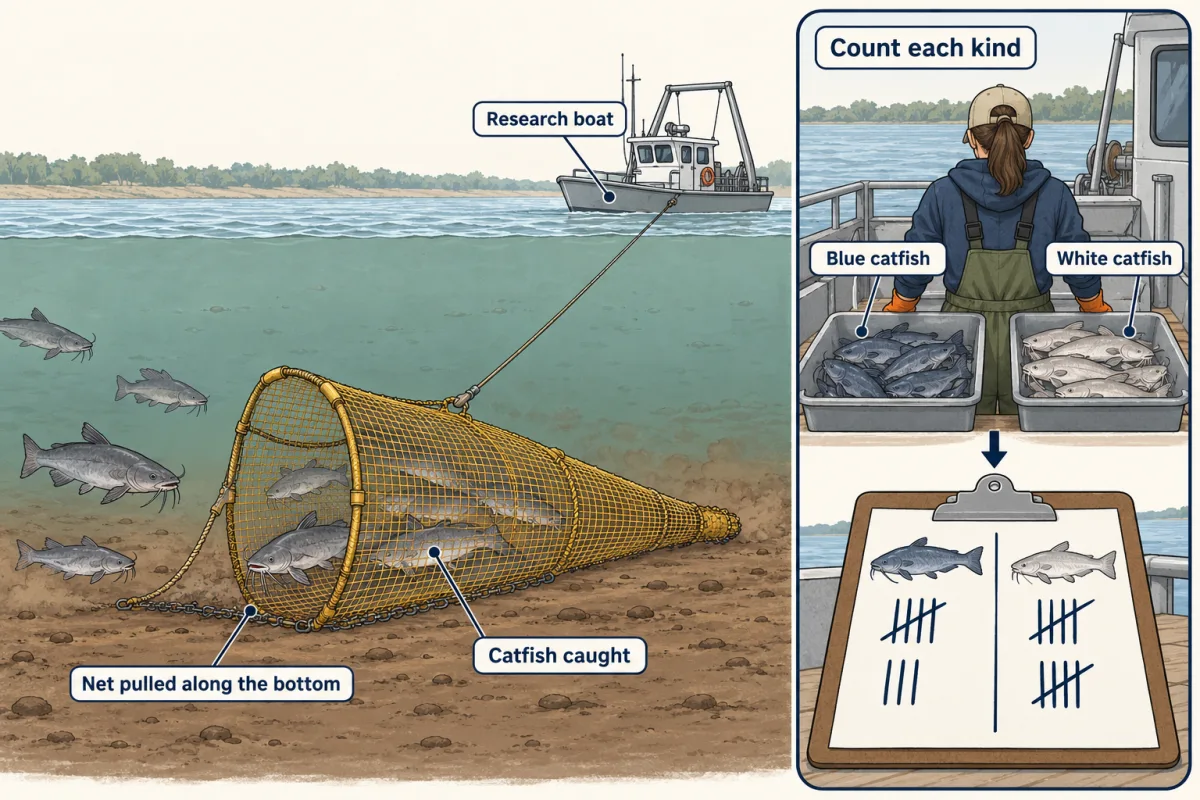
The first film followed ripples through one model river. How can scientists tell whether real blue and white catfish populations changed? They need the river's record, not one visit. Murky water hides fish from view. Scientists from the Virginia Institute of Marine Science repeat bottom tows at many places. A boat pulls the same kind of net for a set time. The catch is sorted and counted. Repeating the method makes years more useful to compare. Those counts become a survey index for each fish. An index tracks how common that fish is in the surveyed area. It is not a count of every fish in the river. Think of it as a consistent signal from repeated samples.
Keep blue catfish blue and white catfish gold, matching the first film. Build a separate trace for each fish across time. The two indexes use different math and river areas. Their heights cannot be compared directly with each other. Now the full traces grow from left to right. The blue index rises from early zero catches, though it jumps between years. The white index is lower after its early high values. Each dot is one year inside a longer pattern. One blue point towers above nearby years. Should that single point settle the story, or should scientists use the full series? Make your prediction.
Use the full series. One year can be unusually high or low. A zero also means none were caught in that survey, not that none lived anywhere in the river. The other years keep one point in context. Compare each fish with itself across time. The blue index became higher, while the white index stayed below its early high values. That opposite pattern shows that the surveyed river community changed. An index tracks change; it does not count every fish. But a survey shows a pattern, not its cause.
Shared prey makes competition one possible explanation. Pollution, habitat loss or other changes could also have affected white catfish. The graph alone cannot choose among those possibilities. A careful claim has three parts. State the pattern, point to values from the same years, then explain a possible link. Keep may in the reasoning because the cause remains uncertain. That small word keeps the evidence honest. The survey adds evidence to our river picture. When people change an ecosystem, populations may rise or fall.
Evidence shows the pattern; further tests are needed to identify causes. Good science protects that line between observation and explanation.
From the film
- When people change an ecosystem, populations may rise or fall.
- A survey index tracks how common a fish is in the surveyed area; it is not a count of every fish.
- Compare each fish with itself over time, because the two indexes use different math and river areas.
- A survey shows a pattern, not its cause; competition is one possible explanation.
Elaborate: read the James River surveys
In the second film, repeated bottom tows by the Virginia Institute of Marine Science (VIMS) became a survey index. It tracks how common a fish is in the surveyed area from year to year. It is not a count of every fish. The film left the numbers and the cause to you.
| Year | Blue catfish survey index | White catfish survey index |
|---|---|---|
| 1988 | 0.00 | 0.20 |
| 1990 | 0.00 | 1.83 |
| 1995 | 8.97 | 1.31 |
| 2000 | 17.44 | 0.05 |
| 2005 | 47.07 | 0.15 |
| 2010 | 16.45 | 0.41 |
| 2015 | 58.84 | 0.20 |
| 2019 | 317.77 | 0.23 |
| 2020 | 47.74 | 0.32 |
| 2022 | 54.42 | 0.16 |
Source: VIMS trawl survey of the James River, September to November tows, older fish (age 1 and up, judged by length); Tuckey and Fabrizio, 2023 annual report, Tables 9 and 19.
Compare each fish only with itself, because the two indexes use different math and river areas. Three more cautions. Values from 2015 on were adjusted for a new boat and net. The years are not evenly spaced. And the white index was 0.06 in 1994 but 1.31 in 1995, so the size of a drop depends on which years you pick.
Worked comparison: the blue index went from 8.97 in 1995 to 54.42 in 2022.
later index ÷ earlier index = 54.42 ÷ 8.97 ≈ 6.1
So the 2022 blue index was about six times the 1995 index. That is a pattern, not its cause.
Predict 4. The white index changed from 1.31 to 0.16. Will the percent drop be closer to 10, 50 or 90 percent? Then calculate: subtract, divide by 1.31 and multiply by 100.
- In which year does the blue index first rise above zero? Describe its pattern after that.
- Find the mean of the ten white index values.
- Find the mean of the blue values with and without 2019. How much does one year move it?
Claim, evidence, reasoning
Make a claim that answers the question: what happens to a river when people bring in a big new fish? Use the table.
Start with: The data show that as blue catfish became blank, native white catfish became blank.
Start with: In 1995 the blue catfish index was blank and the white catfish index was blank. In 2022 they were blank and blank.
Start with: Blue catfish and white catfish eat similar blank, so more blue catfish may leave less blank for white catfish.
Compare with a model answer
As blue catfish became more common in the James River, native white catfish became rarer. In 1995 the blue catfish index was 8.97 and the white catfish index was 1.31. In 2022 they were 54.42 and 0.16. The two catfish eat similar prey, so more blue catfish may leave less food for white catfish. One limit: these surveys show a pattern, not its cause. Something else, such as pollution or habitat loss, could also have lowered the white catfish.
Saved in this browser only.
Design problem
A town plans homes beside a creek. Some people want lawns to the water. Others want a strip of plants along the bank as habitat. Plan a test with soil trays: does a plant strip keep soil out of the creek?
Predict 5. Which tray should release less soil: bare soil or soil with a plant strip? What result would change your mind?
Saved in this browser only.
One way to do it
- Question: Does a strip of grass at the low end of a soil tray reduce soil washed off by rain?
- Independent variable: a grass-sod strip 10 cm wide at the low end, or bare soil.
- Dependent variable: the runoff soil mass, in grams, after the water dries in a pan.
- Control: bare-soil trays with no grass strip.
- Constants: the same soil, tray size, tilt, and 1 liter of water poured from the same watering can for 1 minute.
- Repeated trials: three trays of each kind; find each mean.
- Safety: wear gloves, wipe spills so no one slips, and wash your hands.
- Meaning: less soil from grass trays supports keeping plants along the bank. A tray is a model, not a real creek.
Evaluate: check your thinking
When people change an ecosystem, populations may rise or fall. In the James River surveys, blue catfish became more common while native white catfish became rarer. Similar prey makes competition possible, even without a fight, but the survey shows a pattern, not its cause. Land use, habitat destruction and pollution can also change populations, and restoration can help.
Science practices you used: reading a graph and table, finding a mean, comparing change over time, testing a model and naming its limits, planning a fair test, and making a claim from evidence.
Going deeper
How the catfish survey is done
Each bottom tow lasts five minutes and is made in daytime, from September to November.
Eelgrass restoration in numbers
People spread about 74.5 million eelgrass seeds in Virginia’s coastal bays. The 2020 study reported that underwater grass grew back across 3,612 hectares.
The longest blue catfish
The U.S. Geological Survey lists the longest blue catfish at 165 cm.
Your notes
Select any text in the lesson to highlight it or add a note to it. Your highlights and notes are saved in this browser and collected in your notebook.
This browser is not letting the site save anything (a private window or strict privacy settings), so highlights and notes will be lost when you leave the page.
How we measure it
Bottom-trawl fish survey
A boat pulls a net along the river bottom for the same short time at many places, and scientists count the fish caught. The counts become a survey index that shows whether a fish is getting more or less common from year to year.
DNA diet study
Scientists collect bits of DNA from inside a fish's gut and match them to known species. The matches show what kinds of animals and plants the fish ate, even when the food is too broken down to recognize by eye.
Aquarium experiment
Fish are kept in several tanks that differ in one condition, such as how salty the water is. Comparing survival and growth across the tanks shows how that one condition affects the fish.
Where this lesson fits
Before thisReview first
- Food Webs and EnergyThis course · Lesson 12
You need food webs to see how one change in who eats whom spreads to other species.
- Competition and CooperationThis course · Lesson 17
This lesson uses competition for the same limited food, which that lesson teaches first.
- Populations Rise and FallThis course · Lesson 23
You need to know why populations go up and down before judging what people change.
After thisStudy next
- Helping Ecosystems RecoverThis course · Lesson 26
It uses the same rule to show people can help populations recover, as with eelgrass.
- Extinction and SurvivalThis course · Lesson 34
It takes the idea further, showing how an introduced fungus can wipe out a species and its forest.
Suggested by an AI model from the lessons themselves, then checked. How we use AI
Finish line
Test yourself
8 questions
Practice and MCAT-style, with explained answers.
Next · Lesson 26
Helping Ecosystems Recover
How did Virginia go from 33 pairs of nesting bald eagles in 1977 to more than 1,000 in 2016?
Continue →