Life Science · Unit 4: Matter and energy in ecosystems
Food Webs and Energy
Rewritten on : new text, flashcards and film. Your notes and highlights stay, but the text around them may have moved.
If ospreys eat menhaden and menhaden eat plankton, how much of the sun’s energy ever reaches an osprey?
Pause when the reading reaches a film, and offer to play it. Saved on this device.
Watch the film now, or keep listening
Builds on:Photosynthesis Feeds the WorldReleasing Energy from FoodWho Eats Whom?Why these?
Where this lesson sits
- Virginia SOL LS.5 b
- Virginia SOL LS.5
- Practices LS.1 c, LS.1 d, LS.1 e
Essential question: Why does each step up a food web, from plankton to fish to ospreys, have less energy to live on?
-
Life Science (grade 7) LS.5 b, LS.5 You are here
This lesson
-
Biology
Preview it at high school level
In Biology you will give the levels new names: primary, secondary and tertiary consumers. Each feeding step is called a trophic level. You will also build biomass pyramids, which stack the mass of living things at each level instead of the energy. You will learn that a biomass pyramid can sometimes be upside down while the energy pyramid stays right side up. Then you will work through a real lake budget from 1942, Raymond Lindeman’s Cedar Bog Lake in Minnesota. Its numbers show that the one-tenth figure is a rough rule of thumb, not a fixed law.
-
Biology II Biology II: Ecology, EC.3; Advanced Topics, BIOII.6 a-c
Preview where it goes next
In Virginia’s Biology II courses (Ecology, EC.3, and Advanced Survey, BIOII.6 a-c), energy flow is tied to the laws of thermodynamics. You measure gross primary productivity, how fast producers capture energy, and net primary productivity, what is left after their own respiration. You calculate ecological efficiency from matching measurements at two levels. You meet organisms that get energy from chemicals, or that both make and eat food, and you follow carbon, nitrogen and phosphorus through an ecosystem.
-
College
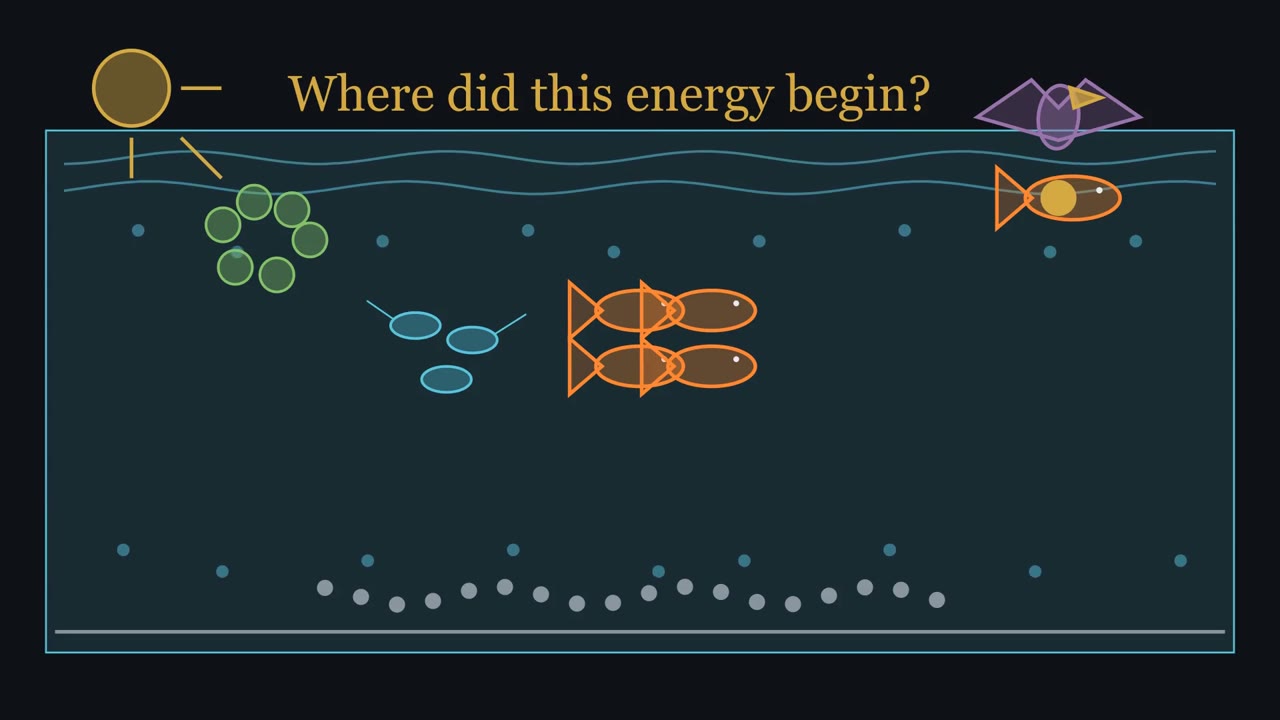 ▶ Watch Follow the Energy Arrows · 3:24
Read the transcript of “Follow the Energy Arrows”
Film transcript: Follow the Energy Arrows
An osprey lifts a menhaden from the Chesapeake Bay. Where did the energy inside that fish begin? Follow one glowing packet backward through the moving water. The Bay is an ecosystem, which includes living things and their nonliving surroundings. Light, water, and temperature are abiotic factors.
Organisms, their parts, and their wastes are biotic factors. A change in either kind can reshape the community. The trail ends at sunlight reaching phytoplankton, tiny drifting algae. They are producers because they make food using light energy. That stored energy can enter the living food web. Most ecosystems need new energy entering again and again. A zooplankton eats the producer. A menhaden eats that zooplankton. An osprey catches the menhaden. Each eater receives some stored energy from its food. The packet changes location, but it still follows the food. The arrows are missing. If each arrow shows energy movement, should it point toward the food or toward the eater? Choose before anything moves.
Arrows point from food to eater, the same direction the energy packet moves. This straight route is one food chain. It is one path, not the whole ecosystem. Read every arrow by asking where the stored energy goes. Menhaden can also eat phytoplankton directly.
Larger fish can eat menhaden too. New arrows join the first path. Linked food chains become a food web. That web reveals how a change can reach several organisms. On the longer path, the osprey is a third-order consumer. On a shorter path, it is second-order. The animal stays the same. Its order depends on the chosen path. Consumer order describes a position on one route. Dead matter and wastes carry stored energy from every level.
Dashed routes lead downward to decomposers, including many bacteria and fungi. Their work returns matter, but energy keeps moving onward. The decomposer branch connects to every feeding level, not just the top. Now watch each feeding step. Much energy follows other routes, so the packet continuing upward becomes smaller. Energy has not disappeared; different paths now hold it or release heat. At each feeding step, less energy is available to the next level. The osprey's energy began with sunlight captured by producers. A food web shows many connected routes. The shrinking packet explains why higher feeding levels have less energy to share. The web maps routes, while the packet maps what remains available.
From the film
- Food-web arrows point from food to eater, the direction energy moves.
- A consumer's order depends on the path: an osprey can be second-order or third-order.
- Producers bring energy into the living web, and decomposers receive dead matter from every level.
- At each feeding step, less energy is available to the next level.
The first film showed the energy packet shrinking at each step. Now put numbers on it.
Every spring and summer, ospreys nest on channel markers and dead trees along the Chesapeake Bay. They plunge feet-first to catch fish, including Atlantic menhaden in parts of the Bay. Menhaden are small, oily fish that swim in large schools and filter plankton, mostly tiny living things that drift in the water.
So what limits how many ospreys the Bay’s fish can feed? First, decide what you think now.
What do you think? Decide before you read.
-
Scientists disagree: Matter such as carbon and water is used again and again. Energy is not. It comes in as sunlight, passes from producers to consumers, and leaves as heat at every step. Most ecosystems need a steady supply of new sunlight.
What scientists think
Scientists disagree: Matter such as carbon and water is used again and again. Energy is not. It comes in as sunlight, passes from producers to consumers, and leaves as heat at every step. Most ecosystems need a steady supply of new sunlight.
-
Scientists disagree: A food chain is a simple model of one path. In a real ecosystem, many chains join into a food web. Menhaden eat plankton and are eaten by ospreys and larger fish, so a change in menhaden can reach many living things.
What scientists think
Scientists disagree: A food chain is a simple model of one path. In a real ecosystem, many chains join into a food web. Menhaden eat plankton and are eaten by ospreys and larger fish, so a change in menhaden can reach many living things.
-
Scientists disagree: Predators matter, but they depend on others. Producers such as plants and phytoplankton capture the energy that every other level uses. Decomposers such as bacteria and fungi break down dead matter and return nutrients. Each role is needed.
What scientists think
Scientists disagree: Predators matter, but they depend on others. Producers such as plants and phytoplankton capture the energy that every other level uses. Decomposers such as bacteria and fungi break down dead matter and return nutrients. Each role is needed.
Explore: build an energy pyramid
In this simulation, you set the producers’ energy, the percent passed at each step (5 to 20), and the number of levels (3 or 4). The osprey counter uses a made-up energy need, so it is a model, not a Bay animal count.
Predict. Set the percent to 10 and use 4 levels. What fraction of the producers’ energy should reach the top after three feeding steps?
Check your prediction
One-tenth passes three times, so the top receives one-thousandth of the starting energy: 10 of 10,000 made-up units.
- Ospreys the top bar could feed
- 10
- Share of the producers’ energy at the top
- 0.1 percent
- The arithmetic (units per square meter per year)
- 10,000 × 0.10 × 0.10 × 0.10 = 10
Each step passes 10 percent up.
In this sketch, every step passes the same percent, each level is one bar and decomposers are not drawn. Amounts are made-up units, and 1 unit feeds 1 osprey (also made up; the count is rounded down to whole ospreys). Wide bars are drawn to scale; any bar under 3 pixels is drawn 3 pixels wide so you can see it, so very thin bars look equal but are not. Red arrows show that much of the energy leaves as heat (all the same size, not to scale); in real food chains some energy not passed up also goes to decomposers.
Rule to keep: each step passes only about one-tenth up, and much of the rest is given off as heat, so the top level has the least energy. Energy limits top predators but gives no exact count.
The one idea. At each feeding step, less energy is available to the next level.
Scope: the rule gives the direction of change (less), and it holds at every feeding step. It does not give one exact percentage, and it does not predict how many animals live there.
Lower the percent to 5 and watch the top bar shrink much more, then return to 10.
Predict. If you double the producers’ energy but keep the percent and levels fixed, what happens to the top bar?
Check your prediction
It doubles. Every level gets the same fraction of twice as much. At 10 percent the osprey counter also doubles, from 10 to 20. At other settings it can be off by one, because it rounds down to whole ospreys.
Explain: living and nonliving parts of an ecosystem
- ecosystem
- biotic factor
- abiotic factor
- producer
- first-order consumer
- second-order consumer
- third-order consumer
- decomposer
- food web
- energy pyramid
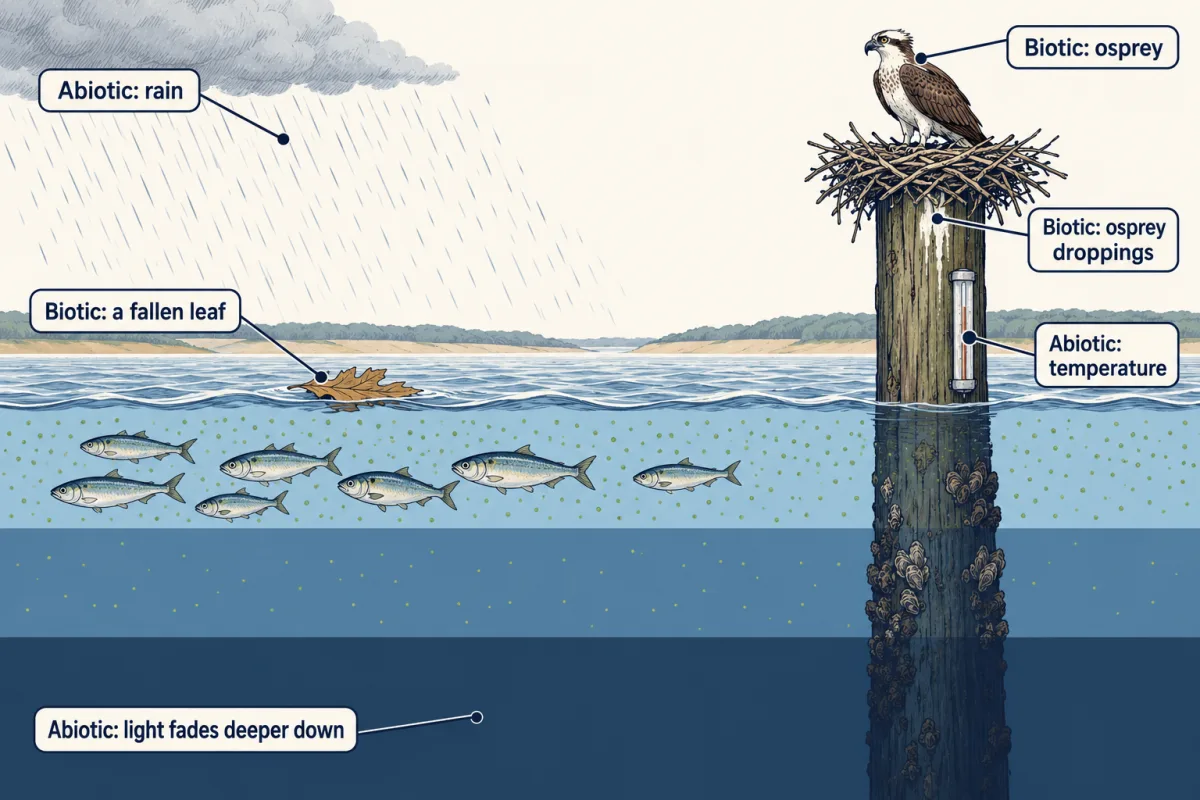
The first film called the Bay an ecosystem: all the living things in an area and their nonliving surroundings. A pond and a forest are ecosystems too.
A biotic factor is a living or once-living part: organisms, their parts, and their wastes. That includes a fallen leaf, a fish scale, osprey droppings, parasites, and disease-causing germs.
An abiotic factor is a nonliving part. Abiotic factors help decide what can live in a place and how many can live there. Besides light and temperature, they include yearly rainfall, soil minerals, and pH, which tells how acidic or basic water is. Light fades as water gets deeper, so deep down there is too little light for the plankton that make food from sunlight.
Explain: food chains and food webs
Nearly every food web starts with a producer, an organism that makes its own food. Most producers capture sunlight energy and store it in food. In the open Bay, the main producers are phytoplankton, tiny drifting algae; Photosynthesis Feeds the World shows how they capture that energy.
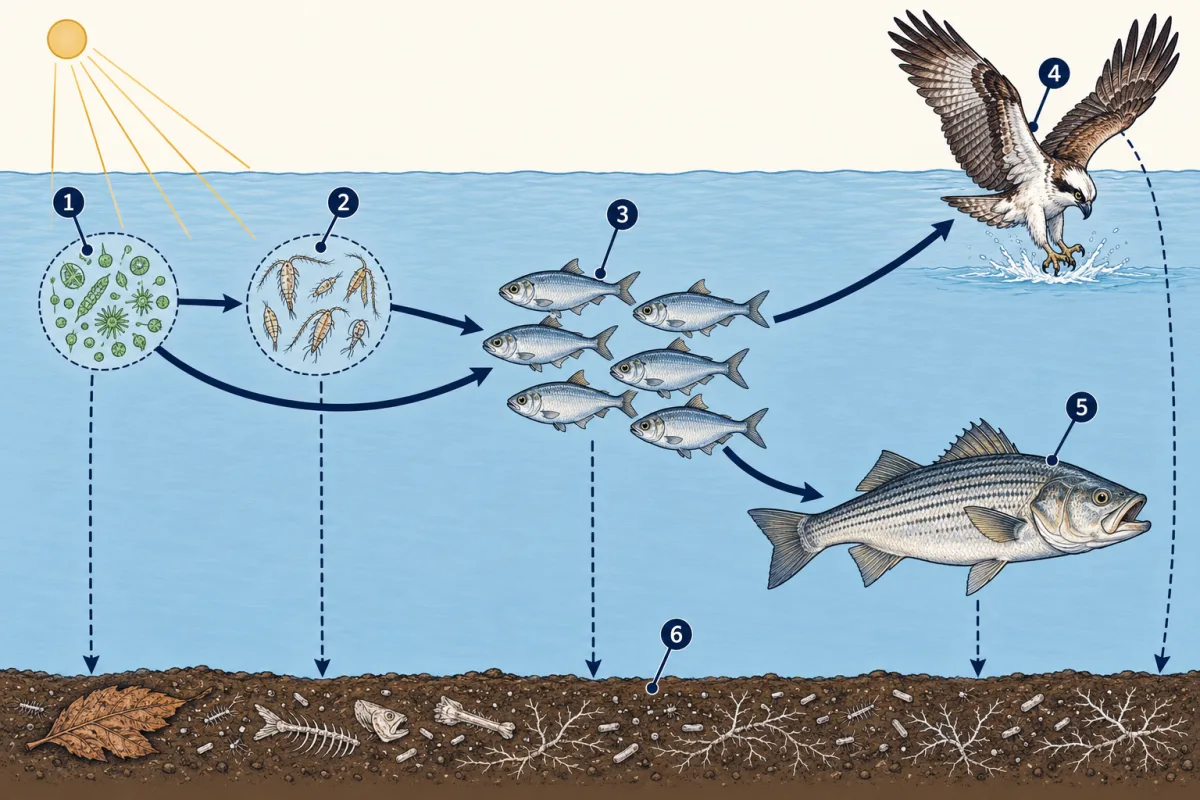
A food chain is a straight-line model of one energy path. As the first film showed, its arrows point from food to eater, the way the energy moves:
sunlight → phytoplankton → zooplankton → menhaden → osprey
Consumers are named by their place on one path:
- A first-order consumer eats producers. Many zooplankton, tiny drifting animals, eat phytoplankton.
- A second-order consumer eats first-order consumers.
- A third-order consumer eats second-order consumers.
The first film’s decomposers, such as many bacteria and fungi, break down dead matter and wastes from every level. Producers, Consumers and Decomposers follows that role farther.
A food web links many chains, like the two links the first film added. So a disease that killed many menhaden could change ospreys, larger fish, and plankton.
Predict. Now try the larger fish. What order consumer is it on the path phytoplankton → zooplankton → menhaden → larger fish? On phytoplankton → menhaden → larger fish?
Check your prediction
The larger fish is third-order on the longer path and second-order on the shorter path. Its order depends on the path through the web, not only on its species.
- phytoplankton
- zooplankton
- menhaden
- osprey
- larger fish
- decomposers
- phytoplankton
- blank
- blank
- osprey
- blank
- blank
Word bank: decomposers, larger fish, menhaden, zooplankton
- blank
- blank
- blank
- blank
- blank
- blank
Check your labels
- phytoplankton
- zooplankton
- menhaden
- osprey
- larger fish
- decomposers
Explain: why each level has less energy
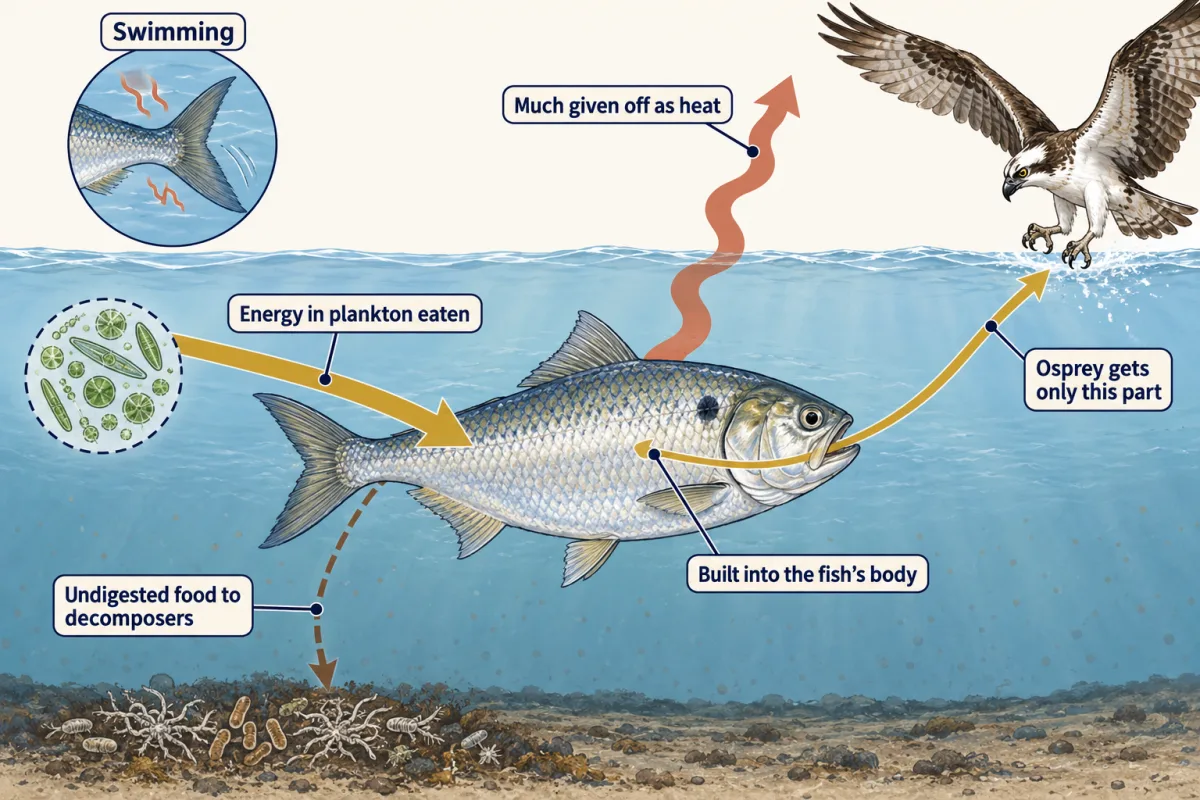
An energy pyramid stacks the energy available at each feeding level, with producers on the bottom. The first film showed energy splitting off at each step. Follow one menhaden to see where it goes: most energy in the plankton it eats does not become new menhaden.
- Much of it is given off as thermal energy (heat) during life processes such as swimming and breaking down sugar in respiration. You met respiration in Releasing Energy from Food.
- Some of the food passes through the fish without being digested. Decomposers can use that energy.
- Only the rest is built into the fish’s body, where an osprey can get it.
Ospreys do not catch every menhaden, and many die uneaten, so their stored energy goes to decomposers instead.
No energy change is perfect. Energy is not used up; it changes form, and much becomes heat that spreads into water and air. Producers cannot turn that spread-out heat back into food.
The simulation used a rough rule: about one-tenth of one level’s energy is available to the next. Here is the made-up model you tested:
| Level | Energy (units per square meter per year) |
|---|---|
| Producers | 10,000 |
| First-order consumers | 1,000 |
| Second-order consumers | 100 |
| Third-order consumers | 10 |
That one-thousandth at the top helps explain why a place can feed fewer top predators than small fish. But energy is not a head count: one large tree can feed many insects, so energy limits top predators without giving an exact number.
In most ecosystems, energy flows one way, in as sunlight and out as heat. Matter is different: decomposers return carbon and nutrients that producers use again, as The Carbon and Water Cycles shows.
One-tenth is a rough classroom rule, not a law. Real measurements vary from place to place, and many are lower. A 2026 study pooled about 1,600 energy measurements and found an average near 6 percent: close to one-tenth in the sea but much lower on land. Those numbers compare places. Inside one ecosystem, does every step pass on the same fraction? The second film tests one spring.
Read the transcript of “Test the Pyramid with Real Data”
Film transcript: Test the Pyramid with Real Data
The first film followed energy through the Bay. Do real measurements shrink in the same neat pattern? Test the model with one measured ecosystem. The measurements come from Silver Springs, Florida. Researchers estimated yearly energy entering each feeding level. The values were rough, but they let us test the pyramid's shape. Each value combines many lives across a shared area. Start with energy captured by plants and algae. Their green bar fills most of the frame. This is the producer level and the base for the consumer paths. Everything above depends on this incoming supply. Now add the consumers in order. Each measured bar is narrower than the one below.
A narrower bar means less energy entered that level. Yet the bars do not shrink by one identical fraction. Calculate each transfer by dividing a level by the one below it. Each result describes only one jump between neighboring levels. A fixed law would make every result match. The uneven bars already hint otherwise. Will the three calculated percentages match exactly, or will they differ? Choose before the results appear. Use each neighboring pair in the stack.
They differ. The three measured steps land in different places around the model marker. Real transfer varies even within one ecosystem. No single measured step defines the whole web. The missing energy did not vanish. Organisms released much as heat during life processes. Uneaten material and wastes carried stored energy into a decomposer side branch. Decomposers receive material from the whole web, so they sit beside the stack. The producer row needs special care. It counts all captured energy. Plants used much themselves, so only part became new plant material that consumers could eat. That smaller block is the producer material available for growth and feeding.
These bars measure energy flow, not animal counts. One large organism and many small ones can use similar totals. They came from one spring and rough estimates. The pattern can guide a claim without predicting an exact population. Return to the Bay. Different feeding steps can pass different fractions. The exact width may change, but the upward supply narrows. Repeating those losses still leaves far less energy near an osprey than near the producers. The measurements refine the classroom model without changing its main pattern. At each feeding step, less energy is available to the next level. Use the rule for direction, then use data for size.
Every step passes on less energy, but how much less varies.
From the film
- Every step passes on less energy, but how much less varies.
- At Silver Springs the three steps passed on different percentages; one-tenth is a rough classroom rule.
- Energy not passed on leaves as heat or goes to decomposers, a side branch fed by every level.
- An energy pyramid measures energy flow, not a count of animals.
Elaborate: real energy numbers from a Florida spring
Check the second film’s uneven Silver Springs steps yourself, and read what each row measured.
In the 1950s, the ecologist Howard T. Odum studied the clear water at Silver Springs, Florida. His unit was the kilocalorie. One kilocalorie is one Calorie on a food label, about 4,184 joules.
| Level at Silver Springs | Energy (kilocalories per square meter per year) | Percent of the level below |
|---|---|---|
| Producers (plants and algae) | 20,810 | starting level |
| First-order consumers (plant eaters) | 3,368 | 16.2 |
| Second-order consumers (meat eaters) | 383 | 11.4 |
| Third-order consumers (top meat eaters) | 21 | 5.5 |
| Decomposers (bacteria and others) | 5,060 | a side branch fed by all levels |
Source: Howard T. Odum, Ecological Monographs, 1957, Figure 7, yearly estimates for the upper Silver Springs run in Florida. The producer row is all energy captured from sunlight. Plants and algae gave off 11,977 as heat in their own respiration, so only 8,833 became new plant material. Consumer rows are energy taken in, which Odum estimated from each level’s respiration plus growth. He said the flows were very rough estimates, only to show their size. We calculated the percentages from his numbers, so small differences mean little.
- Describe the trend in energy from producers to third-order consumers.
- Which step was closest to 10 percent? Which was farthest from 10 percent, counting in percentage points?
- Decomposers took in more energy than the plant eaters. Where could that energy come from?
Claim, evidence, reasoning
Make a claim that answers the essential question: why can a place feed many small animals but few top predators? Use the Silver Springs data.
Start with: Fewer top predators can live in a place because blank.
Start with: At Silver Springs, producers captured blank kilocalories per square meter per year, but third-order consumers took in only blank.
Start with: At each step, much of the energy is blank, so blank is left for the next level.
Compare with a model answer
A place can support fewer top predators than the organisms below them because less energy reaches each higher level. At Silver Springs, producers captured 20,810 kilocalories per square meter per year, but third-order consumers took in only 21, about one-thousandth as much. At each step much of the energy was given off as heat, and some went to decomposers. One limit: this is one Florida spring in the 1950s, not the Bay, and Odum called his numbers very rough estimates. Energy is also not a count of animals.
Saved in this browser only.
Design problem
Mealworms are beetle larvae that eat oat bran. Plan an investigation to compare how much food mealworms eat with how much mass they gain.
Predict. Why does the plan need containers of bran with no mealworms?
Saved in this browser only.
Check your prediction
Bran can lose mass by drying. Containers without mealworms measure that loss, so drying is not counted as food eaten.
One way to do it
- Question: How does the mass of bran eaten compare with the mass the mealworms gain?
- Independent variable: whether a container has mealworms in it or not.
- Dependent variable: mass of the mealworms at the start and end, and mass of the bran left after sifting out the mealworms and their waste, in grams, over 7 days.
- Constants: 20 mealworms in each container that gets them, 20 grams of bran in every container, same temperature, same container size.
- Control: a container of bran with no mealworms. It shows how much mass the bran loses by drying out.
- Trials: three containers with mealworms and three without. Report the mean.
- Safety: wash your hands after handling, keep containers closed, and never release mealworms outdoors.
If the mealworms gain much less mass than the bran they ate, most of the food did not become new mealworm. Respiration and waste account for much of the rest.
Evaluate: check your thinking
The energy in an osprey began as sunlight captured by phytoplankton. Every step passes on less energy, but how much less varies. Repeated steps leave much less near the top, which helps explain why the Bay can feed fewer ospreys than small fish.
Science practices you used: testing predictions with a model, finding percents in a real data table, making a claim from evidence, and planning a fair test.
Your notes
Select any text in the lesson to highlight it or add a note to it. Your highlights and notes are saved in this browser and collected in your notebook.
This browser is not letting the site save anything (a private window or strict privacy settings), so highlights and notes will be lost when you leave the page.
How we measure it
Measuring oxygen in flowing water
At Silver Springs, Howard Odum compared the oxygen in the water upstream and downstream, and corrected for oxygen moving between the water and the air. Day and night readings together showed how fast the plants and algae were capturing energy by photosynthesis.
Cameras at osprey nests
In a 2021 Virginia study, small trail cameras at nests took a picture every five minutes in daylight. Researchers used the pictures to identify the fish the adults brought to their chicks.
Where this lesson fits
Before thisReview first
- Photosynthesis Feeds the WorldThis course · Lesson 9
You need to know how producers capture sunlight energy and store it in food before following it up the chain.
- Releasing Energy from FoodThis course · Lesson 10
Respiration is where much of each level's energy is given off as heat, which this lesson counts.
- Who Eats Whom?Biology Together · Ages 5–10, with a grown-up
You should already know how a food chain or web shows who eats whom, with arrows from food to eater.
After thisStudy next
- Producers, Consumers and DecomposersThis course · Lesson 13
It takes the decomposer branch of the web further, showing how dead matter and wastes return nutrients for reuse.
- The Carbon and Water CyclesThis course · Lesson 14
It shows matter being reused while energy flows one way and leaves as heat.
- Populations Rise and FallThis course · Lesson 23
It uses limited food energy to explain why populations of top animals stay smaller and change over time.
Suggested by an AI model from the lessons themselves, then checked. How we use AI
Finish line
Test yourself
8 questions
Practice and MCAT-style, with explained answers.
Next · Lesson 13
Producers, Consumers and Decomposers
Leaves fall in the forest every autumn, so why don’t the old ones just keep piling up?
Continue →