Ecology and Evolution · Skim version
Life Histories and Evolutionary Trade-offs
Read the full lesson → Skim the whole course →
The guiding idea
If breeding can cost a bird its future, why do birds that lay more eggs often survive better from one year to the next?
What an individual takes in sets its budget, how it splits that budget among growth, upkeep, storage and reproduction is where trade-offs live, and selection favours the split that leaves the most descendants, given who dies at what age.
From the film: One Budget, Many Uses
- Treat what an individual takes in and can use as one budget, split among growth, upkeep, storage and reproduction.
- For one individual with a given budget, more to reproduction leaves less for itself: that negative link is a trade-off.
- Two classic trade-offs: this year's young against the parent's own future, and many small offspring against a few large ones.
- Selection acts on the split, favouring whichever split leaves the most descendants, given who dies at what age.
- Low adult survival lowers the extra young one big bout needs to pay, so putting more into this year's bout can pay; how far still depends on how extra effort changes breeding and survival. Where adults survive well, or young survive poorly, holding back to breed again can pay.
From the film: Why the Trade-off Hides
- Birds that take in more can afford more of everything, so larger clutches can go with better survival even when each bird faces a trade-off.
- Van Noordwijk and de Jong's comparison: people with large incomes have bigger houses and newer cars, yet for any one income the two still trade off.
- A natural correlation alone cannot show a trade-off or rule one out.
- Adding chicks to nests chosen at random balances richer and poorer parents between the groups on average, so a later survival difference can be laid on the extra chicks, allowing for chance.
- Across 30 bird species, enlarged broods lowered parents' survival a little on average (the cost per extra chick was uncertain), while naturally larger clutches went with better survival.
-
Semelparity, iteroparity and the cost of reproduction
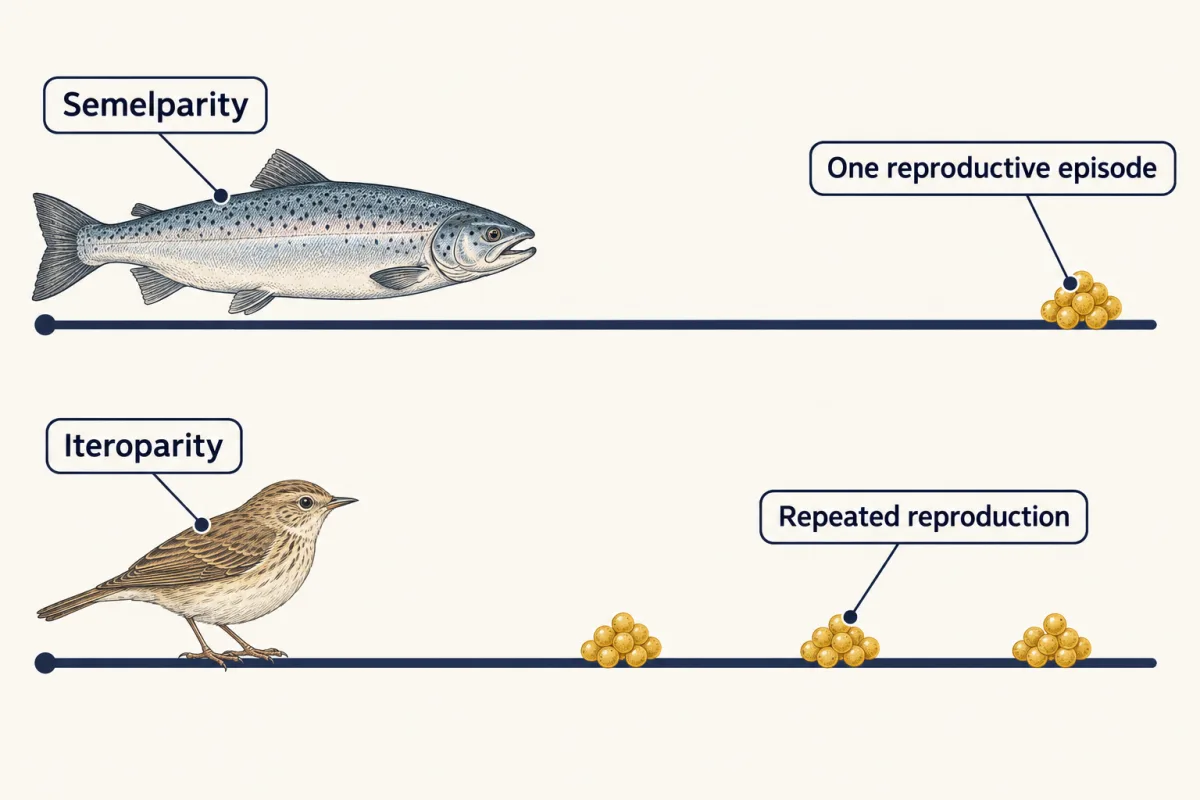
In the simple model, breeding once breaks even only with p / c extra young: few when adults rarely survive, many when young rarely do. AI-generated illustration -
r and K, then the fast-slow continuum
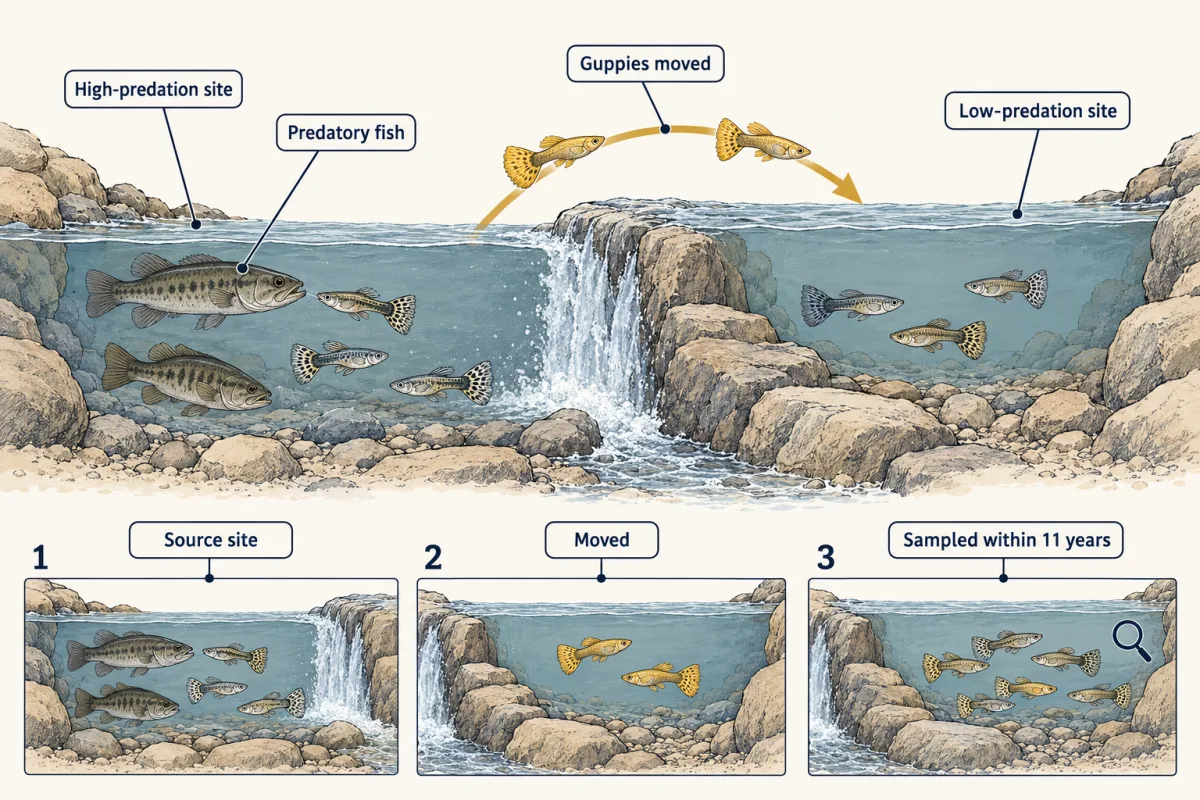
Moving guppies to a site where predators eat mostly juveniles shifted deaths from adults to young, and within 11 years the population evolved later maturity and fewer, larger offspring, as theory predicts; density and food changed too. AI-generated illustration -
Testing a trade-off: correlation versus manipulation
-
Going deeper
Where this lesson fits
Before thisReview first
- Natural Selection in Ecological ContextThis course · Lesson 3
You need its definition of fitness and how selection favours traits that leave more descendants to read life-history splits.
- How to Test an Evolutionary ExplanationThis course · Lesson 1
It sets out how to separate a pattern in data from a real test of an evolutionary explanation, which the manipulation here relies on.
After thisStudy next
- Demography and SurvivorshipThis course · Lesson 13
Survivorship and age-specific reproduction in life tables put numbers on the who-dies-at-what-age logic used here.
- Population Growth and RegulationThis course · Lesson 14
The r and K terms here take their meaning from exponential and logistic growth, and this lesson sets them up.
- Conservation and RestorationThis course · Lesson 25
Managing a species means using its life history, since fast and slow species respond differently to losing adults or young.
Elsewhere on the siteFilms, simulations and method films in other courses
- Why Energy Pyramids NarrowFilm · Biology
It shows how only part of the energy taken in becomes tissue, the same limited budget that must be split among uses.
- When the Body Pushes BackFilm · Biology
It shows the body keeping conditions steady with energy, a upkeep cost that competes with growth and reproduction for the budget.
Suggested by an AI model from the lessons themselves, then checked. How we use AI