Life Science · Unit 6: Changing ecosystems
Daily and Seasonal Rhythms
Rewritten on : new text, flashcards and film. Your notes and highlights stay, but the text around them may have moved.
How does a cherry tree with no calendar know when to bloom, and why might that day change?
Pause when the reading reaches a film, and offer to play it. Saved on this device.
Watch the film now, or keep listening
Builds on:Adaptations for SurvivalProducers, Consumers and DecomposersWhy these?
Where this lesson sits
- Virginia SOL LS.8 a
- Practices LS.1 b, LS.1 c, LS.1 d, LS.1 f
Essential question: How do plants and animals know when to sleep, bloom or fly south?
-
Life Science (grade 7) LS.8 a You are here
This lesson
-
Biology
Preview it at high school level
In Biology you will learn how a living thing keeps conditions inside it steady while the outside changes. This is called homeostasis. Most of it works by negative feedback. A sensor detects a change, a control center compares it with the usual range, and an effector responds in a way that pushes the change back. Your body temperature stays near 37 °C because you sweat when you are warm and shiver when you are cold. Plants narrow the tiny pores in their leaves in dry air, which slows water loss. You will also see roots bending toward water again, this time as a way a plant keeps its water supply steady.
-
Biology II Biology II: Advanced Survey of Biology Topics, BIOII.2 f
Preview where it goes next
In Virginia's Biology II courses, feedback loops get a closer look: the stimulus, sensor, control center and effector, and the difference between negative feedback, which pushes a change back, and positive feedback, which makes it bigger until an event ends it. Students design their own investigations of these loops. Daily rhythms fit in here, because many body conditions, such as body temperature, rise and fall a little on a daily schedule while still being held within a range.
-
College
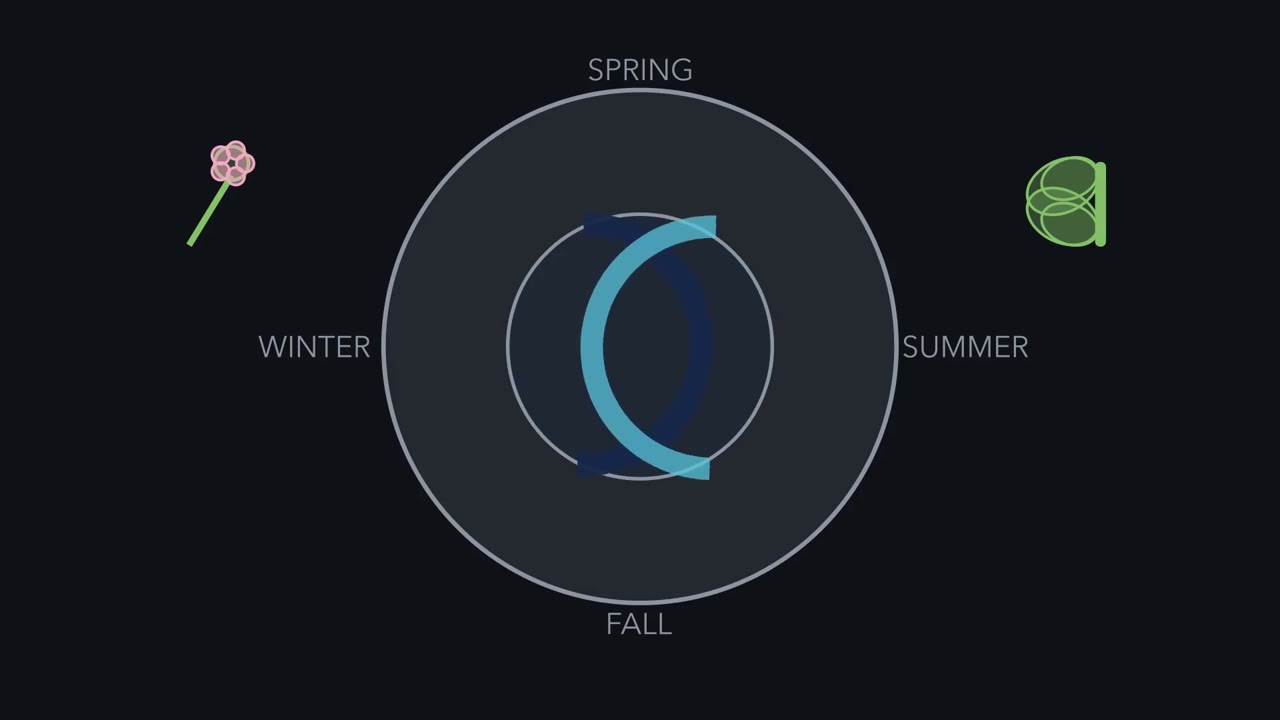 ▶ Watch From One Day to One Year · 3:38
Read the transcript of “From One Day to One Year”
Film transcript: From One Day to One Year
How can a tree or butterfly act on time without a calendar? Watch one dial carry a day inside a year. Its blue light band turns. Its red temperature band rises and falls. The living things change with it. Start with the inner dial. A circadian rhythm repeats about once each day. Light and darkness help keep many rhythms aligned. Many owls and many bats hunt at night. Tree squirrels and most songbirds are active by day. Yet the rhythm is not simply a reaction to each sunrise. Here is your prediction. The blue light band disappears, leaving steady darkness. Will the gold activity rhythm vanish at once, or keep circling for a while? Watch the gold marker carefully.
Choose before the dial moves. In many animals, it keeps circling for a while. That tells us some timing comes from inside the body. Outside light still matters because it keeps that inner rhythm lined up with the day. Inner timing and outside light work together. Not every response is a rhythm. A tropism is plant growth toward or away from something. Light moves beside a bean shoot.
Cells lengthen more on the shaded side, so new growth bends toward light. Roots can also curve toward wetter places. Now widen back to the year. Shorter days and cooler air can time seasonal responses. Monarchs migrate. Tree buds become dormant.
Groundhogs hibernate, lowering body temperature and using less stored energy. Deciduous trees also drop leaves as winter approaches. These responses meet a hard season in different ways. Migration changes place. Dormancy slows growth while life continues.
Hibernation is animal dormancy, not one unbroken sleep. Groundhogs briefly warm, then cool again. Each response helps the organism meet hard conditions. Outside cues are not the whole story. Some animals also have inner yearly timing. With day length held steady, groundhog eating and weight cycles kept repeating about once a year. Many seasonal behaviors are inherited. A first-time monarch can fly south without being taught, although some animals do learn routes. Species combine cues differently. Many tree buds need winter cold before later warmth can open them. The order of cues can matter. So one warm day is not a universal start button. The response depends on the organism's timing system.
The picture now has two kinds of timing. Gold inner rhythms keep turning. Blue and red cues help line up responses with the world. No single cue controls every organism. Across days and seasons, the useful response arrives at a useful time.
From the film
- Inner rhythms and environmental cues time responses; long-term changes can shift them.
- A circadian rhythm repeats about every 24 hours; in many animals it continues for a while in steady darkness.
- A tropism is plant growth toward or away from something, not a repeating rhythm.
- Migration, dormancy and hibernation help organisms meet seasonal conditions.
- Many tree buds need winter cold before later warmth can open them.
Every fall, many monarch butterflies fly south through Virginia toward forests in the mountains of central Mexico. Every spring, the cherry trees around the Tidal Basin in Washington, D.C., just across the Potomac River from Virginia, burst into bloom.
People have written down the date of peak bloom for these trees every year since 1921. A butterfly has no calendar, and a tree has no eyes. So how do they know when to leave, or when to bloom? And can that timing change?
What do you think? Decide before you read.
-
Scientists disagree: Monarchs that fly south in fall have never been to the forests in Mexico, and they do not travel with their parents. A lab study of 13-lined ground squirrels found that genes explain much of when they start to hibernate. Some animals do learn from older animals, such as young cranes on their routes, but many seasonal behaviors are inherited.
What scientists think
Scientists disagree: Monarchs that fly south in fall have never been to the forests in Mexico, and they do not travel with their parents. A lab study of 13-lined ground squirrels found that genes explain much of when they start to hibernate. Some animals do learn from older animals, such as young cranes on their routes, but many seasonal behaviors are inherited.
-
Scientists disagree: The cherry bloom date in Washington, D.C., has been recorded every year since 1921. It moves around from year to year, and the average for each decade has moved too.
What scientists think
Scientists disagree: The cherry bloom date in Washington, D.C., has been recorded every year since 1921. It moves around from year to year, and the average for each decade has moved too.
-
Scientists disagree: Plants respond in their own ways, often by growing. In lab tests, seedlings bend toward light and young roots bend toward the wetter side of their dish. Trees drop their leaves in fall and keep their buds closed through winter.
What scientists think
Scientists disagree: Plants respond in their own ways, often by growing. In lab tests, seedlings bend toward light and young roots bend toward the wetter side of their dish. Trees drop their leaves in fall and keep their buds closed through winter.
The one idea to carry through this lesson. Inner rhythms and environmental cues time responses; long-term changes can shift them.
Scope: This rule describes daily and seasonal responses in the organisms here. A response may use an inner rhythm, an outside cue or both. Different species can respond differently to the same change.
Explore: turn the year dial
Slide the date through the year to watch day length and average temperature change around a cherry tree, a groundhog and a monarch. A second slider makes spring up to 3 °C warmer.
Start here: drag the date slider from January to December and watch the three living things.
bloom day fall cue day today. Ring color: blue is colder, orange is warmer.
Thin black tick: the temperature with no extra warmth.
- Bloom day in this sketch
- 93
- With no extra warmth
- 93
- Change
- 0 days
Dormant buds
Awake
In the forest in Mexico
In this sketch, drag the date slider to start the year.
Assumptions made up for this sketch: one warmth line starts bloom, and with no extra warmth it falls on day 93 (about April 3, near the lesson’s decade averages). The same warmth line starts the groundhog’s warm-up and the monarch’s trip north. The size of the shift is not matched to the Tidal Basin record. One day-length line is the only fall cue. Every year is the same, with no weather swings. The delays, the spans of days and the short groundhog warm-ups every 20 days are invented. Bars are relative units, not hours or degrees.
Rule to keep: cues such as day length and temperature start these seasonal responses, and a tree whose buds respond to warmth may bloom earlier in a warmer spring.
Try this.
- Predict the month when the monarch leaves. Then slide the date and see what changed just before.
- Predict when the groundhog’s body temperature bar will fall and when it will rise. Then test it.
- Predict whether a warmer spring moves the bloom day earlier or later. Set the warmer spring slider to 3 °C and compare the bloom day number. In this sketch the slider moves only the cherry tree.
Explain: one day at a time
- circadian rhythm
- tropism
- migration
- hibernation
- dormancy
- deciduous
- instinct
Earth spins once about every 24 hours, so most places have day and night. A circadian rhythm is a pattern in a living thing that repeats about every 24 hours, like your sleepiness at night. The first film showed that in many animals it keeps going for a while in steady darkness. Plants keep time too. Many have their own daily clock: bean leaves lift during the day and droop at night.
A tropism is different: growth of a plant toward or away from something in its surroundings. As the first film showed, shoots bend toward light. In lab tests, young roots bent toward the wetter side of their dish. The bend is made of new growth, so it builds up slowly, from about half an hour to days.
Predict. A bean shoot has bent toward a lamp. The lamp is moved to the other side. Will the old bend flip, or will new growth change the shoot’s direction?
Check your prediction
The part of the stem that has stopped growing keeps its old bend. In the growing part, cells on the newly shaded side lengthen more, so new growth curves toward the lamp.
Explain: meeting the seasons
In a Virginia winter, days are short, nights are cold, and many foods are hard to find. Here are three ways living things get through it.
- Migration is the seasonal movement of animals from one region to another and back. Monarchs fly south in fall; in spring they move north again over several generations.
- Dormancy is a resting state in which a living thing slows or stops growing but stays alive until conditions improve. Seeds and tree buds wait out winter this way.
- Hibernation is dormancy in animals. Body temperature drops and the heart and breathing slow, so a groundhog uses less of its stored fat.
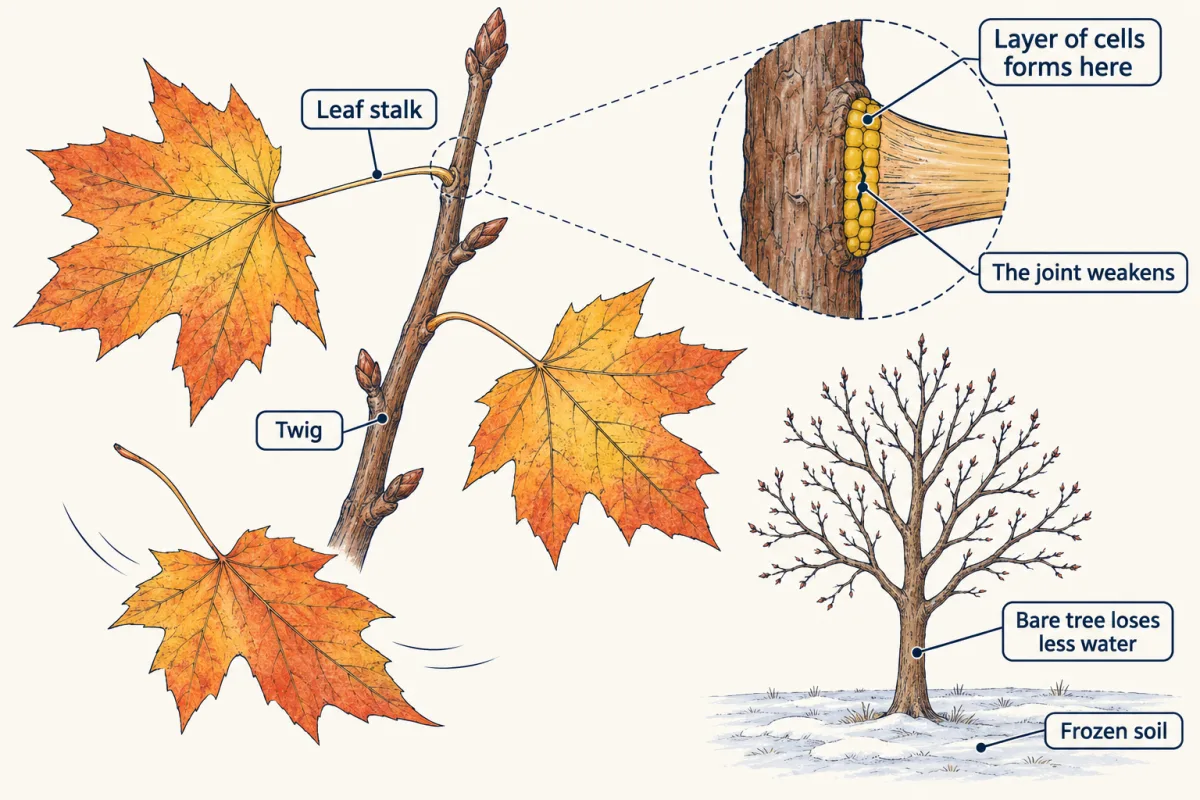
Virginia’s deciduous trees, such as oaks and maples, drop their leaves each fall. Where each leaf stalk joins the twig, there is a thin band of cells that formed when the leaf grew.
Predict. As days get shorter and the air cools, which change makes the leaf fall: cells in the leaf blade shrinking, or cells in the band at the stalk coming apart?
Check your prediction
The cells in the band start to come apart. This weakens the joint, and the leaf falls. A protective layer then seals the scar.
Without leaves, the tree loses less water in winter, when frozen soil makes water hard to get.
| Season | Common cues (they differ by species) | Some responses |
|---|---|---|
| Fall | Shorter days, cooler air | Leaves drop, buds go dormant, monarchs fly south, groundhogs hibernate |
| Winter | A long time of cold | Dormant buds become ready to open |
| Spring | Warmer days | Buds open, seeds sprout, groundhogs come out |
Cues can also work together (see the aspen buds in Going deeper). Many of the animal behaviors here are instincts: behaviors an animal inherits and can do without being taught.
Most responses in this section are timed by outside cues. So what happens when the cues themselves change, year after year?
Read the transcript of “When Nature's Calendar Shifts”
Film transcript: When Nature's Calendar Shifts
The first film showed how rhythms and cues time responses. What happens when cue patterns change for years? Return to the same dial. The nearest dial still holds a cherry bud. This time, stack many years behind it. Long-term change can come from natural events or from people.
Wildfires and floods can happen naturally. People can cause pollution and habitat destruction. Change can alter population size, location, relationships, or timing. Here we will follow timing, using one group of cherry trees. Suppose winter and early spring become warmer across many years. A tree that responds to warmth may bloom earlier. On each new dial, the red warmth band reaches the bud sooner. The green bloom marker slides earlier on this schematic dial. But warmth is not the only cue. Many buds need enough cold first. If winter becomes too warm, some may open late or unevenly. Warming does not force every response earlier. Different timing systems can give different results.
Now predict. One spring has an unusually early bloom. Does that single year prove the long-term pattern moved? The rest of the record stays hidden. Hold your answer while one green point appears on an empty timeline. No. One year can differ for many reasons. A long-term claim needs repeated observations made with the same rule. Observers use a fixed rule for peak bloom. At the Tidal Basin, observers recorded peak bloom across nearly a century. The record uses day of year. A smaller day number means an earlier date. That direction can feel backward at first. Imagine the year as a ruler from winter toward summer. Moving left means blooming earlier.
Scientists can group years and compare mean bloom days. The plotted means wiggle. The line never becomes a smooth staircase. Several groups are later than the group before. After the group with the latest mean, the means move earlier, though not in a steady line. Compare two groups on screen. Subtract the smaller mean from the larger mean. The smaller mean marks the earlier bloom. The difference shown is evidence of shifted timing. Be careful with the claim. These trees in one city do not represent every species. The dates show a pattern, but they alone cannot prove what caused it. Testing cause needs temperature evidence too. The dial, record, and limit fit together.
Organisms use timing systems. Long-term conditions can move the cues they meet. Responses may shift, while the details still depend on the organism. A careful claim keeps both pattern and limit.
From the film
- Inner rhythms and environmental cues time responses; long-term changes can shift them.
- A smaller day-of-year number means an earlier event.
- After the 1960s, the mean peak-bloom day moved earlier, though not in a steady line.
- The dates show a pattern, but they alone cannot prove what caused it.
Explain: when the long-term pattern shifts
Warming does not move every response earlier. Many tree buds need enough winter cold before later warmth can open them. If a winter is too warm to give enough cold, some buds may open late or unevenly. The second film showed how to read a timing record. Now read the full cherry record yourself.
Elaborate: a century of cherry blossoms
Peak bloom is the day when about 70 percent of the Yoshino cherry blossoms around the Tidal Basin are open. Each date is a day of the year: January 1 is day 1, and day 91 is April 1 in a year that is not a leap year.
| Years | Number of years | Mean peak-bloom day (day of year) | About the same as |
|---|---|---|---|
| 1921–1929 | 9 | 92.7 | April 3 |
| 1930–1939 | 10 | 96.8 | April 7 |
| 1940–1949 | 10 | 93.4 | April 3 |
| 1950–1959 | 10 | 96.8 | April 7 |
| 1960–1969 | 10 | 97.4 | April 7 |
| 1970–1979 | 10 | 95.5 | April 6 |
| 1980–1989 | 10 | 93.3 | April 3 |
| 1990–1999 | 10 | 90.9 | April 1 |
| 2000–2009 | 10 | 90.7 | April 1 |
| 2010–2016 | 7 | 91.7 | April 2 |
Source: peak-bloom dates for the Yoshino cherries at the Tidal Basin, Washington, D.C., 1921 to 2016, from the National Park Service and the National Cherry Blossom Festival, as published by the U.S. Environmental Protection Agency in 2016. Each mean was calculated from the yearly dates in that file.
Predict. The mean is day 92.7 for 1921–1929 and day 90.7 for 2000–2009. Which is earlier, and by how many days?
Check your prediction
Day 90.7 is earlier. Subtract: 92.7 − 90.7 = 2.0, so the later group’s mean is 2 days earlier.
- Which group of years had the latest mean bloom day? Which had the earliest?
- How many days earlier was the 2000–2009 mean than the 1930–1939 mean? Is that a larger or smaller shift than the one in your prediction?
- Did the mean get earlier in every decade? Compare 1940–1949 with 1950–1959.
Claim, evidence, reasoning
Make a claim that answers the essential question for the cherry trees: can the timing of a seasonal response change over many years? Use the bloom data.
Start with: Over many decades, the cherry trees’ mean peak bloom has blank.
Start with: The mean bloom day was blank for 1930–1939 and blank for 2000–2009, a difference of blank days.
Start with: Buds open after a cold winter when the weather warms, so blank.
Compare with a model answer
Over many decades, the cherry trees’ mean peak bloom has moved earlier. The mean bloom day was 96.8 for 1930–1939 and 90.7 for 2000–2009, about 6 days earlier. Buds open when spring warms after winter cold, so warmer winters and springs can make them bloom sooner. The change was not steady: the 1950s were later than the 1940s, the 1960s had the latest mean, and the 1920s mean was only 2 days later than the 2000s mean. Most of the move earlier came after the 1960s. One limit: this is one group of trees in one city, and these numbers alone do not prove that temperature caused the change.
Saved in this browser only.
Design problem
Does the direction of light change which way a bean seedling grows? Plan an investigation.
Predict. Which is the independent variable: the direction of light or the angle of the stem?
Saved in this browser only.
Check your prediction
The direction of light. You change it on purpose and measure the stem angle.
Predict. Which seedlings are the control: those lit from the side or those lit from the top?
Check your prediction
The top-lit seedlings. Their stems should grow straight up for comparison.
One way to do it
- Question: Do bean seedlings bend toward light that comes from one side?
- Independent variable: the direction of light. Some boxes have a hole on one side. Others have the hole on top.
- Dependent variable: the angle of each stem from straight up, in degrees, measured with a protractor after 5 days.
- Constants: same kind of bean, soil, pot, daily water, room and amount of light.
- Control: seedlings in boxes lit from the top. Their stems should grow straight up.
- Repeated trials: five seedlings for each kind of box. Find the mean angle.
- Safety: use a window or a cool LED lamp, not a heat lamp. Wash your hands after handling soil, and do not eat the seeds.
If stems lit from the side bend toward the hole and the control stems grow straight, the data support the idea that shoots grow toward light.
Evaluate: check your thinking
Inner rhythms and environmental cues time responses; long-term changes can shift them. Monarchs and cherry trees respond to cues such as day length and temperature, and many of these responses are inherited. The Tidal Basin record shows the mean bloom date moving earlier after the 1960s, though not in a steady line. The dates show a pattern, but they alone cannot prove what caused it.
Science practices you used: testing predictions in a model, reading a data table, comparing means, naming the limits of data, and planning a fair test with a control and repeated trials.
Going deeper
Inner yearly timing and instinct
Groundhogs have an inner yearly clock. In rooms where the day length never changed, their cycles of eating and weight gain kept repeating about once a year for up to 4 years. In a lab study of ground squirrels, most were young animals hibernating for the first time, and genes explained much of when they started. Learning can still matter: young whooping cranes flew straighter routes when older cranes were present.
Aspen buds and winter cold
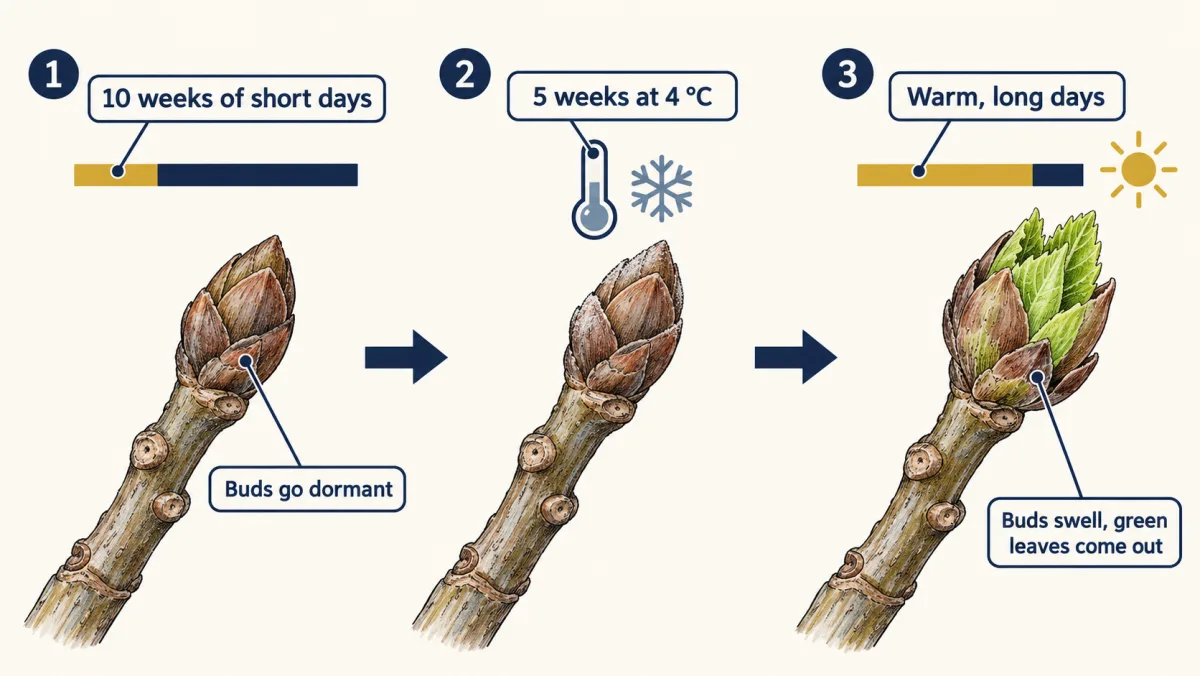
In a 2018 experiment, young aspen trees got 10 weeks of short, 8-hour days, and their buds went dormant. Then the trees spent 5 weeks at 4 °C. Back in warm, long days, the buds swelled and green leaves came out.
Other long-term changes
Wildfires and floods can happen naturally, and climate can shift. People can also cause long-term changes through pollution, habitat destruction and overharvesting. These changes can affect how many organisms live in a place, where each species lives, and how a whole ecosystem fits together. As the climate has warmed, many land species now live farther toward the poles or higher up mountains than before. Continue with Populations Rise and Fall and Big Changes, a later lesson.
Your notes
Select any text in the lesson to highlight it or add a note to it. Your highlights and notes are saved in this browser and collected in your notebook.
This browser is not letting the site save anything (a private window or strict privacy settings), so highlights and notes will be lost when you leave the page.
How we measure it
Repeated bloom observations
Observers check the same group of trees each spring and record the day a fixed rule is met: for the Tidal Basin Yoshino cherries, peak bloom is the day about 70 percent of the blossoms are open. Using the same rule every year lets scientists compare dates across decades.
Tag and recovery
Volunteers put a small numbered sticker on a monarch's wing and record where it was tagged. If someone finds that butterfly far away, the number links the two places and shows the shortest distance it could have traveled.
Body-temperature logging
A small sensor records an animal's body temperature over and over for weeks. The record shows the day hibernation starts and the short times the animal warms up again.
Where this lesson fits
Before thisReview first
- Adaptations for SurvivalThis course · Lesson 21
Hibernation, migration and dormancy are survival adaptations, and you need that idea to see why timing them matters.
- Producers, Consumers and DecomposersThis course · Lesson 13
Leaf drop and winter food shortage make more sense once you know how plants, animals and decomposers get matter and energy.
After thisStudy next
- Big Changes: Dead Zones, Storms and ClimateThis course · Lesson 24
It takes long-term environmental change further, showing climate and other big shifts changing whole ecosystems.
- Populations Rise and FallThis course · Lesson 23
Changing seasonal conditions and long-term shifts affect how many organisms live in a place.
Elsewhere on the siteFilms, simulations and method films in other courses
- Set Up: Sleep, Travel or Stay?Film · Biology Together
It shows which animals sleep through, travel from or stay in winter, the seasonal responses used here.
- Set Up: Adopt a TreeFilm · Biology Together
It shows how a tree changes through the seasons, such as bare winter branches that are not dead.
Suggested by an AI model from the lessons themselves, then checked. How we use AI
Finish line
Test yourself
8 questions
Practice and MCAT-style, with explained answers.
Next · Lesson 23
Populations Rise and Fall
How can the Bay's blue crab estimate more than double when the Bay does not get bigger?
Continue →