Ecology and Evolution · Skim version
Global Change: Species on the Move
Read the full lesson → Skim the whole course →
The guiding idea
A mountain warms 0.3 C in a decade. How far uphill must a beetle's range shift to stay as cool as before?
Under warming, a range edge set by temperature keeps up only if it moves as fast as its isotherm, whose speed is the warming rate divided by the local temperature gradient, so ecologists measure how the gap between species and isotherm changes from a stated start.
From the film: The Climbing Line
- Warming moves an isotherm, a line of equal temperature, poleward and uphill.
- The isotherm's speed, the climate velocity, is the warming rate divided by how fast temperature changes across the land.
- On a slope cooling 0.6 C per 100 m, warming of 0.3 C per decade moves the isotherm about 50 m uphill per decade.
- In one European example, one metre uphill gives the cooling of about 1.5 km poleward; the exchange rate varies by place, so each shift is compared with its own isotherm.
- A range keeps up only by moving as fast as its isotherm; a shift shows change, not its cause.
From the film: Two Forests, One Bird
- Many spring events now come earlier, but interacting species often shift by different amounts, so an earlier date alone cannot show keeping up.
- Trophic mismatch is the offset between peak food and peak demand, such as nestlings in the nest; unequal shifts can open or widen it.
- In nine Dutch pied flycatcher populations, numbers fell about 90% over two decades where caterpillars peaked early, and weakly at most where they peaked late.
- That comparison across sites supports a cost of mismatch, but the forests were not assigned their food timing.
- In aviaries with food freely available, a warmer temperature pattern generally advanced great tits' laying, pointing to temperature as a likely cue.
-
Moving: species shift poleward and uphill
-
Keeping pace: climate velocity on a mountain
-
Timing: phenology and mismatch
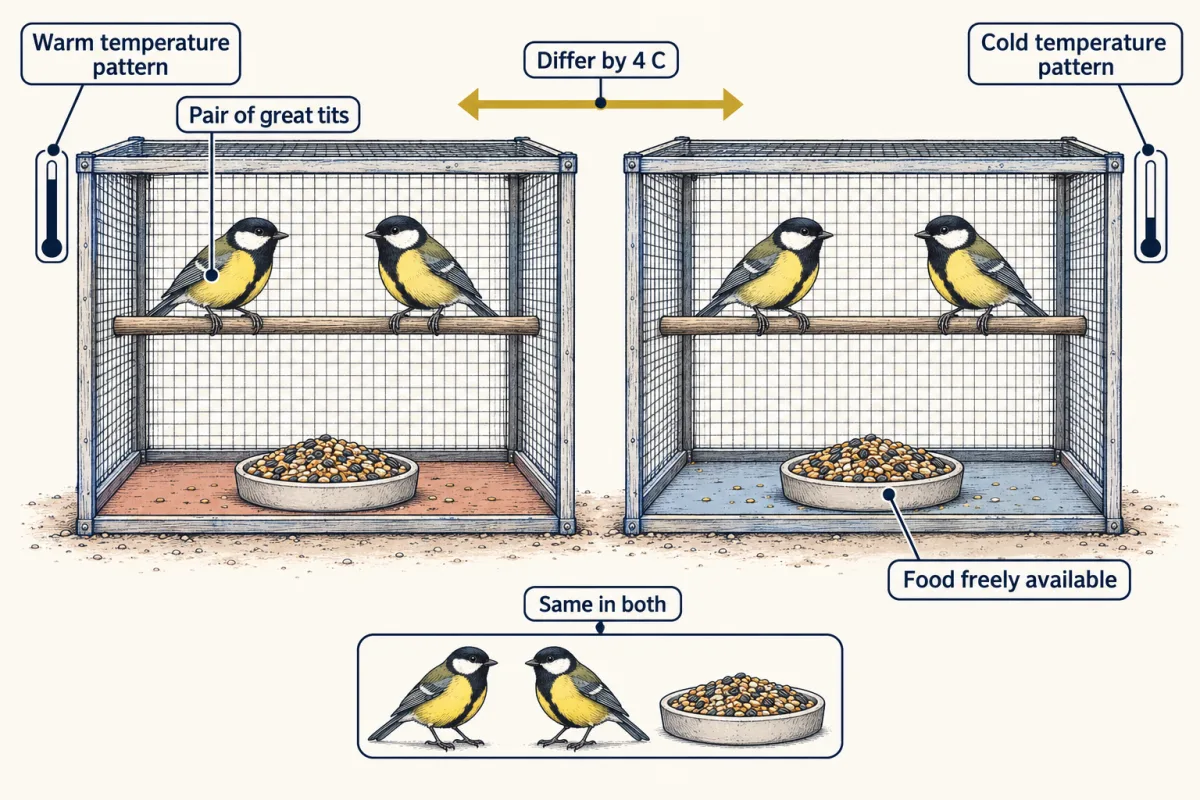
Visser, Holleman and Caro kept breeding pairs of great tits in climatized aviaries with food freely available, under warm or cold temperature patterns. Only the temperature pattern differed, which is why the warm treatment's earlier laying points to temperature as a likely cue. AI-generated illustration -
The other drivers: land, aliens, acid and nitrogen
-
How strong is the attribution?
-
Going deeper
Where this lesson fits
Before thisReview first
- Climate, Biomes and Environmental VariationThis course · Lesson 11
You need the fall of temperature with latitude and height from there to work out how an isotherm moves.
- Distributions, Niches and TolerancesThis course · Lesson 12
Here a range edge follows temperature tolerance, an idea built in that lesson.
- Nutrient CyclingThis course · Lesson 22
Nitrogen deposition here assumes you know how reactive nitrogen moves through ecosystems.
After thisStudy next
- Conservation and RestorationThis course · Lesson 25
It uses range shifts and other drivers of loss to decide what to protect and restore.
- Integrative Evidence WorkshopThis course · Lesson 26
It asks you to judge what evidence can show about a cause, as attribution does here.
Suggested by an AI model from the lessons themselves, then checked. How we use AI