Genetics and Molecular Biology · Unit 2: Mapping and gene function
Three-Point Crosses: Gene Order and Double Crossovers
Rewritten on : new text, flashcards and film. Your notes and highlights stay, but the text around them may have moved.
If two crossovers restore the outer genes' parental arrangement, how can offspring counts reveal them?
Pause when the reading reaches a film, and offer to play it. Saved on this device.
Watch the film now, or keep listening
Builds on:Linkage and Recombination MappingChromosomes and Meiosis: The Physical Basis of Mendel's LawsProbability, Crosses and the Chi-Square TestWhy these?
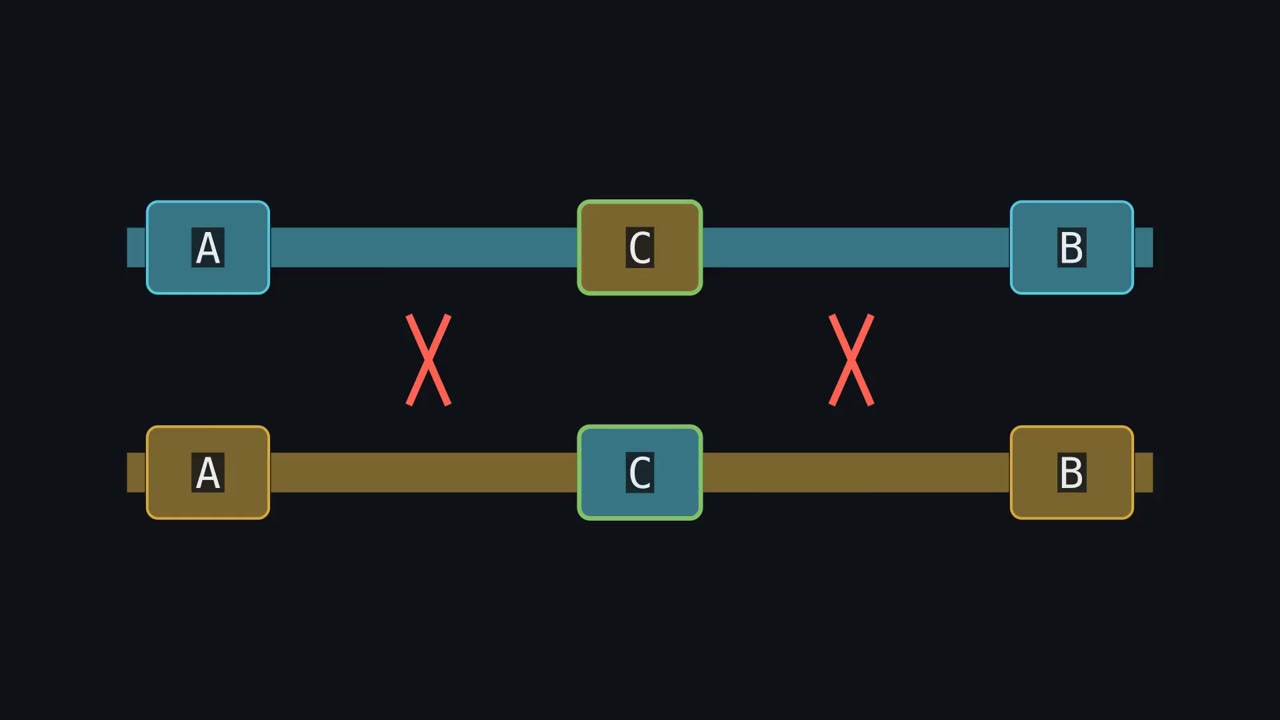 ▶ Watch The Marker in the Middle · 3:35
Read the transcript of “The Marker in the Middle”
Film transcript: The Marker in the Middle
Two crossovers can leave the outer markers looking untouched. How can offspring reveal a chromosome that switched twice? Follow one blue chromosome and one gold chromosome. Each carries three marker blocks in the same order. A red crossover point swaps the chromosome tails. One crossover changes the outer-marker combination. A second swap can restore it. Now place a green marker between the outer markers. After two swaps, the outer colours again match a parental chromosome. The green middle marker does not. It records the hidden double crossover. Cover the middle marker, and the double-switch product looks parental. Uncover it, and the mismatch appears.
The chromosome did not change between views. The third observation changed what the cross could detect. A test cross turns these chromosome patterns into offspring classes. The recessive tester contributes the same alleles every time.
Therefore each offspring phenotype reports one gamete from the heterozygous parent. Eight possible gametes become eight bars. The largest pair is provisionally parental, with no detected crossover. Two middle pairs represent single crossovers. The smallest pair is provisionally double crossovers. Rarity is a clue, not proof. Here are two parental patterns and two rare patterns from a schematic cross. Which marker must be in the middle?
Compare each rare pattern with the parental it resembles most. Only marker C differs in each matched pair. So C belongs in the middle, even though it is written last. The changed marker decided the order, not the written order. Unequal survival could still make another class unusually small. Move the changed marker into the centre, then rewrite every class in map order. Each single-crossover pattern now changes colour in one interval. Each double changes in both intervals. The class list has become a map. Count each single crossover in its own interval. Count every double crossover in both intervals, because each double crossed both. Divide each interval count by the total offspring, and express it in centimorgans.
The two adjacent distances then add along the map. Hide the green marker again. Both swaps restore the outer parental combination, so those doubles vanish from a two-point count. The map becomes too short. The middle marker is the witness that prevents that loss. This works when the classes are scorable and adjacent intervals are short. Long intervals can hide more.
Rarity is a clue, not proof. Check that rare classes survive and form a reciprocal pair. A middle marker makes double crossovers visible.
From the film
- A middle marker makes double crossovers visible.
- The largest pair is provisionally parental; the smallest pair provisionally represents double crossovers.
- Match each double to its closest parental; the only different marker lies in the middle.
- Count every double crossover in both adjacent intervals.
- Rarity is a clue, not proof: check that the rare pair is reciprocal and every class survives and is scored.
The first film showed why a two-gene count, as in linkage and mapping, misses two crossovers on one chromatid, and how a middle marker exposes them. A crossover exchanges segments between two non-sister chromatids in meiosis (see chromosomes and meiosis).
A locus is a gene’s place on a chromosome; its versions are alleles. A test cross mates the individual being studied with one homozygous recessive at every locus followed, so each offspring’s phenotype reads one gamete from the other parent.
The one idea. A middle marker makes double crossovers visible; comparing observed and expected doubles reveals crossover spacing.
Scope: a three-point test cross with scorable classes and short adjacent intervals. Unequal survival can upset the usual size ranking, and even three markers miss an even number of crossovers within one interval.
Read the eight classes in a fixed order
The first film sorted the eight classes into reciprocal pairs: parentals (no detected crossover), single crossovers in each interval, and double crossovers (one in each interval, usually smallest). Under independence, a double’s probability is the product of the two interval probabilities (probability and crosses), and the product of two small fractions is smaller still.
Worked problem. A female heterozygous for recessive mutations p, q and r carries p q r on one chromosome and + + + (normal alleles) on the other. She is test-crossed to a p q r / p q r male. Assume every class survives equally well, phenotypes are scored without error, and her phase, the alleles together on each chromosome, is known. The 1,000 progeny are listed alphabetically, not in map order:
- p q r: 350
-
-
- +: 342
-
-
- q +: 53
- p + r: 55
- p q +: 96
-
-
- r: 92
-
-
- q r: 7
- p + +: 5
Total: 350 + 342 + 53 + 55 + 96 + 92 + 7 + 5 = 1,000.
Step 1: find the parentals. The two largest classes, p q r and + + +, match the female’s two chromosomes.
Predict. The provisional doubles are + q r and p + +. Match each to its closest parental. Which gene is in the middle?
Check your prediction
- q r differs from p q r only at p, and p + + differs from + + + only at p. So p is in the middle, giving q–p–r. The alphabetical middle, q, is an outer gene.
A double crossover swaps only the gene between the two crossovers, and doubles are usually the rarest classes; check them against the parentals, and against viability, before trusting rarity alone. The counts are the lesson’s 1,000 progeny, assumed equally viable and scored without error.
Step 2: rewrite every class in map order, q to p to r, and note where each switches from one parental pattern to the other.
- Parentals: q p r (350) and + + + (342)
- Singles between q and p: q + + (53) and + p r (55)
- Singles between p and r: q p + (96) and + + r (92)
- Doubles: q + r (7) and + p + (5)
Rarity is a clue, not proof: a class can be small because its offspring survive poorly, as Sturtevant reported for one wing mutation in 1913. With short intervals and every class surviving and scored equally well, take the reciprocal pair with the smallest combined count as the doubles. The map-order sort then labels the singles but cannot confirm that choice: any reciprocal pair taken as the doubles sorts just as neatly. If survival or scoring may differ, seek independent evidence.
Step 3: calculate adjacent distances. Map distance is measured in centimorgans (cM), a frequency, not a length: for a short interval, 1 cM means about 1 gamete in 100 is recombinant. Count every double in both intervals:
distance (cM) = 100 × (single crossovers in the interval + double crossovers) / total
- q to p: (53 + 55 + 7 + 5) / 1,000 = 120 / 1,000 = 12.0 cM
- p to r: (96 + 92 + 7 + 5) / 1,000 = 200 / 1,000 = 20.0 cM
- q to r on the map: 12.0 + 20.0 = 32.0 cM
Predict. If you now ignore p and score only q and r, what recombinant percentage will you obtain? Will it equal 32.0?
Check your prediction
The doubles q + r and + p + carry parental q–r combinations, so only the 296 single crossovers count: 296 / 1,000 = 29.6%. The shortfall of 2.4 points is the 12 doubles counted once in each interval: 24 / 1,000.
Even 32.0 cM is a lower bound: two crossovers inside q–p or inside p–r, with no marker between them, still escape detection. That is why Sturtevant built maps from short adjacent intervals.
Twelve doubles turned up. Is that as many as chance predicts?
Read the transcript of “Do Crossovers Act Independently?”
Film transcript: Do Crossovers Act Independently?
The first film used a middle marker to expose double crossovers. Do those doubles occur as often as independent intervals predict? Keep the same blue and gold chromosomes, green middle marker, and red crossover points. Treat a crossover in each interval as an event. Under independence, multiply the two interval frequencies to predict double crossovers. The product fills an expected bar, marked schematic. Now compare an observed bar from the offspring with that expectation. Suppose the observed bar is shorter. Does that mean positive or negative interference?
Fewer doubles appeared than independence predicted. That is positive interference: a crossover in one interval is associated with fewer in its neighbour. The chromosome picture shows association, not a molecular cause. The coefficient of coincidence is observed doubles divided by expected doubles. Interference is the complement of coincidence.
Keep the pair together: coincidence measures what appeared; interference measures the departure from independence. Three comparisons organize the signs. Observed below expected gives positive interference. Equal bars give no interference. Observed above expected gives negative interference, an excess of doubles. That has been reported in some fungal and phage crosses. No single value holds everywhere. Interference usually weakens as the intervals lie farther apart. Observed doubles then approach the independent expectation. So the measurement belongs to one pair of intervals in one organism, not to a whole species. One cross gives an estimate, not a law.
A zero observed bar may reflect strong interference, a small sample, or missing classes. Check survival and scoring, then collect more offspring before claiming complete interference. Doubles have answered one question: how crossovers are spaced relative to each other. A second question is where along the DNA they fall. Answering it needs a second ruler. A genetic map records crossover frequency. A DNA ruler records physical length. Align them, and their spacing can disagree. Crossovers are not spread evenly, so equal DNA lengths can have different genetic distances. In humans and mice, many crossovers cluster in hotspots. A hotspot is a short DNA stretch with more recombination than nearby DNA.
The text below explains how hotspot positions are chosen and why that scope is not universal. Maps also change with the gamete maker and chromosome region. Female and male maps can differ. Some regions suppress crossovers. These patterns move the genetic marks without moving the underlying DNA sequence. Return to the two bars. Their comparison turns a hidden event into a spacing test, with scope limited to this interval pair. Comparing observed and expected doubles reveals crossover spacing.
From the film
- Comparing observed and expected doubles reveals crossover spacing.
- Under independence, expected doubles come from multiplying the adjacent interval frequencies.
- Coincidence is observed divided by expected; interference is one minus coincidence.
- Coincidence and interference describe one pair of intervals in one organism, not a species constant.
- Genetic distance reflects crossover frequency, not a fixed length of DNA.
Compare observed doubles with chance
The second film named the coefficient of coincidence, observed doubles over the number expected under independence, and interference, one minus coincidence.
Predict. The interval fractions are 0.12 and 0.20. Among 1,000 offspring, how many doubles does independence predict, and is that above or below the 12 observed?
Check your prediction
expected doubles = 0.12 × 0.20 × 1,000 = 24
coincidence = 12 / 24 = 0.50
interference = 1 − 0.50 = 0.50
Half the expected doubles appeared. This is positive interference: a crossover in one interval is associated with fewer crossovers in the neighbouring interval.
Interference of 1 means no doubles at all; a coincidence above 1 is negative interference, an excess of doubles, not an impossible result. These values describe one pair of intervals in one organism, not a species constant: interference tends to be strongest across short neighbouring intervals, and for intervals far apart, coincidence approaches 1. This is how visible doubles become a measure of crossover spacing.
Design problem
Predict. Another three-point test cross has 500 progeny, intervals of 6 cM and 10 cM, and no double-crossover progeny. A classmate concludes that interference here is complete. Using the independent expectation as a Poisson mean, calculate P(0), then repeat for 5,000 progeny. Is the classmate justified?
Saved in this browser only.
One way to do it
Independence predicts 0.06 × 0.10 × 500 = 3 doubles. A Poisson count with mean 3 is a good approximation for a rare event in many trials:
P(0) = e−3 = about 0.05
The exact binomial, (1 − 0.006)500, gives 0.049. So even without interference, about one cross in twenty this size shows zero doubles. Zero is suggestive, not strong evidence, and cannot distinguish complete interference from interference of 0.5, which predicts 1.5 doubles.
Score more progeny. With 5,000, independence predicts 30 doubles and P(0) = e−30, about 10−13. If none appear, interference is close to complete over these intervals; about 15 would indicate interference near 0.5. Also check that double-crossover classes survive and can be scored. Interference is plausible here, since it is strongest over short adjacent intervals like these.
Genetic distance is not DNA length
The second film’s two rulers disagree on spacing, as Sturtevant warned they might in 1913. In humans the genome-wide average is close to 1 cM per million base pairs, only a rough average. In humans and mice, most crossovers fall in hotspots, short DNA stretches with much more recombination than the DNA around them.
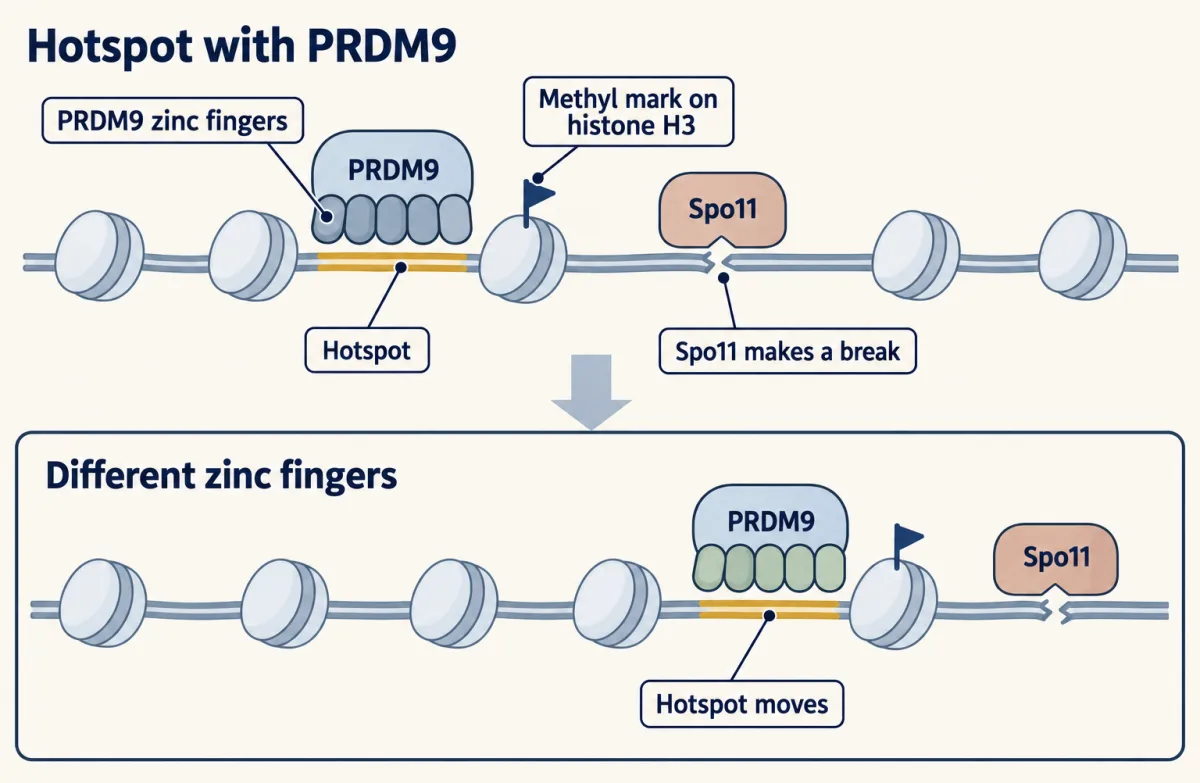
In 2010, three groups linked hotspot position to PRDM9, whose protein binds particular DNA sequences through zinc fingers and marks nearby sites where recombination starts (see DNA repair and recombination).
Predict. In humans or mice, if the zinc-finger array of PRDM9 changes, should the same DNA sites remain hotspots?
Check your prediction
Not necessarily: the bound sequences change, so hotspots move. People carrying different zinc-finger variants differed in which hotspots they used across the genome.
Not every animal works this way. Dogs lack working PRDM9, birds appear to lack the gene, and their hotspots tend to lie near promoter-like features such as transcription start sites and CpG islands. Budding yeast shows a similar placement and far more recombination per kilobase than humans.
Maps also differ by sex and region. Across the genome, the human female map is about 1.6 to 1.7 times the male map. Drosophila melanogaster males normally have no meiotic crossing over, although males of some species, including D. ananassae, do. That is why D. melanogaster mapping crosses use a triple-heterozygous female, as in the final fly question. Crossovers are suppressed near centromeres in many organisms, including Drosophila and Arabidopsis; in D. melanogaster females, rates also varied strongly along chromosomes and between strains.
Maps and sequence agree on order, not always on spacing. Use a genetic map to predict how often genes travel together; use sequence to measure how much DNA separates them.
Going deeper: when the simple comparison changes
Sturtevant showed in 1913 that doubles were scarcer than chance predicted. In 1915 he named the effect interference, crediting Hermann Muller with suggesting the name.
Positive interference is common, but not universal. Negative interference has been reported in some fungal and phage crosses. In Arabidopsis, one 2018 study measured interference of 0.64 for one interval pair; raising the dosage of the meiotic protein HEI10 lowered it to 0.34. In a 2016 sequencing study of Drosophila female meioses, noncrossover gene conversions, which exchange a short patch without exchanging the flanking DNA, did not show interference.
Your notes
Select any text in the lesson to highlight it or add a note to it. Your highlights and notes are saved in this browser and collected in your notebook.
This browser is not letting the site save anything (a private window or strict privacy settings), so highlights and notes will be lost when you leave the page.
How we measure it
Three-point test cross
An individual heterozygous at three linked loci is crossed to a tester homozygous recessive at all three. The tester adds only recessive alleles, so each offspring's phenotype reads out one gamete of the heterozygote, and the eight classes can be counted directly.
Cytological markers on chromosomes
A chromosome is made visibly different from its partner, for example by a knob at one end or a piece exchanged with another chromosome. Scoring both the visible chromosome and linked genes in the progeny tests whether genetic crossing over goes with a physical exchange of chromosome parts.
Dense SNP genotyping of progeny
Single-nucleotide differences between the two parental chromosomes are read in many offspring, or in the genomes of single offspring. A lasting switch from one parent's sequence to the other's marks a crossover to within the spacing of the markers, which places crossovers on the DNA sequence itself. A short switch that returns to the first parent marks a gene conversion instead.
Practice questions on this lesson (3) → MCAT-style, original, each with an explanation
Where this lesson fits
Before thisReview first
- Linkage and Recombination MappingThis course · Lesson 8
You need two-point recombination frequency and map distance from there before adding a third marker.
- Chromosomes and Meiosis: The Physical Basis of Mendel's LawsThis course · Lesson 2
Crossovers between non-sister chromatids in meiosis are what produce the recombinant classes you count here.
- Probability, Crosses and the Chi-Square TestThis course · Lesson 3
Expected doubles come from multiplying independent probabilities along a path, as practised there.
After thisStudy next
- DNA Repair and RecombinationThis course · Lesson 15
It explains how crossovers and gene conversion start, which underlies hotspots and interference seen here.
- Complex Traits, Heritability and GWASThis course · Lesson 26
It uses recombination between markers and traits to localize genes in whole genomes.
Suggested by an AI model from the lessons themselves, then checked. How we use AI
Finish line
Test yourself
8 questions
Practice and MCAT-style, with explained answers.
Next · Lesson 10
Complementation and Gene Function: From Beadle and Tatum to Benzer
Two pure-breeding white-eyed flies can have red-eyed offspring. What does that tell you about their genes?
Continue →