Cell Biology · Skim version
Microscopy and Quantitative Images
Read the full lesson → Skim the whole course →
The guiding idea
Two GFP-filled vesicles 150 nm apart look like one blob in the best ordinary light microscope. Zooming in will not split them. Why not?
Why can an ordinary light microscope not separate two vesicles 150 nm apart, however much you enlarge the picture?
From the film: What Zoom Cannot Recover
- In ideal widefield fluorescence, every point becomes a blur.
- In the ideal lateral model, the Rayleigh distance gets smaller with shorter emission wavelength or higher numerical aperture.
- For two ideal points, the Rayleigh distance marks a clear dip, not the first appearance of two peaks.
- Software zoom cannot add detail the optics and camera never captured.
From the film: What an Overlap Can Claim
- A controlled, in-focus colour overlap supports proximity at roughly one resolution volume.
- In the green-light exercise, that volume is about 230 nm across and 800 nm deep, containing tens of thousands of proteins at typical cellular density.
- Overlap means something only if the label, the channels and the record each pass their controls.
- Colour overlap supports proximity, not binding; binding needs other experiments.
-
Put numbers on the blur
-
Change the measurement, not the zoom
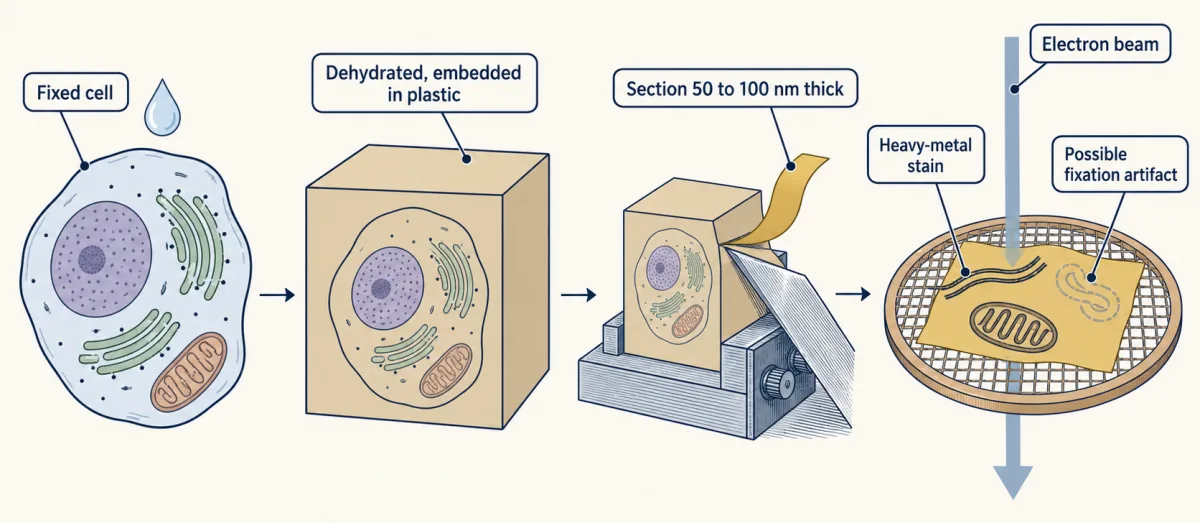
A thin-section electron micrograph is a two-dimensional projection of dead, prepared tissue, so a structure that fixation could have made must be checked with a second method. For conventional transmission EM, cells are chemically fixed, dehydrated, embedded in plastic, cut into sections about 50 to 100 nm thick and stained with heavy metals. AI-generated illustration 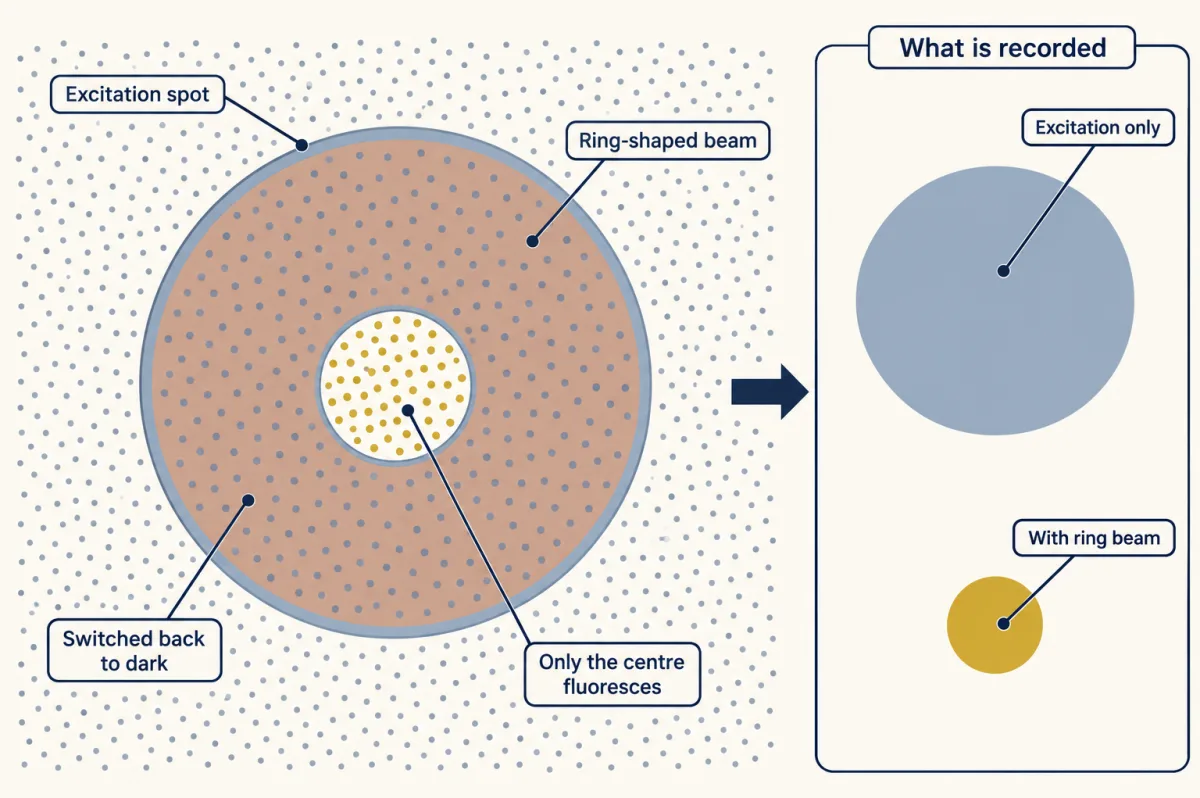
STED beats the blur by controlling which molecules glow, not by shrinking the beams: diffraction still sets their size. A ring-shaped beam forces excited dye molecules back to the dark state by stimulated emission, leaving only a small centre fluorescent. AI-generated illustration -
Read the image as a claim
-
Going deeper
Where this lesson fits
After thisStudy next
- Experiments That Distinguish MechanismsThis course · Lesson 3
It turns image-reading controls into experiments that test where a protein lives and whether it causes a defect.
- Membrane Organization and TopologyThis course · Lesson 4
It uses fluorescence and FRAP measurements, so careful image reading from here applies directly.
- Designing a Cell Biology ExperimentThis course · Lesson 26
It extends the controls and what-can-be-claimed reasoning to designing a full cell biology experiment.
Elsewhere on the siteFilms, simulations and method films in other courses
- What a Microscope Can ShowFilm · Biology
It shows that magnification makes an image bigger while resolution decides how much detail it holds.
- Zoom and resolveSimulation · Biology
You can zoom and resolve to see how the light-microscope limit stops two close points separating.
- The Size TestFilm · Life Science
It shows the size limit of what the eye can make out and why a microscope is needed.
Suggested by an AI model from the lessons themselves, then checked. How we use AI