Ecology and Evolution · Skim version
Island Biogeography
Read the full lesson → Skim the whole course →
The guiding idea
Empty an island of every insect and spider. How many species come back, and are they the same ones?
An island's species count changes at the rate new species arrive minus the rate resident species are lost, so it settles near where the two rates are equal while the species themselves keep being replaced.
From the film: Two Rates, One Crossing
- An island's species count changes at the rate new species arrive minus the rate resident species are lost.
- Arrivals of new species slow as the island fills and losses speed up, so the count settles near where the two rates are equal.
- A farther island receives fewer new species and a smaller island loses species faster; both lower the equilibrium number, S*.
- At equilibrium species keep arriving and disappearing at the same rate, the turnover, so the count holds roughly steady while the list changes.
- This is a model: it leaves out new species forming on the island, real curves need not be straight, and it predicts how many species, not which ones.
From the film: Emptying Islands
- Simberloff and Wilson censused the arthropods on six small red mangrove islands in the Florida Keys, removed them by fumigation under a tent, and censused again for a year.
- By about day 250, all but the most distant island, E1, held species numbers similar to untreated islands, though population densities were still abnormally low.
- The returning species were not all the ones present before, and in the second year arrivals and losses continued while the count changed little.
- The Jaccard similarity, species shared divided by species in either list, separates which species are present from how many.
- A steady count with a changed list fits a dynamic equilibrium without proving its mechanism, and census gaps make the measured rates rough.
-
Two rates and a crossing
-
Working the numbers
-
Testing it: emptying islands in the Florida Keys
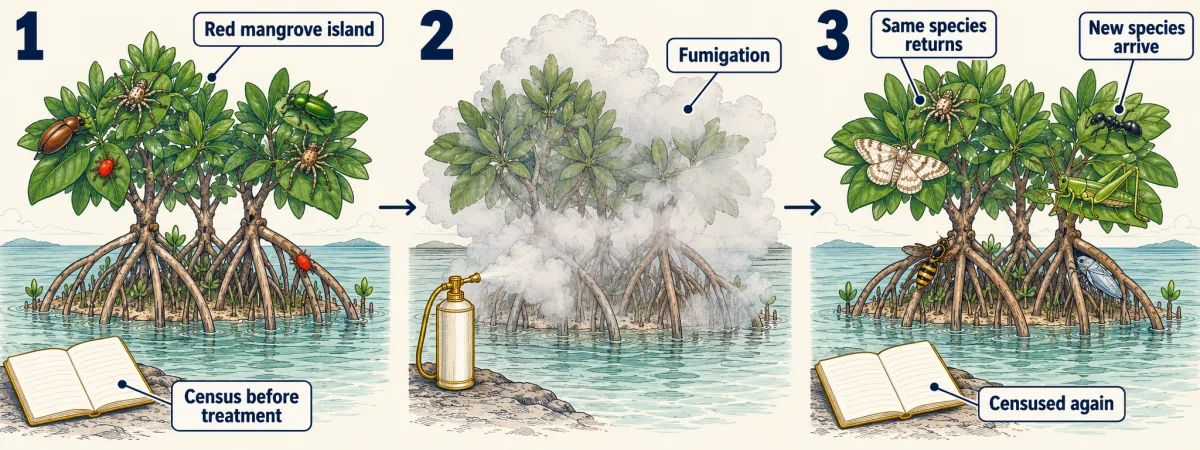
Emptying an island lets the model's rates be watched more directly than natural islands allow: census (count) the arthropod species (insects, spiders, mites and relatives), remove them by fumigation (gassing) under a tent, then census again as species return. Schematic: the tent is not drawn and the animals are generic. AI-generated illustration -
Same number, different species
-
Fragments, area and connectivity on land
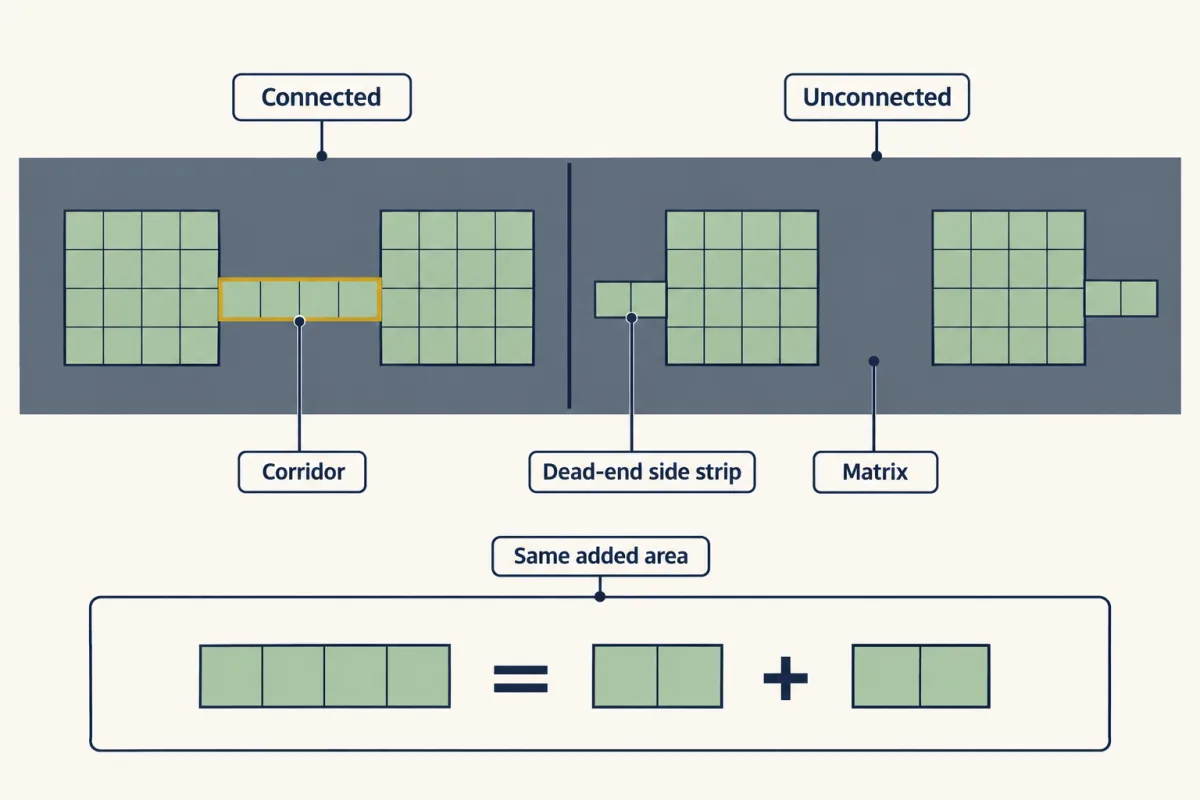
A corridor's effect can be separated from the area it adds by giving unconnected patches dead-end side strips of equal combined area and matching edge-to-area ratio (how much border a patch has for its size), as in the longleaf pine savanna experiment (some controls were plain rectangles). Schematic, not the experiment's map: it gives each unconnected patch a single strip. AI-generated illustration -
Going deeper
Where this lesson fits
Before thisReview first
- Population Growth and RegulationThis course · Lesson 14
You need rates of gain and loss setting a population's size, and the logistic balance point, before applying them to species counts.
- Distributions, Niches and TolerancesThis course · Lesson 12
You need to know why species occur where they do and fail to reach other places before reading immigration rates.
After thisStudy next
- Conservation and RestorationThis course · Lesson 25
This lesson sends you there to apply area, isolation and corridor results to reserve design.
- Global Change: Species on the MoveThis course · Lesson 24
Shrinking habitat and range shifts use the same arrival-and-loss rates to judge which species persist.
Elsewhere on the siteFilms, simulations and method films in other courses
- Occupancy modelling and eDNA surveysMethod film
Island censuses miss species, and this method shows how to judge presence when detection is imperfect.
Suggested by an AI model from the lessons themselves, then checked. How we use AI