Cell Biology · Skim version
Cell Identity, Cell State and Disease
Read the full lesson → Skim the whole course →
The guiding idea
Much of the lining of an older person's healthy oesophagus can carry mutations found in cancer. Why is it still healthy?
Healthy oesophagus can be full of mutant clones.
From the film: Fate, Not Speed
- In mouse oesophagus, only the basal layer divides; each daughter stays a progenitor or differentiates, moves up and is shed.
- In normal lining the three outcomes, PP, PD and DD, are balanced, so on average each division leaves one progenitor behind.
- In these mouse experiments, Notch1-deficient clones expanded without a higher average division rate; EdU tracking fits an average shift toward keeping more progenitor daughters.
- The clone gains room as neighbours at its edges differentiate and leave.
- In this mouse lining, the tissue changed because which cells are there changed; on average, the mutant cells divided no faster.
From the film: The Mix Moves the Average
- For amounts expressed per cell, a bulk measurement is a weighted average over the cells in the sample.
- If cell groups differ in per-cell RNA level, changing their proportions shifts that average even when within-group levels stay fixed.
- Single-cell RNA sequencing copies captured RNA into barcoded DNA, produces gene-by-cell counts and clusters similar expression profiles.
- A cluster is an observation that may reflect a cell type, a state or an artifact; what it represents is a hypothesis to test.
-
Fate, not speed: the bookkeeping
-
Rate or fate? The mouse experiment
-
Neighbours keep the count
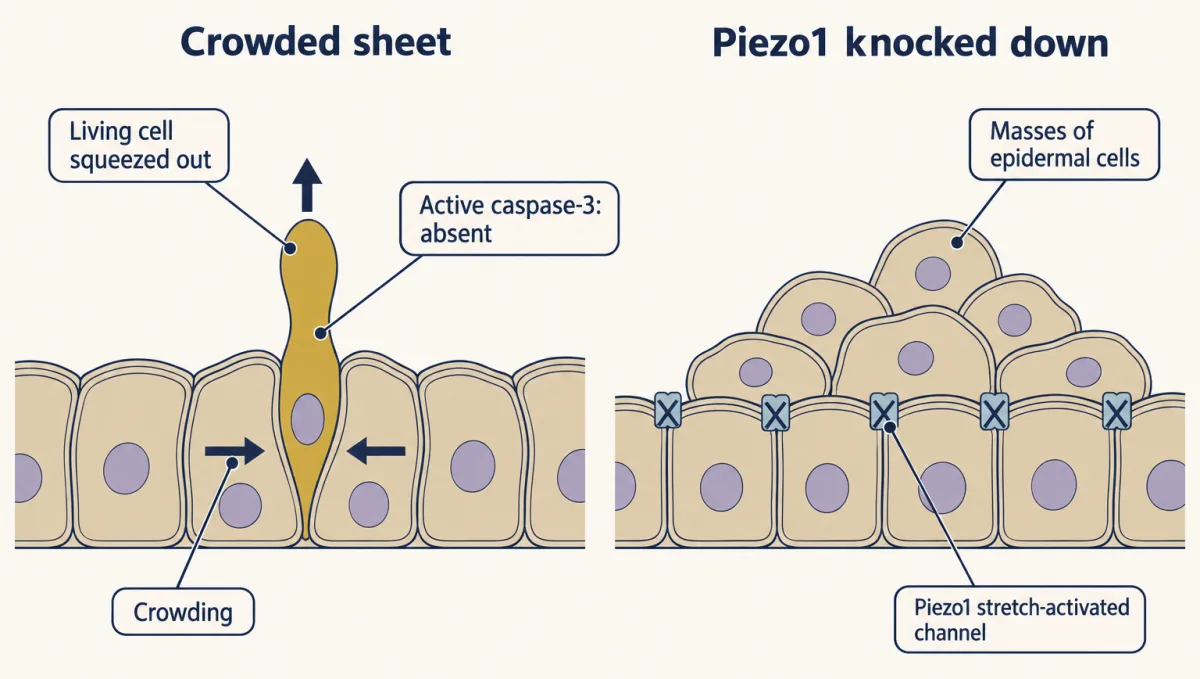
In crowded epithelia, living cells are squeezed out and most lack active caspase-3. Knocking down Piezo1 in zebrafish blocks extrusion and masses of epidermal cells form. AI-generated illustration -
Seeing the mixture
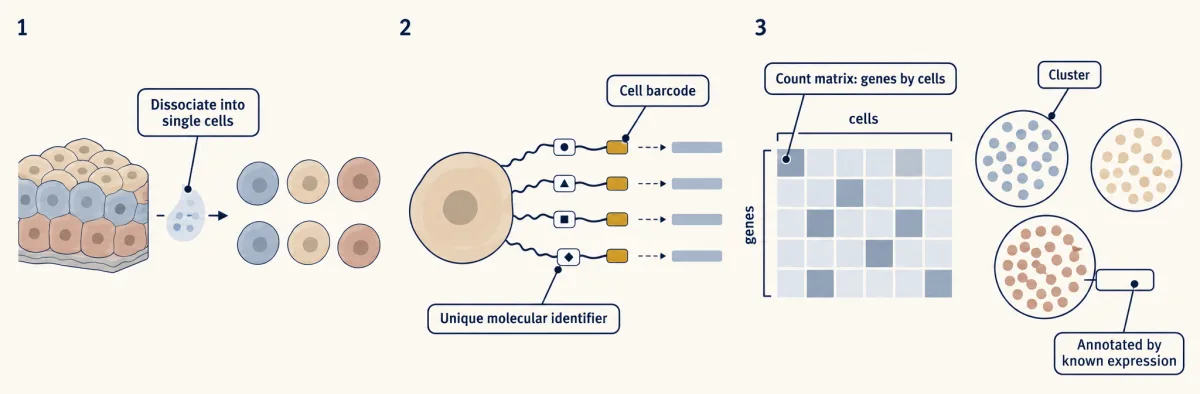
Single-cell RNA-seq in three steps: separate the cells, tag every molecule with its cell's barcode, then count molecules into a genes-by-cells matrix that is clustered and annotated. AI-generated illustration -
Type, state or artifact?
-
From description to cause
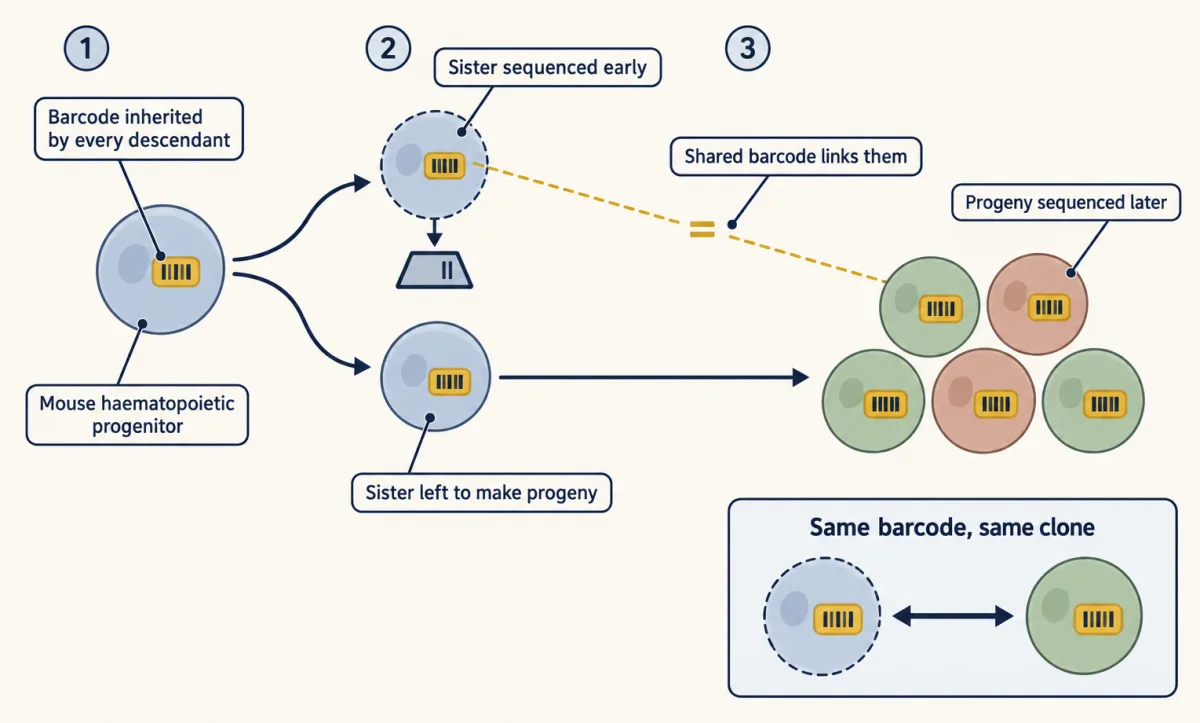
Sisters share an inherited barcode. One is sequenced at once, the other is left to make progeny, and the barcode matches the early RNA profile to the clone's later fate. AI-generated illustration -
Going deeper
Where this lesson fits
Before thisReview first
- Stem Cells and Tissue RenewalThis course · Lesson 24
You need progenitor and daughter-fate bookkeeping (PP, PD, DD) from there to follow how a clone expands.
- Cyclin-CDK Control of the Cell CycleThis course · Lesson 17
You need to know what division rate means and what drives cycling to separate speed from fate.
- Experiments That Distinguish MechanismsThis course · Lesson 3
This lesson reuses its logic of testing mechanisms by perturbation and ordering of events.
After thisStudy next
- Designing a Cell Biology ExperimentThis course · Lesson 26
You apply the same skill of choosing controls and units to show that one thing caused another.
Elsewhere on the siteFilms, simulations and method films in other courses
- Bomb-pulse carbon-14 dating of cellsMethod film
It dates when human cells were born, a way to measure turnover and renewal in tissue.
- Drift and selection: replicate populationsSimulation · Genetics and Molecular Biology
It shows how random chance in small populations makes some lineages spread and others vanish, like single clones.
Suggested by an AI model from the lessons themselves, then checked. How we use AI