Ecology and Evolution · Skim version
Biodiversity and Ecosystem Function
Read the full lesson → Skim the whole course →
The guiding idea
Grassland plots sown with sixteen species generally out-grew plots with one, yet the species inside them were, on average, less steady from year to year. How can the total be steadier than its parts?
A grassland plot's production is the sum of its species, and in experiments that assigned richness at random, more species generally raised that sum and steadied it from year to year; how much steadier depends on the species' sizes and swings and on how far they rise and fall together.
From the film: A Field Is a Sum
- A plot's total production is the sum of what each of its species produces.
- A mixture yields extra when it beats the yield expected from its monocultures; with an even sowing that benchmark is the average monoculture, not the best.
- Extra yield can come from species doing better together on average (complementarity) or from high-yielding species gaining the most relative to their yield alone (selection); a richer draw is more likely to include such species, and both can act at once.
- With four equal species swinging independently, their swings partly cancel and the total is twice as steady as one species.
- If all the species rose and fell together, nothing would cancel; assigning richness at random keeps soil or water from systematically lining up with richness.
From the film: Ten Years at Cedar Creek
- At Cedar Creek, 168 plots were sown in 1994 with 1, 2, 4, 8 or 16 species drawn at random from a pool of 18, with the same seed mass in every plot.
- Because richness and composition were assigned at random, soil differences and the experimenter's choices are not expected to explain the consistent rise in biomass with richness.
- Partitioned year by year over 1996 to 2005, the extra yield shifted from selection toward complementarity, and by the end selection was strongly negative.
- In richer plots species varied proportionally more from year to year on average, yet the plot's total varied proportionally less.
- The analysis found no evidence of a covariance effect; statistical averaging and a higher mean explained the steadier total.
-
The question: does richness change what an ecosystem does?
-
Building communities at random: Cedar Creek and BIODEPTH
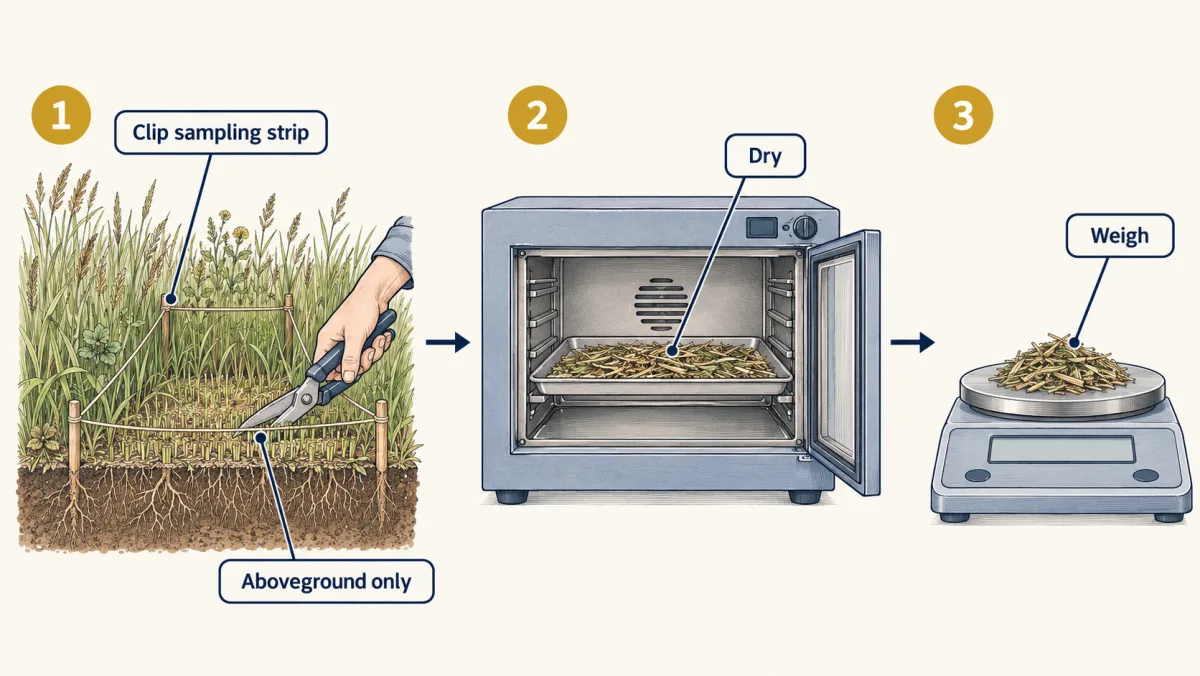
Each year's biomass came from clipping the aboveground vegetation in sampling strips, drying it and weighing it. AI-generated illustration 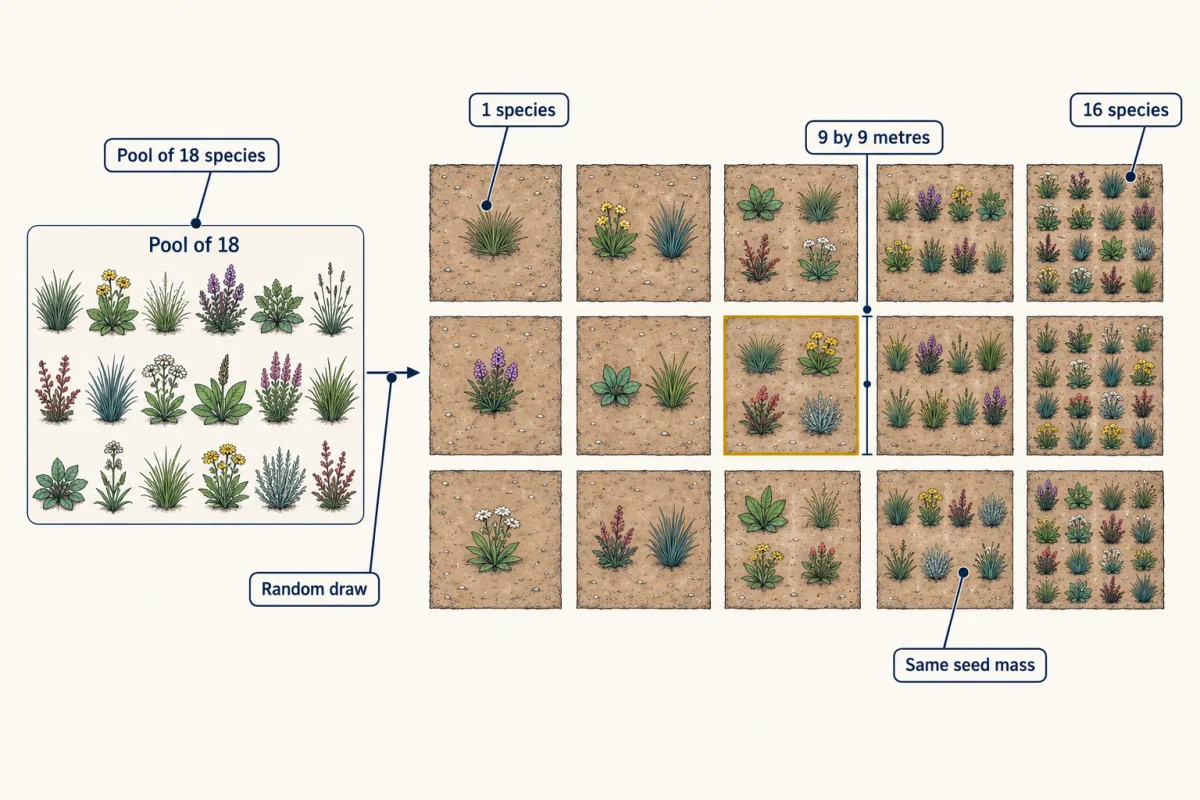
Assigning richness at random, with equal seed in every plot, means a consistent difference between richness levels is not expected to come from soil or from species the experimenter picked. Simplified; the real experiment had 168 plots. AI-generated illustration -
Splitting the extra yield (worked problem)
-
Stability: how to score it, and when cancelling fails
-
Beyond the plots
-
Going deeper
Where this lesson fits
Before thisReview first
- Energy Flow and ProductivityThis course · Lesson 21
Primary productivity, the function measured here, is defined and budgeted there.
- Diversity, Disturbance and SuccessionThis course · Lesson 19
You need richness as a diversity measure from there to read the species-number axis.
- CompetitionThis course · Lesson 16
Niche differences between competitors are what resource partitioning, a source of complementarity, rests on.
After thisStudy next
- Global Change: Species on the MoveThis course · Lesson 24
It asks what shifting species ranges do to communities, building on what richness does for ecosystem function.
- Conservation and RestorationThis course · Lesson 25
It uses the result that richer communities function better to ask what losing species may cost.
Suggested by an AI model from the lessons themselves, then checked. How we use AI