Biology · Unit 4: DNA and inheritance
Beyond Dominant and Recessive
Rewritten on : new text, flashcards and film. Your notes and highlights stay, but the text around them may have moved.
Why does a red snapdragon crossed with a white one give pink flowers, while a red Shorthorn bred with a white one gives a calf with red and white hairs side by side?
Pause when the reading reaches a film, and offer to play it. Saved on this device.
Watch the film now, or keep listening
Builds on:Mendel and Punnett SquaresMeiosis and VariationWhy these?
Where this lesson sits
- Virginia SOL BIO.5c
- Practices BIO.1c, BIO.1d, BIO.1e, BIO.1f
Essential question: What happens when neither allele is fully dominant, and how do scientists trace traits through families and chromosomes?
-
Life Science (grade 7) LS.10 b and c
Review it at grade 7 level
In Life Science you learned that you get one allele of each gene from each parent. A dominant allele hides a recessive one, so a plant with one of each looks like the dominant parent. Your genotype is the pair of alleles, and your phenotype is the trait that shows. You used Punnett squares for one trait, and each sex cell carried either allele with a 50 percent chance. Biology adds alleles that do not fully hide each other, family charts called pedigrees, and pictures of whole chromosomes called karyotypes.
-
Biology BIO.5c You are here
This lesson
-
Biology II Biology II: Advanced Survey of Biology Topics, BIOII.4 c-f; Genetics, GEN.4 b and GEN.5 b
Preview where it goes next
This lesson kept mostly to two-allele crosses, with a first look at the three ABO alleles, and to genes on the 22 autosome pairs. Biology II goes further. The ABO gene has three common alleles, so it becomes a full multiple-allele problem. Genes on the X chromosome give sex-linked patterns, with their own pedigree signatures and crosses. Genes close together on one chromosome are linked, and how often they separate lets geneticists build chromosome maps. Many traits depend on several genes, and one gene can mask another. The Genetics course also studies karyotype changes beyond an extra or missing chromosome: duplications, deletions, translocations and inversions.
-
College
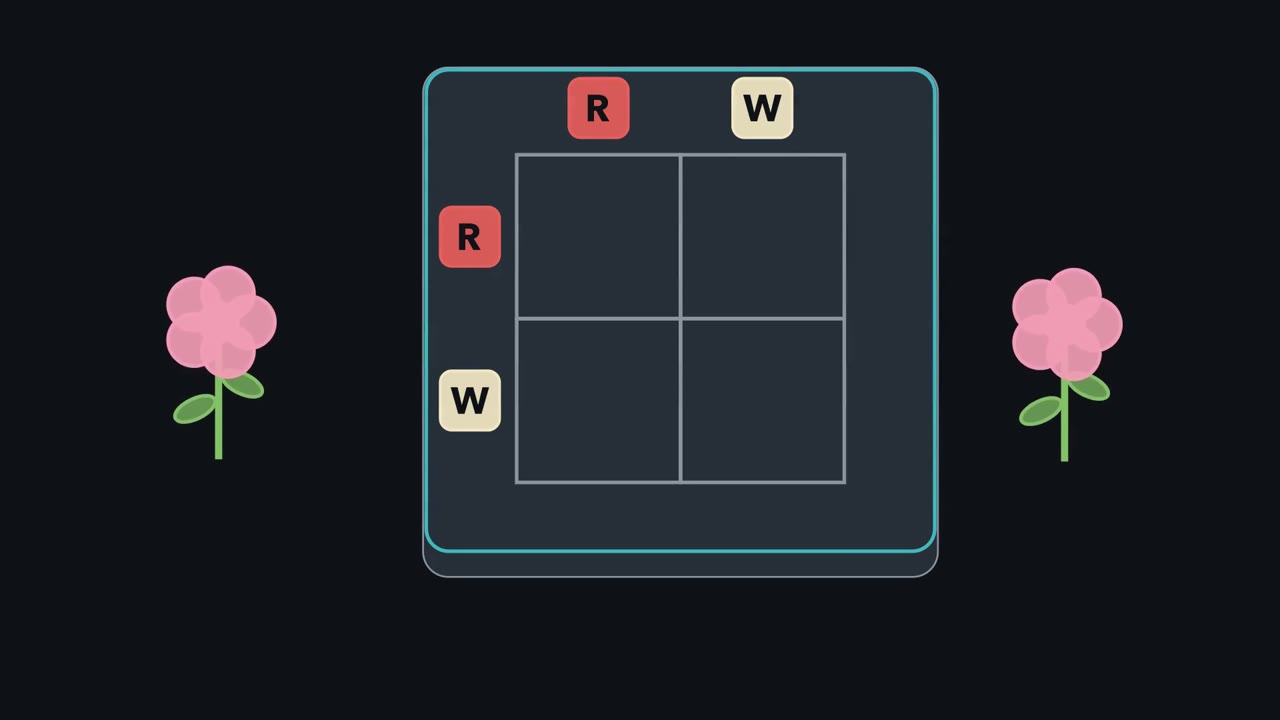 ▶ Watch One Cross, Three Patterns · 3:21
Read the transcript of “One Cross, Three Patterns”
Film transcript: One Cross, Three Patterns
How can the same offspring genotypes make groups that look different? Watch pink snapdragons send their allele copies into an empty grid. The copies will stay fixed while the phenotype rule changes around them. The screen will track inherited copies separately from the visible traits they help produce.
An allele is a version of a gene. Each parent can pass its R allele or its W allele. The grid tracks every pairing. It does not decide what each pairing looks like. Keeping those jobs separate is the key to reading the result. Before the tiles land, predict the combinations.
Which pairing repeats, and which pairings appear at the corners? Hold your answer while the tiles keep moving. Look for repeated paths rather than guessing from the parents' pink color. The tiles land as RR, RW, RW, and WW. The mixed pairing appears twice. This genotype pattern comes from allele separation, so changing the phenotype rule cannot change the grid. The parents' pink phenotype never fused their R and W allele copies. Now place an incomplete-dominance lens over the grid. RR becomes red, WW becomes white, and RW becomes pink. Every genotype has its own phenotype here, so the phenotype pattern matches the genotype pattern. The color looks blended, but the inherited copies remain distinct inside each plant.
Codominance needs a different gene, so switch to Shorthorn cattle. The same three pairings give red, roan and white coats. A roan RW calf grows red hairs and white hairs side by side. The mixed genotype shows both effects instead of an in-between color. The allele pairings still do not move. Alleles remain separate, and each genetic tool reveals a different scale. The grid reveals allele combinations. A phenotype key reveals how each combination appears. Confusing those views makes pink look like permanent blending. The tool must match the question you are asking. The same separation helps with blood type. A population has three common ABO alleles, but each person carries a pair.
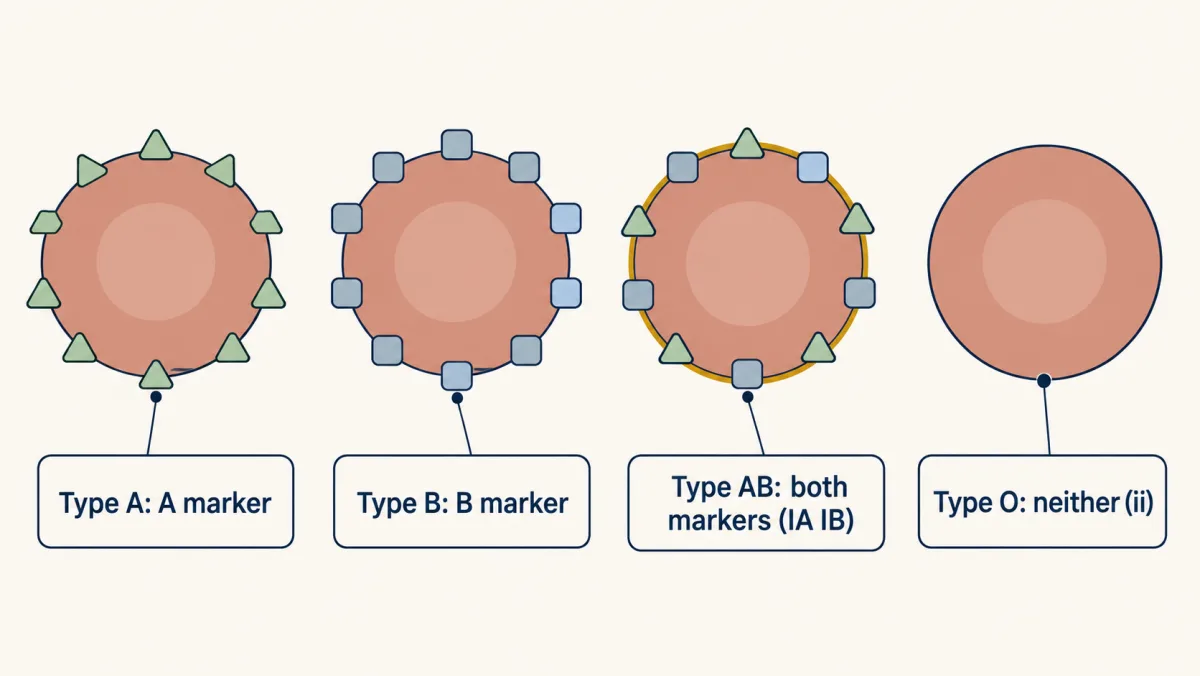
Type AB red blood cells display both A and B markers, a codominant phenotype. Type O cells display neither marker, while type A or B displays its matching marker. So do not ask which allele won. Ask which alleles were inherited, then ask what that pair does to phenotype. The first answer comes from the cross. The second comes from the inheritance pattern. That order keeps inheritance separate from the way a trait is displayed.
From the film
- Alleles remain separate; the pattern sets only how each pair shows.
- In incomplete dominance the heterozygote shows an in-between phenotype, as in pink snapdragons.
- In codominance the heterozygote shows the effects of both alleles, as in roan Shorthorn cattle.
- When every genotype has its own phenotype, the genotype and phenotype ratios match.
- The ABO gene has three common alleles, and each person carries two.
In Mendel and Punnett squares, a dominant allele hid a recessive one. Pink snapdragons and roan calves break that rule. The first film showed why: the allele pairings stay fixed, and only how each pairing shows changes.
Guiding idea: alleles remain separate, and each genetic tool reveals a different scale. It holds for the one-gene crosses, pedigrees and karyotypes here. The environment can also change a phenotype, pedigree clues do not prove a model, and a karyotype cannot show alleles.
What do you think? Decide before you read.
-
Scientists disagree: Crossing two pink snapdragons brings back red and white flowers. The color looks mixed, but each allele stays separate and can be passed on.
What scientists think
Scientists disagree: Crossing two pink snapdragons brings back red and white flowers. The color looks mixed, but each allele stays separate and can be passed on.
-
Scientists disagree: Dominant means one copy is enough for a trait to show. Dominant alleles can cause disease, and medical geneticists track them in families. Real counts show recessive traits can be common and dominant traits rare.
What scientists think
Scientists disagree: Dominant means one copy is enough for a trait to show. Dominant alleles can cause disease, and medical geneticists track them in families. Real counts show recessive traits can be common and dominant traits rare.
-
Scientists disagree: Most chromosomes carry hundreds to thousands of genes, too small to see. Lab guides say karyotypes show chromosome number, size, shape and only large changes.
What scientists think
Scientists disagree: Most chromosomes carry hundreds to thousands of genes, too small to see. Lab guides say karyotypes show chromosome number, size, shape and only large changes.
Explore: switch one cross between three patterns
Choose two parents and build their Punnett square. Switch among complete dominance, incomplete dominance and codominance without changing the genotypes. A real gene does not switch; the switch compares the rules on one grid.
1. One cross, three patterns
| Group | Expected | Observed |
|---|
2. A family pedigree
Press a person to shade them as showing the trait. Press again to clear. Then read which model fits.
Square = male. Circle = female. Shaded = shows the trait. Numerals I to III label generations, numbers label people within a generation.
In this sketch: one gene with two alleles, R and W, on an autosome. Each parent passes on one of its two alleles with equal chance. Observed counts are random, so Grow gives new counts each time.
The Punnett square gives the genotypes. The pattern only decides which phenotype each genotype shows, and the alleles never blend. Pedigree clues are not proofs.
Try this. Predict each result before you test it. Cross RR × WW in all three modes. Grow 100 RW × RW offspring and compare with the expected counts. Switch modes on the same cross: which counts change, and which stay the same? Finally, in the pedigree panel, shade a child of two unshaded parents and test both models.
Explain: when neither allele hides the other
- allele
- heterozygous
- homozygous
- genotype
- phenotype
- incomplete dominance
- codominance
- multiple alleles
- pedigree
- carrier
- karyotype
- autosome
An allele is one version of a gene. A homozygous organism has two of the same allele, and a heterozygous organism has two different alleles. Your genotype is your pair of alleles, and your phenotype is the trait that shows.
For snapdragon flower color, R is the red allele and W is the white allele. Both are capitals, so neither symbol suggests that one hides the other.
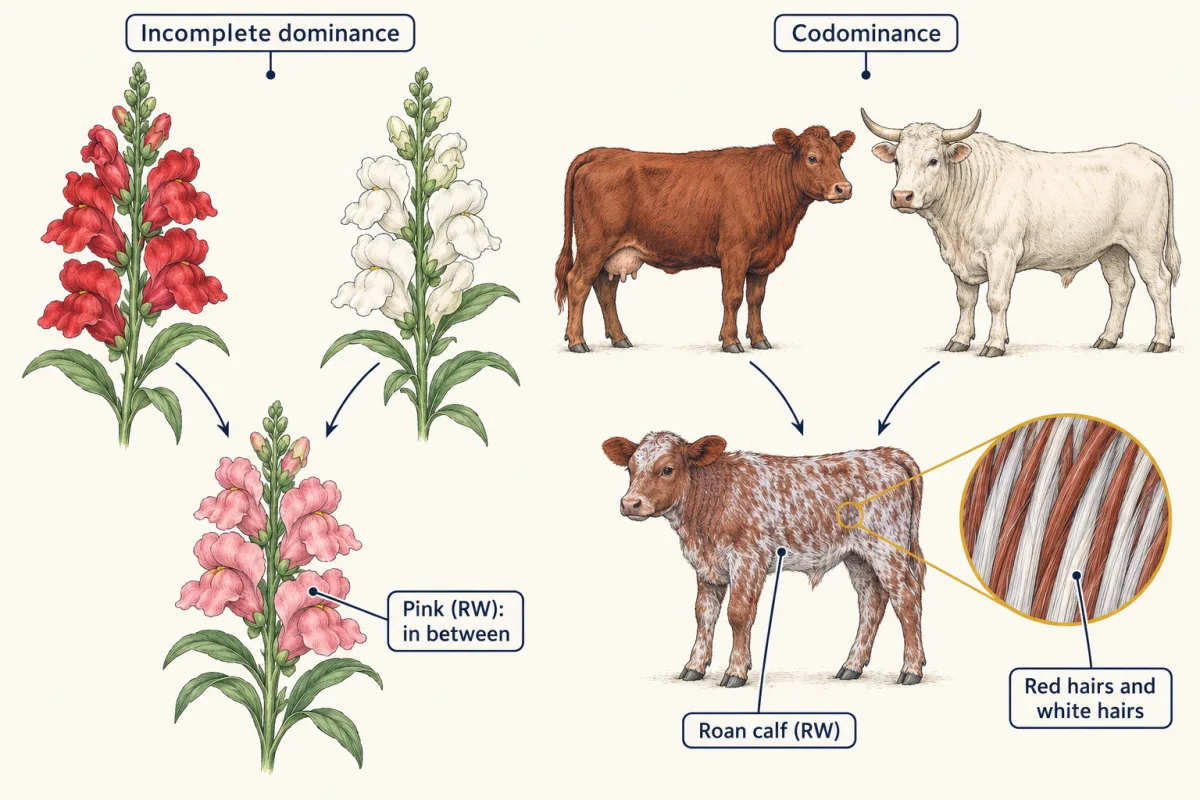
Incomplete dominance means the heterozygote shows a phenotype in between the two homozygotes, as in pink RW snapdragons. Pink looks like mixed paint, but paint stays mixed. A pink plant still passes a separate R or W to each sex cell.
The first film’s pink × pink grid:
| R (1/2) | W (1/2) | |
|---|---|---|
| R (1/2) | RR, red | RW, pink |
| W (1/2) | RW, pink | WW, white |
genotype ratio 1 RR : 2 RW : 1 WW, and phenotype ratio 1 red : 2 pink : 1 white
Red and white return: the alleles never blended.
Predict. Cross a pink RW snapdragon with a white WW snapdragon. Which colors should appear, and in what ratio?
Check your prediction
The pink parent passes R or W; the white parent passes W. Expect pink and white offspring 1:1, on average.
Codominance means the heterozygote shows the effects of both alleles. Snapdragon color is not codominant, so the first film switched to roan Shorthorn cattle; roan × roan gives 1 red : 2 roan : 1 white on average.
ABO blood type adds multiple alleles: a population can have more than two versions of a gene, although each person carries only two. The ABO gene has three common alleles, IA, IB and i. The table adds the genotypes the first film skipped.
| Blood type | Genotypes in the usual model | Markers on red blood cells |
|---|---|---|
| A | IA IA or IA i | A |
| B | IB IB or IB i | B |
| AB | IA IB | A and B |
| O | ii | neither |
IA and IB are codominant, and each is dominant to i.
Predict. In the usual model, what blood types can children have if one parent is type AB and the other is type O?
Check your prediction
The AB parent passes IA or IB; the O parent passes i. Expect type A or B, about half of each.
The environment can change a phenotype too.
Predict. Must genetically matched bigleaf hydrangea cuttings have the same flower color if they grow in soils with different acidity?
Check your prediction
No. In many bigleaf hydrangeas, the same plant has bluer flowers in acidic soil and pinker flowers in less acidic soil.
Every prediction so far came from a cross someone could plan. Nobody plans crosses between people, so human genetics needs wider views: families first, then whole chromosomes. The second film makes that change.
Read the transcript of “From Families to Chromosomes”
Film transcript: From Families to Chromosomes
The first film kept allele tiles separate while the phenotype changed. How can we follow those copies when people cannot be crossed for an experiment? We must use evidence that already exists, then match each question to the right scale. Each view can answer only some questions.
A pedigree turns a family into a model. Squares and circles stand for people, and shading marks the chosen trait. Lines connect partners and children. Generations stack downward, letting a pattern unfold through time. The shape is a symbol, not a genotype. The parents do not show the trait, yet their child does. Which simple model fits this clue better: dominant or recessive? Hold both possibilities beside the family before you decide.
A recessive model can fit. Each unshaded parent may carry a recessive allele, and the child may receive both copies. This pattern points toward recessive inheritance, but a small family does not prove it. The parents are carriers in this simple model. Geneticists test a model against every person, not a striking branch. A dominant trait usually appears in each generation, and a shaded child usually has a shaded parent. A new DNA change can be an exception. A small family can still fit several explanations. Alleles remain separate, and each genetic tool reveals a different scale. A pedigree works at the family scale. It can test inheritance models, but it cannot show the allele copies directly.
Now zoom from a person into a cell with a nucleus. A karyotype sorts photographed chromosomes into matched pairs by size and shape. It answers questions about whole chromosomes and large changes. Matched partners make an extra or missing copy visible. An extra chromosome is large enough to count. A single gene, such as the ABO gene, is far too small to identify here. The picture can reveal scale-sized changes, not every inherited detail. A karyotype cannot identify a person's ABO alleles. Nearly every body cell with a nucleus carries the same DNA and genes.
Skin and muscle cells differ because they use different gene sets. Mature red blood cells lose their nuclei, leaving no chromosomes to count. Start with the question, then choose the view. Use a cross for possible allele combinations, a pedigree for family patterns, and a karyotype for whole chromosomes.
No view can answer every genetics question. Match the tool to the scale of evidence.
From the film
- Each genetic tool reveals a different scale: cross, family or whole chromosome.
- A pedigree tests inheritance models against people across generations.
- Pedigree clues are not proof, especially in a small family.
- A karyotype shows whole chromosomes and large changes, not single alleles.
Explain: reading a family pedigree
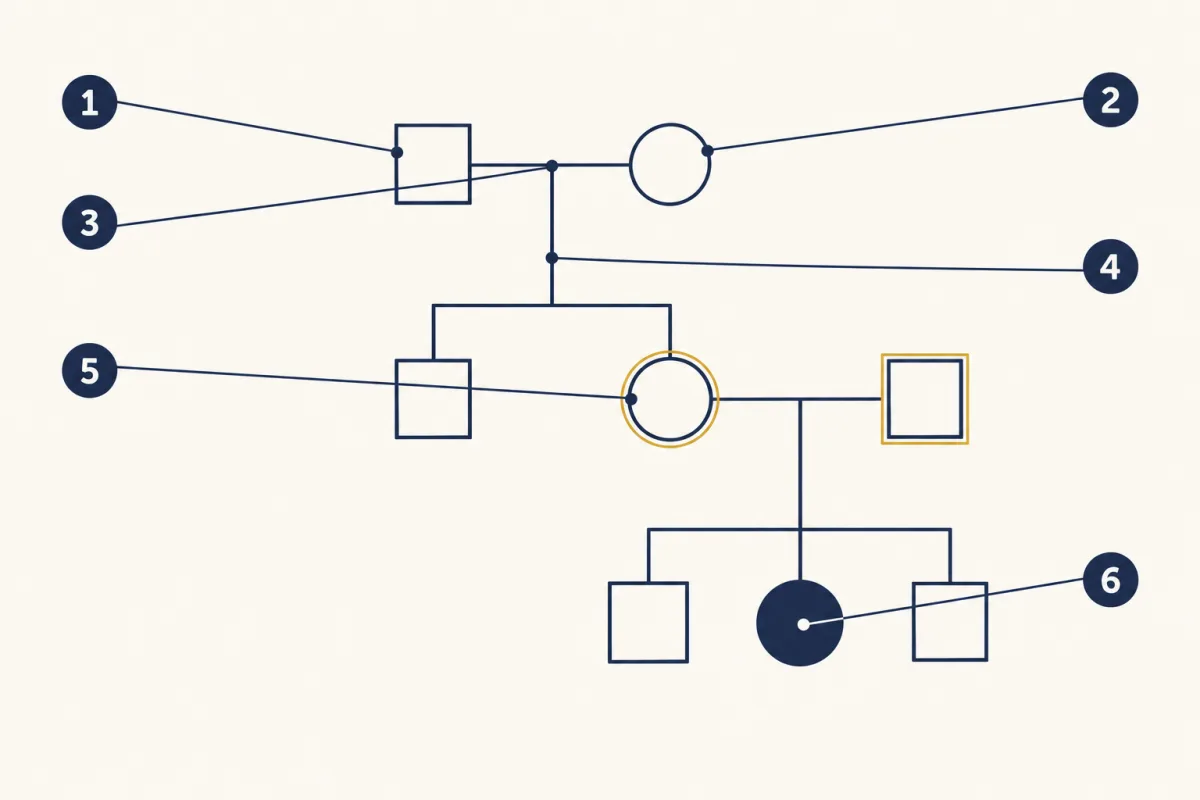
The second film showed how to test a pedigree, a chart showing who has a trait across generations. The full key adds what the film left out: which shape is which sex, and how people are numbered.
- A square is a male, and a circle is a female.
- Shading marks a person who shows the trait. The legend always says what the shading means.
- A horizontal line joins two partners. A vertical line drops from it to their children.
- Roman numerals (I, II, III) label generations, and numbers label people within a generation.
The film’s two clues apply to genes on the autosomes, the chromosomes that are not sex chromosomes. In the recessive clue, each unshaded parent of a shaded child must be a carrier, a heterozygote who carries a recessive allele but does not show the trait. In the dominant clue, a shaded child usually has a shaded parent. Once in a while, though, a new change in DNA starts a dominant trait in a family with no history of it. These are clues, not proofs. A small family may fit both models.
- square
- circle
- horizontal line
- vertical line
- carrier
- shaded symbol
- square
- circle
- blank
- blank
- blank
- blank
Word bank: carrier, horizontal line, shaded symbol, vertical line
- blank
- blank
- blank
- blank
- blank
- blank
Check your labels
- square
- circle
- horizontal line
- vertical line
- carrier
- shaded symbol
Explain: a karyotype counts whole chromosomes
A karyotype is a picture of a cell’s chromosomes sorted into matched pairs by size and shape. A typical human body cell with a nucleus has 46 chromosomes in 23 pairs: 22 pairs of autosomes and one pair of sex chromosomes, usually XX or XY.
Predict. A karyotype shows one X and no second sex chromosome. How many chromosomes does that cell have?
Check your prediction
It has 45 chromosomes, written 45,X. This chromosome pattern is linked to Turner syndrome.
Having three copies of chromosome 21, instead of two, is called trisomy 21. A cell with it has 47 chromosomes. It is the most frequent cause of Down syndrome. The CDC estimates that about 1 in 640 babies born in the United States has Down syndrome.
As the second film showed, nearly every body cell with a nucleus has the same genes, and skin and muscle cells differ because they use, or express, different sets of them. Mature red blood cells, which lose their nucleus, are the most common cells in your body. To see how cells copy DNA, read that lesson.
Elaborate: model predictions and real blood-type counts
| Row | What it describes | Share (%) | Kind of number |
|---|---|---|---|
| 1 | Red offspring, pink × pink snapdragons | 25 | expected by the model |
| 2 | Pink offspring, pink × pink snapdragons | 50 | expected by the model |
| 3 | White offspring, pink × pink snapdragons | 25 | expected by the model |
| 4 | U.S. blood donors with type O | 48.8 | measured |
| 5 | U.S. blood donors with type A | 36.0 | measured |
| 6 | U.S. blood donors with type B | 11.3 | measured |
| 7 | U.S. blood donors with type AB | 3.9 | measured |
Rows 1 to 3 are the expected shares for a pink × pink cross, from the OpenStax Biology 2e textbook (2018); they are not counts of real plants. Rows 4 to 7 come from American Red Cross records of 7,449,831 U.S. donors, March 2018 to February 2023. Allen and colleagues published them in PLOS One (2026), counting each donor once.
Predict. Which blood type was most common among these donors, and is it dominant or recessive in the usual model? What does the existence of type AB as its own group tell you about IA and IB? Which rows could change in a different group of people?
Check your prediction
Type O was most common although ii is recessive. Rows 4 to 7 depend on the sample; rows 1 to 3 are model predictions. Type AB shows IA and IB are codominant.
Claim, evidence, reasoning
Make a claim about what happens when neither allele is fully dominant, using this data.
Start with: The data show that when neither the A nor the B allele is dominant over the other, blank.
Start with: Among U.S. donors, blank percent were type AB, and type O, which is recessive, was blank percent.
Start with: This makes sense because people with IA IB show blank, and dominance tells you blank but not blank.
Compare with a model answer
When neither allele is dominant, the heterozygote has its own phenotype. Among 7,449,831 U.S. donors, 3.9 percent were type AB, a group that exists only because IA and IB are codominant and both markers show. The data also show that dominance does not predict how common a type is: type O, the recessive ii genotype, was the largest group at 48.8 percent. One limit is that donors are not a random sample of everyone. The same study found that hospital patients’ blood types differed from donors’, so another group could give different shares.
Saved in this browser only.
Design problem
A plant breeder has pink snapdragons. One idea is that pink is the heterozygote in an incomplete dominance pattern. Another is that pink is a third, true-breeding color. Plan crosses that would tell these ideas apart.
Saved in this browser only.
One way to do it
Cross pink plants with other pink plants, and also cross pink plants with white plants.
- Independent variable: the type of cross, pink × pink or pink × white.
- Dependent variable: the number of red, pink and white offspring.
- Constants: the same soil, water, light, pot size and growing time for all plants.
- Control of pollen: remove each flower’s pollen-making parts before they ripen, brush on pollen from the chosen parent, and cover the flower so insects cannot bring other pollen.
- Repeated trials: use several different pink parents.
- Sample size: grow at least 100 offspring per cross, because small counts swing widely.
If pink is RW, pink × pink should give about 1 red : 2 pink : 1 white, and pink × white about 1 pink : 1 white. If pink is true-breeding, pink × pink gives only pink.
Evaluate: check your thinking
Alleles remain separate, and each genetic tool reveals a different scale: a cross shows allele pairings, a pedigree tests models across a family, and a karyotype counts whole chromosomes.
Science practices you used: predicting before testing, using a Punnett square and a pedigree as models and naming their limits, telling model predictions from measured data, and planning controlled crosses with enough offspring.
Your notes
Select any text in the lesson to highlight it or add a note to it. Your highlights and notes are saved in this browser and collected in your notebook.
This browser is not letting the site save anything (a private window or strict privacy settings), so highlights and notes will be lost when you leave the page.
How we measure it
Karyotyping
Cells are grown, stopped while their chromosomes are packed tight, stained and photographed, and the chromosomes are sorted into pairs by size and shape. It shows the number and large changes of chromosomes, not single genes.
Pedigree analysis
A family is drawn as a chart of symbols, with people who show a trait shaded. Geneticists test whether a dominant or a recessive model fits every person in the chart.
ABO blood typing
A drop of blood is mixed with antibodies that stick to the A or the B marker on red blood cells. Clumping shows which markers the cells carry, which gives the blood type.
Where this lesson fits
Before thisReview first
- Mendel and Punnett SquaresThis course · Lesson 20
You need its Punnett squares and the ideas of dominant and recessive alleles to see how these crosses differ.
- Meiosis and VariationThis course · Lesson 19
Each parent passes on one allele of each pair through sex cells, which is why alleles stay separate here.
After thisStudy next
- Engineering GenesThis course · Lesson 22
It moves one chosen gene into another organism, using the idea that genes are the same units in every cell.
Elsewhere on the siteFilms, simulations and method films in other courses
- Pedigree analysisMethod film
This method film shows how to read carrier risk and inheritance from family trees, as the lesson's pedigree section does.
Suggested by an AI model from the lessons themselves, then checked. How we use AI
Finish line
Test yourself
8 questions
Practice and MCAT-style, with explained answers.
Next · Lesson 22
Engineering Genes
Bacteria do not naturally carry a human insulin gene, so how can they make human insulin?
Continue →