Ecology and Evolution · Skim version
Demography and Survivorship
Read the full lesson → Skim the whole course →
The guiding idea
Only 10 of 100 newborn females live to age 3. Can the cohort still more than replace itself?
Whether a population can replace itself depends on survival and births at each age: R0, the sum of l_x m_x, is the number of daughters an average newborn female leaves.
From the film: Survive, Then Give Birth
- A cohort is a group of females born together; l_x is the fraction still alive at age x, and m_x is the average number of daughters per live female at that age.
- R0, the sum of l_x times m_x over all ages, is the number of daughters an average newborn female leaves.
- If R0 is above 1 the cohort more than replaces itself; below 1 it does not. R0 is counted per generation, not per year.
- Survival to any age is the product of every earlier year's survival, so with later rates unchanged, a loss early in life lowers every later term of R0.
- R0 predicts long-run growth only if the rates stay fixed and nobody arrives or leaves.
From the film: A Straight Line on a Log Axis
- A survivorship curve plots l_x against age, usually on a logarithmic axis, where equal drops mean equal fractions lost.
- Type II means a constant probability of death each interval: the same fraction dies, so the number dying shrinks and the log curve is a straight line.
- Type I curves stay high and then plunge, with deaths late in life; Type III curves drop steeply early, then flatten.
- In laboratory Hydra, ten of twelve cohorts kept a yearly chance of natural death near 0.006, with no systematic fall in fertility (budding) with age.
- That is a laboratory counterexample to a universal rise in mortality with age, not evidence that Hydra are immortal.
-
The worked cohort, column by column
-
Generation time and a yearly rate
-
Survivorship curves and age structure
-
Where the numbers come from, and what they miss
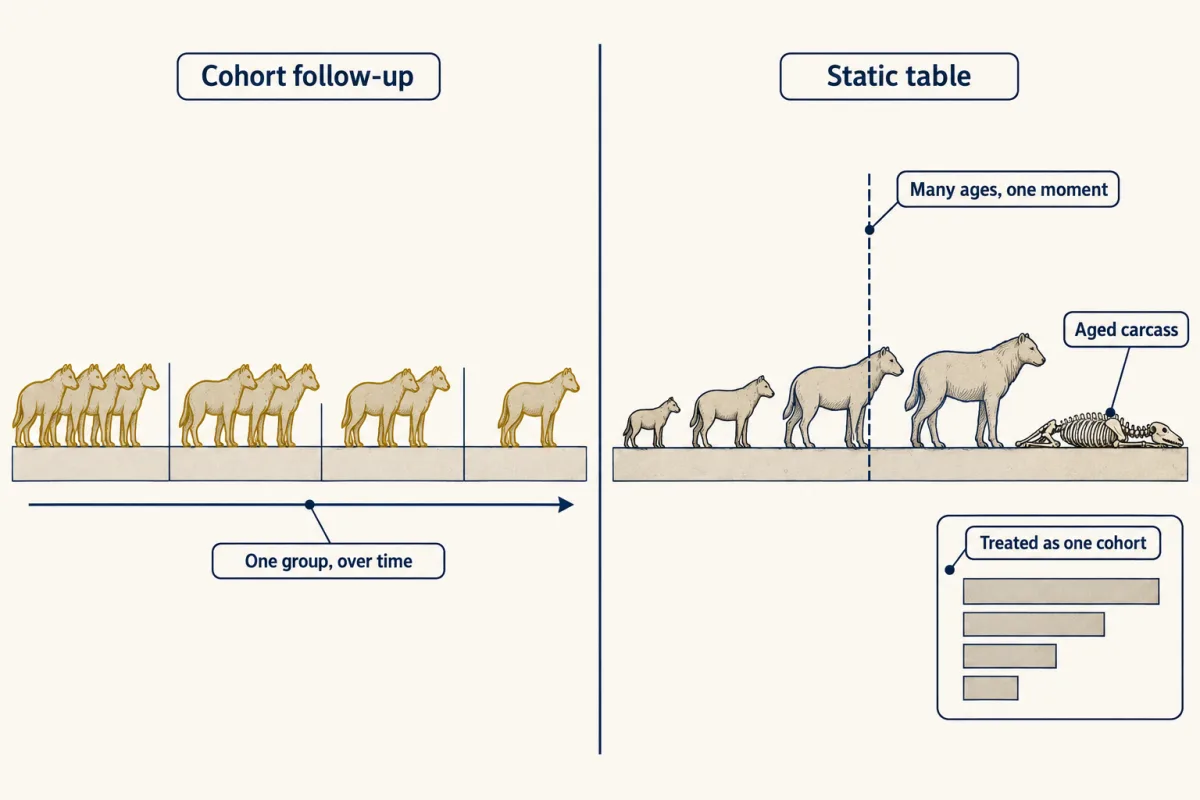
A cohort follow-up watches one birth group over time. A static table takes a snapshot, ageing every individual alive or every carcass, and reads the counts as one cohort's survivors or deaths, which works most simply if the population is stationary and every age is sampled fairly. AI-generated illustration 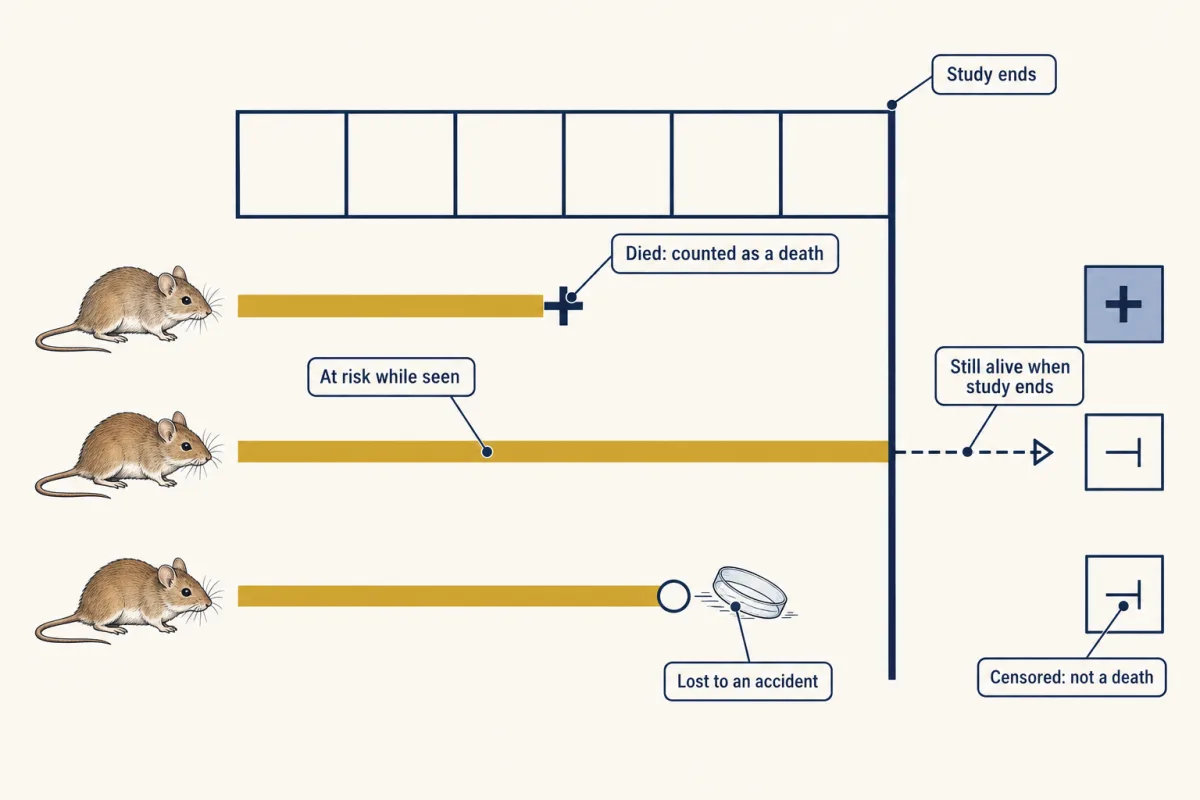
Censoring on one timeline: an animal that dies is a death. An animal still alive when the study ends, or lost to an accident in a study of natural deaths, counts as at risk for the time it was seen and is not counted as a death. AI-generated illustration -
Going deeper
Where this lesson fits
Before thisReview first
- Probability, Crosses and the Chi-Square TestGenetics and Molecular Biology · College: the core
Survival to an age is a product of each year's survival, the same product rule you use for crosses.
After thisStudy next
- Population Growth and RegulationThis course · Lesson 14
It takes the r and yearly multiplier from a life table and uses them to model exponential and logistic growth.
- Movement and Spatial PopulationsThis course · Lesson 15
It takes further how emigration and missed animals make apparent survival fall below true survival.
Suggested by an AI model from the lessons themselves, then checked. How we use AI